Inspiration There are many chart in English and other languages ,and most Iraqi people only read Arabic, so I decided to create website that show the infection chart on daily basis so everyone can see how cases are growing and people get more informed and educated, also planning to add online symptoms tests to be available for them
What it does
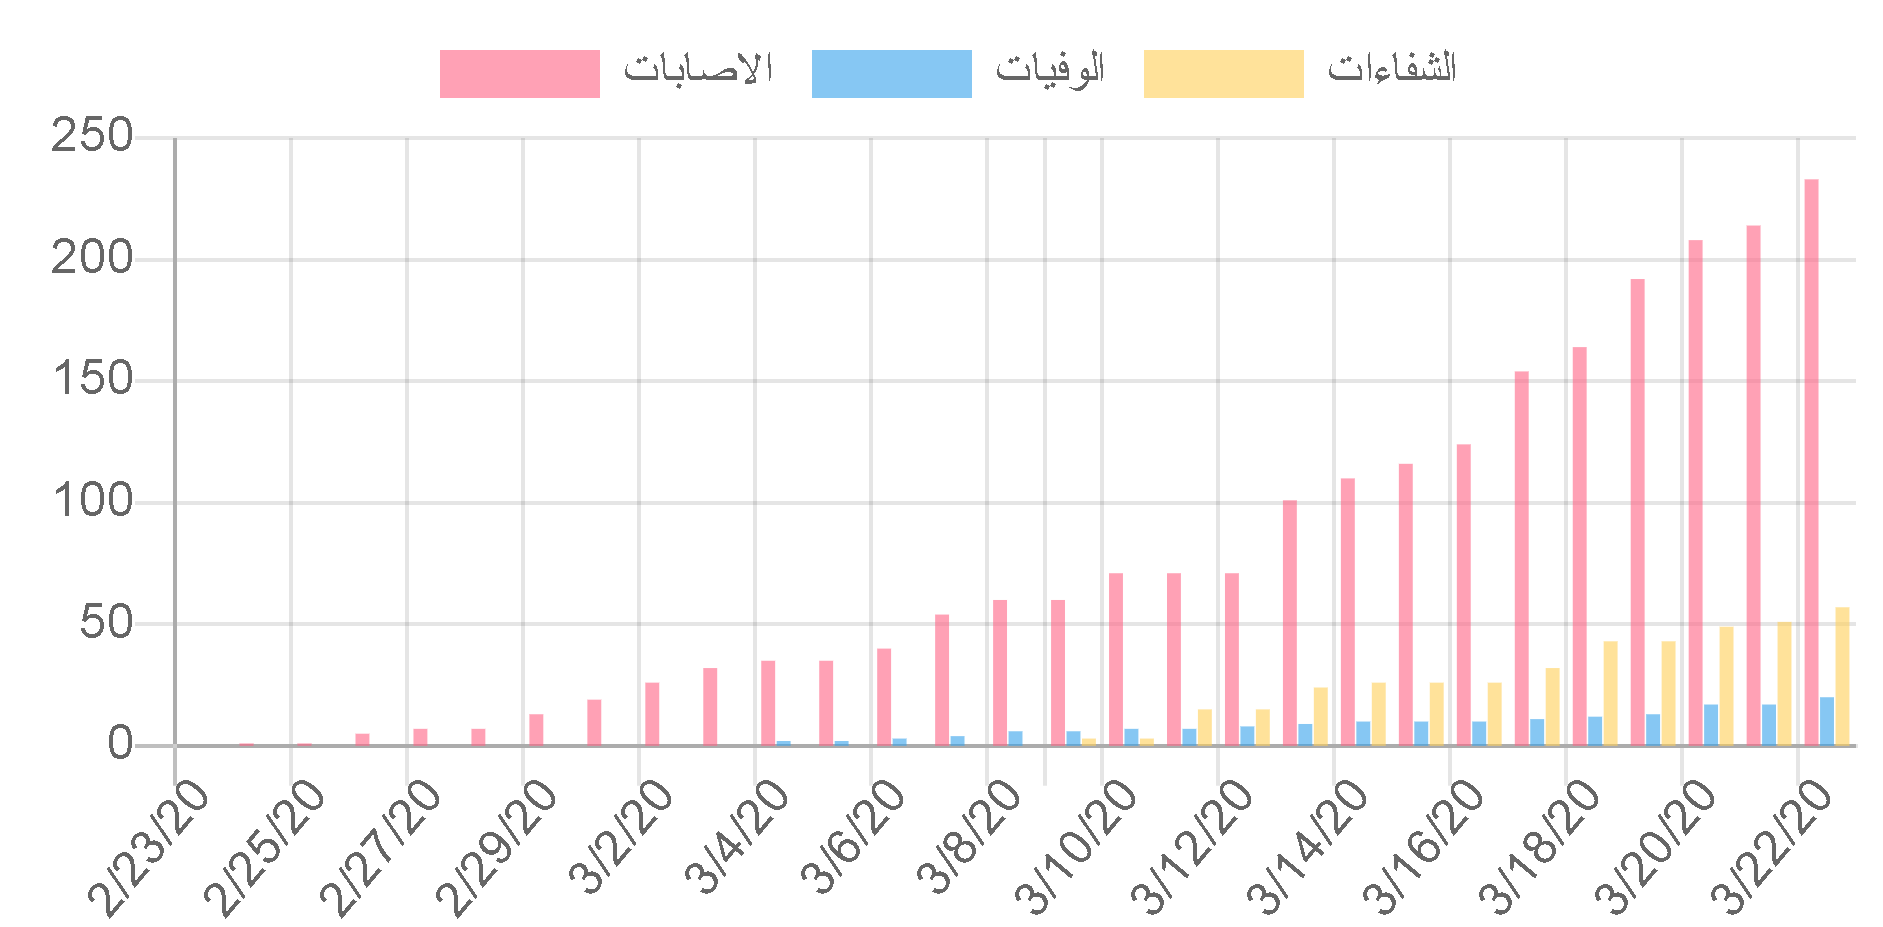
Provide a chart to the daily growth of infected people in Corona virus in Arabic language
How I built it
I built it using Azure cloud to get data-set and parse them , then cache the info , while angular client side website plot the info using chart.js
Challenges I ran into
Getting good chart component,
Accomplishments that I'm proud of
Proud to provide such as website for people to help them able to understand how the infected people numbers are growing so they can be more careful
What I learned
Helping people is a good win Cloud helped me do fast deployment
What's next for Iraqi Corona virus statistics
Adding chart for each province in Iraq, currently ministry of health producing the info as news letter to I have to build another parse to extract the data from the message.


Log in or sign up for Devpost to join the conversation.