Overview
IR Spectrum Predictor uses a SchNet-based Graph Neural Network to predict infrared (IR) transmittance spectra from a molecule's SMILES string. Given any valid SMILES input, the model generates a 250-point spectrum across the 400–4000 cm⁻¹ wavenumber range — no lab required.
The pipeline is end-to-end:
SMILES → 3D Conformer (RDKit) → SchNet GNN → 250 transmittance values → IR Spectrum
A FastAPI server wraps the model and serves both a clean web UI and a JSON API, making predictions accessible from any browser or programmatically.
Features
- 🧪 SMILES → IR spectrum in seconds
- 🤖 SchNet GNN with physics-informed distance-based message passing
- 🌐 REST API with single and batch prediction endpoints
- 📊 Live plot — returns a PNG of the spectrum directly in the browser
- 📡 NIST data pipeline — automated fetching and parsing of IR spectra from NIST WebBook
- 🎛️ Clean web UI — dark-themed interface with quick-pick example molecules
Project Structure
├── schnet_ir.py        # SchNet GNN model — training and prediction
├── api.py              # FastAPI server with web UI and REST endpoints
├── fetch_ir_spectra.py # NIST WebBook data fetcher — builds the training CSV
├── plot_ir.py          # Utility to plot and compare predicted vs real spectra
├── requirements.txt    # Python dependencies
└── best_model.pt       # Trained model checkpoint (generated after training)
Quickstart
1. Install dependencies
pip install -r requirements.txt
Note: If you have NumPy 2.x installed, downgrade it first — RDKit requires NumPy < 2:
pip install "numpy<2" --force-reinstall
2. Fetch training data
Fetches IR spectra from NIST WebBook for ~200 common organic molecules and saves them to ir_spectra.csv:
python fetch_ir_spectra.py
This takes ~5–10 minutes due to rate limiting. Expect 100–150 successful compounds.
3. Train the model
python schnet_ir.py --mode train --csv ir_spectra.csv
Training output:
Dataset: 135 molecules loaded.
Training on cpu | 108 train, 27 val molecules

Epoch    1 | train MSE: 0.208796 | val MSE: 0.192095 | val MAE: 0.4233
Epoch   10 | train MSE: 0.095625 | val MSE: 0.062141 | val MAE: 0.1680
...
Early stopping at epoch 46.
Best val MSE: 0.061315 → saved to 'best_model.pt'
4. Predict a spectrum
python schnet_ir.py --mode predict --smiles "CCO" --checkpoint best_model.pt
Saves predicted_ir_CCO.csv with 250 wavenumber/transmittance pairs.
5. Launch the API
uvicorn api:app --reload --port 8000
Open http://localhost:8000 in your browser.
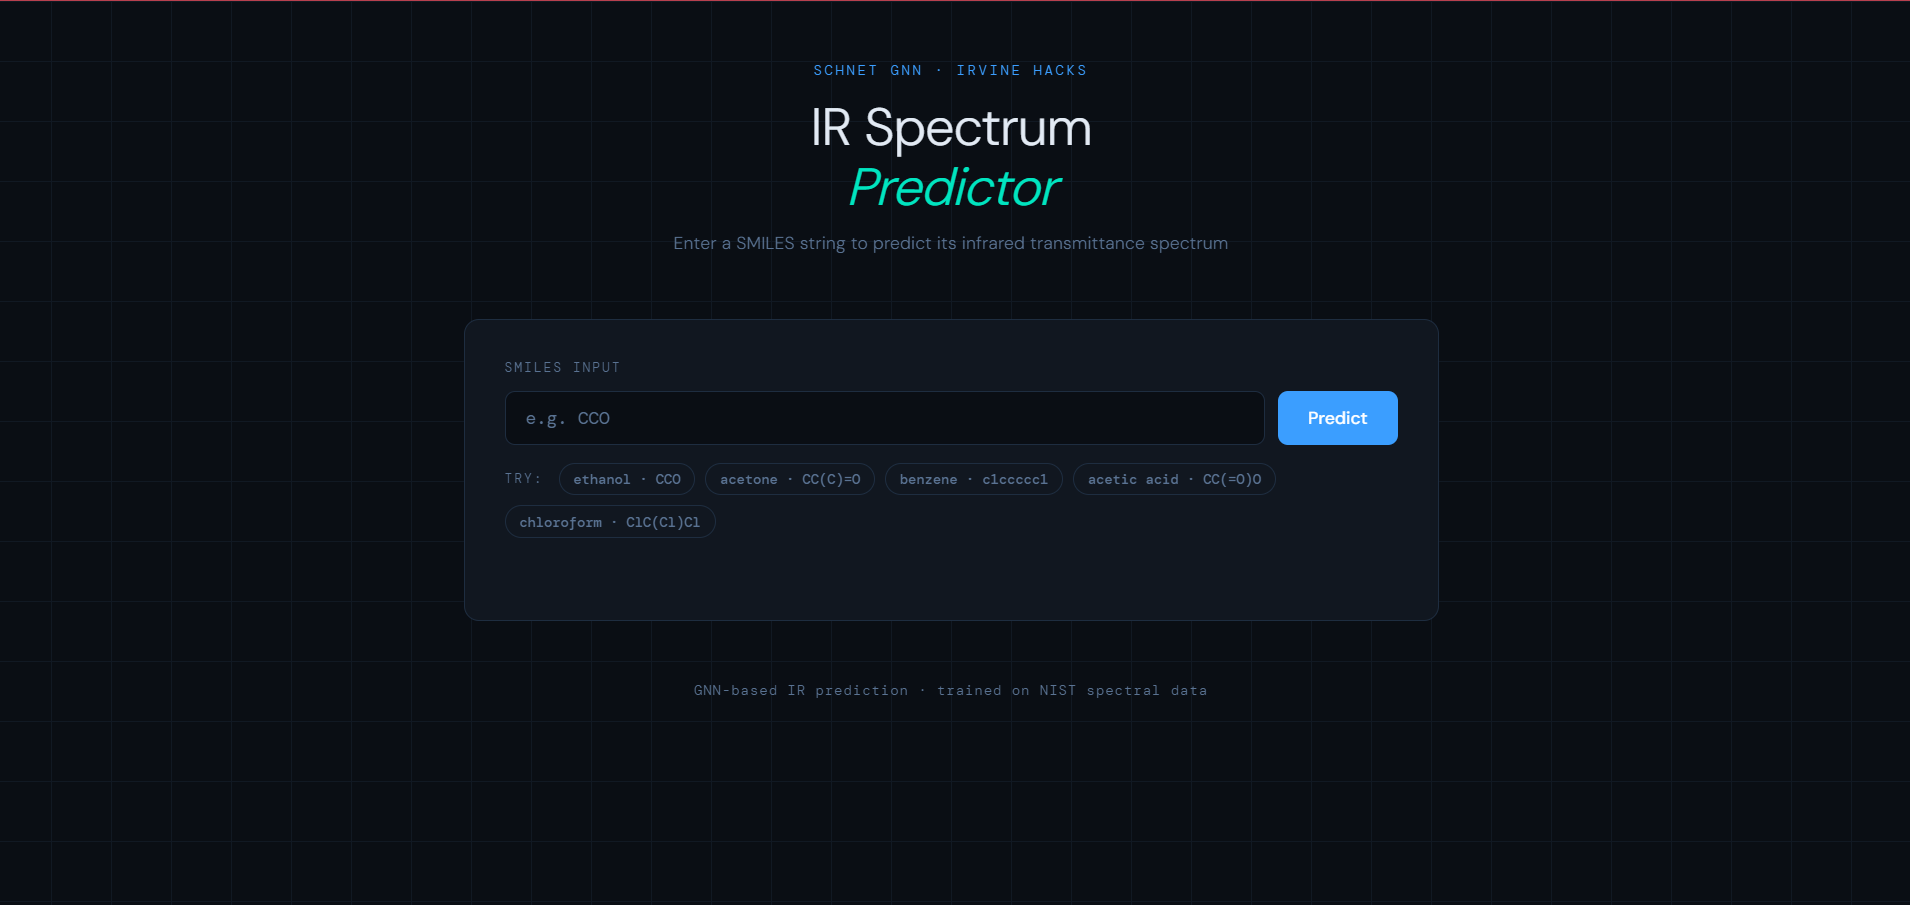
Web UI
The web interface lets you type any SMILES string and instantly see the predicted IR spectrum:
- Type a SMILES string or click one of the quick-pick example molecules
- Hit Predict (or press Enter)
- The predicted spectrum renders as an interactive plot
- Download the PNG with one click
API Endpoints
| Method | Endpoint | Description |
|---|---|---|
GET |
/ |
Web UI |
GET |
/plot?smiles=CCO |
Returns PNG of predicted spectrum |
POST |
/predict |
Returns JSON with wavenumbers + transmittance |
POST |
/predict/batch |
Batch prediction for multiple SMILES |
GET |
/health |
Health check |
GET |
/docs |
Auto-generated API documentation |
Example: Single prediction
curl -X POST http://localhost:8000/predict \
     -H "Content-Type: application/json" \
     -d '{"smiles": "CCO"}'
{
  "smiles": "CCO",
  "wavenumbers": [400.0, 414.46, ..., 4000.0],
  "transmittance": [0.151, 0.167, ..., 0.163]
}
Example: Batch prediction
import requests

r = requests.post("http://localhost:8000/predict/batch", json={
    "smiles_list": ["CCO", "CC(C)=O", "c1ccccc1"]
})
print(r.json())
Example: Get plot in browser
http://localhost:8000/plot?smiles=c1ccccc1
Model Architecture
SchNet is a physics-inspired GNN originally designed for quantum chemistry. It uses continuous-filter convolutions driven by real 3D atomic distances rather than discrete graph topology.
Atom features (23-dim)
        ↓
  Linear embedding (64-dim)
        ↓
  ┌─────────────────────┐
  │  Interaction Block  │ × 2
  │  ─────────────────  │
  │  CFConv (distance-  │
  │  weighted messages) │
  │  + Dropout (0.1%)    │
  └─────────────────────┘
        ↓
  Global sum pooling
        ↓
  MLP head (64 → 32 → 250)
        ↓
  Sigmoid → transmittance [0, 1]
Key hyperparameters:
| Parameter | Value |
|---|---|
| Hidden dimension | 128 |
| Interaction blocks | 3 |
| Cutoff radius | 5.0 Å |
| Gaussian basis functions | 50 |
| Dropout | 0.1% |
| Weight decay | 1e-5 |
| Optimizer | Adam (lr=1e-3) |
| Early stopping patience | 40 epochs |
Training Data
Spectra are sourced from the NIST WebBook using nistchempy and a direct JDX fallback fetcher. Each raw spectrum is:
- Parsed from JCAMP-DX format
- Interpolated to 250 evenly-spaced points over 400–4000 cm⁻¹
- Saved as transmittance values in
[0, 1]
The CSV format expected by the model:
Name of molecule, SMILES, point 1, point 2, ..., point 250
ethanol, CCO, 0.82, 0.79, ...
Visualizing Results
Compare predicted vs real spectrum:
python plot_ir.py predicted_ir_CCO.csv --compare ir_spectra.csv --name ethanol
Requirements
- Python 3.10+
- PyTorch 2.0
- See
requirements.txtfor full list
Team
Built at Irvine Hacks 2025
*Predicting molecular IR spectra with graph neural networks* *(Keep in mind some code involving getting the computational data (not experimental) is not functionable at that time. Run the Neural network file (schnet.nn or test_run_IR_gnn & the api.py. MUST have the 200mol_fixed.csv file in the same folder. Falls under Beginner Category (since Samuel and I are both first time going in a hackathon at the time doing this project.*

Log in or sign up for Devpost to join the conversation.