-
Intro
-

Overview
-

Technical analysis
-

Data pre-processing
-
Model Architecture
-
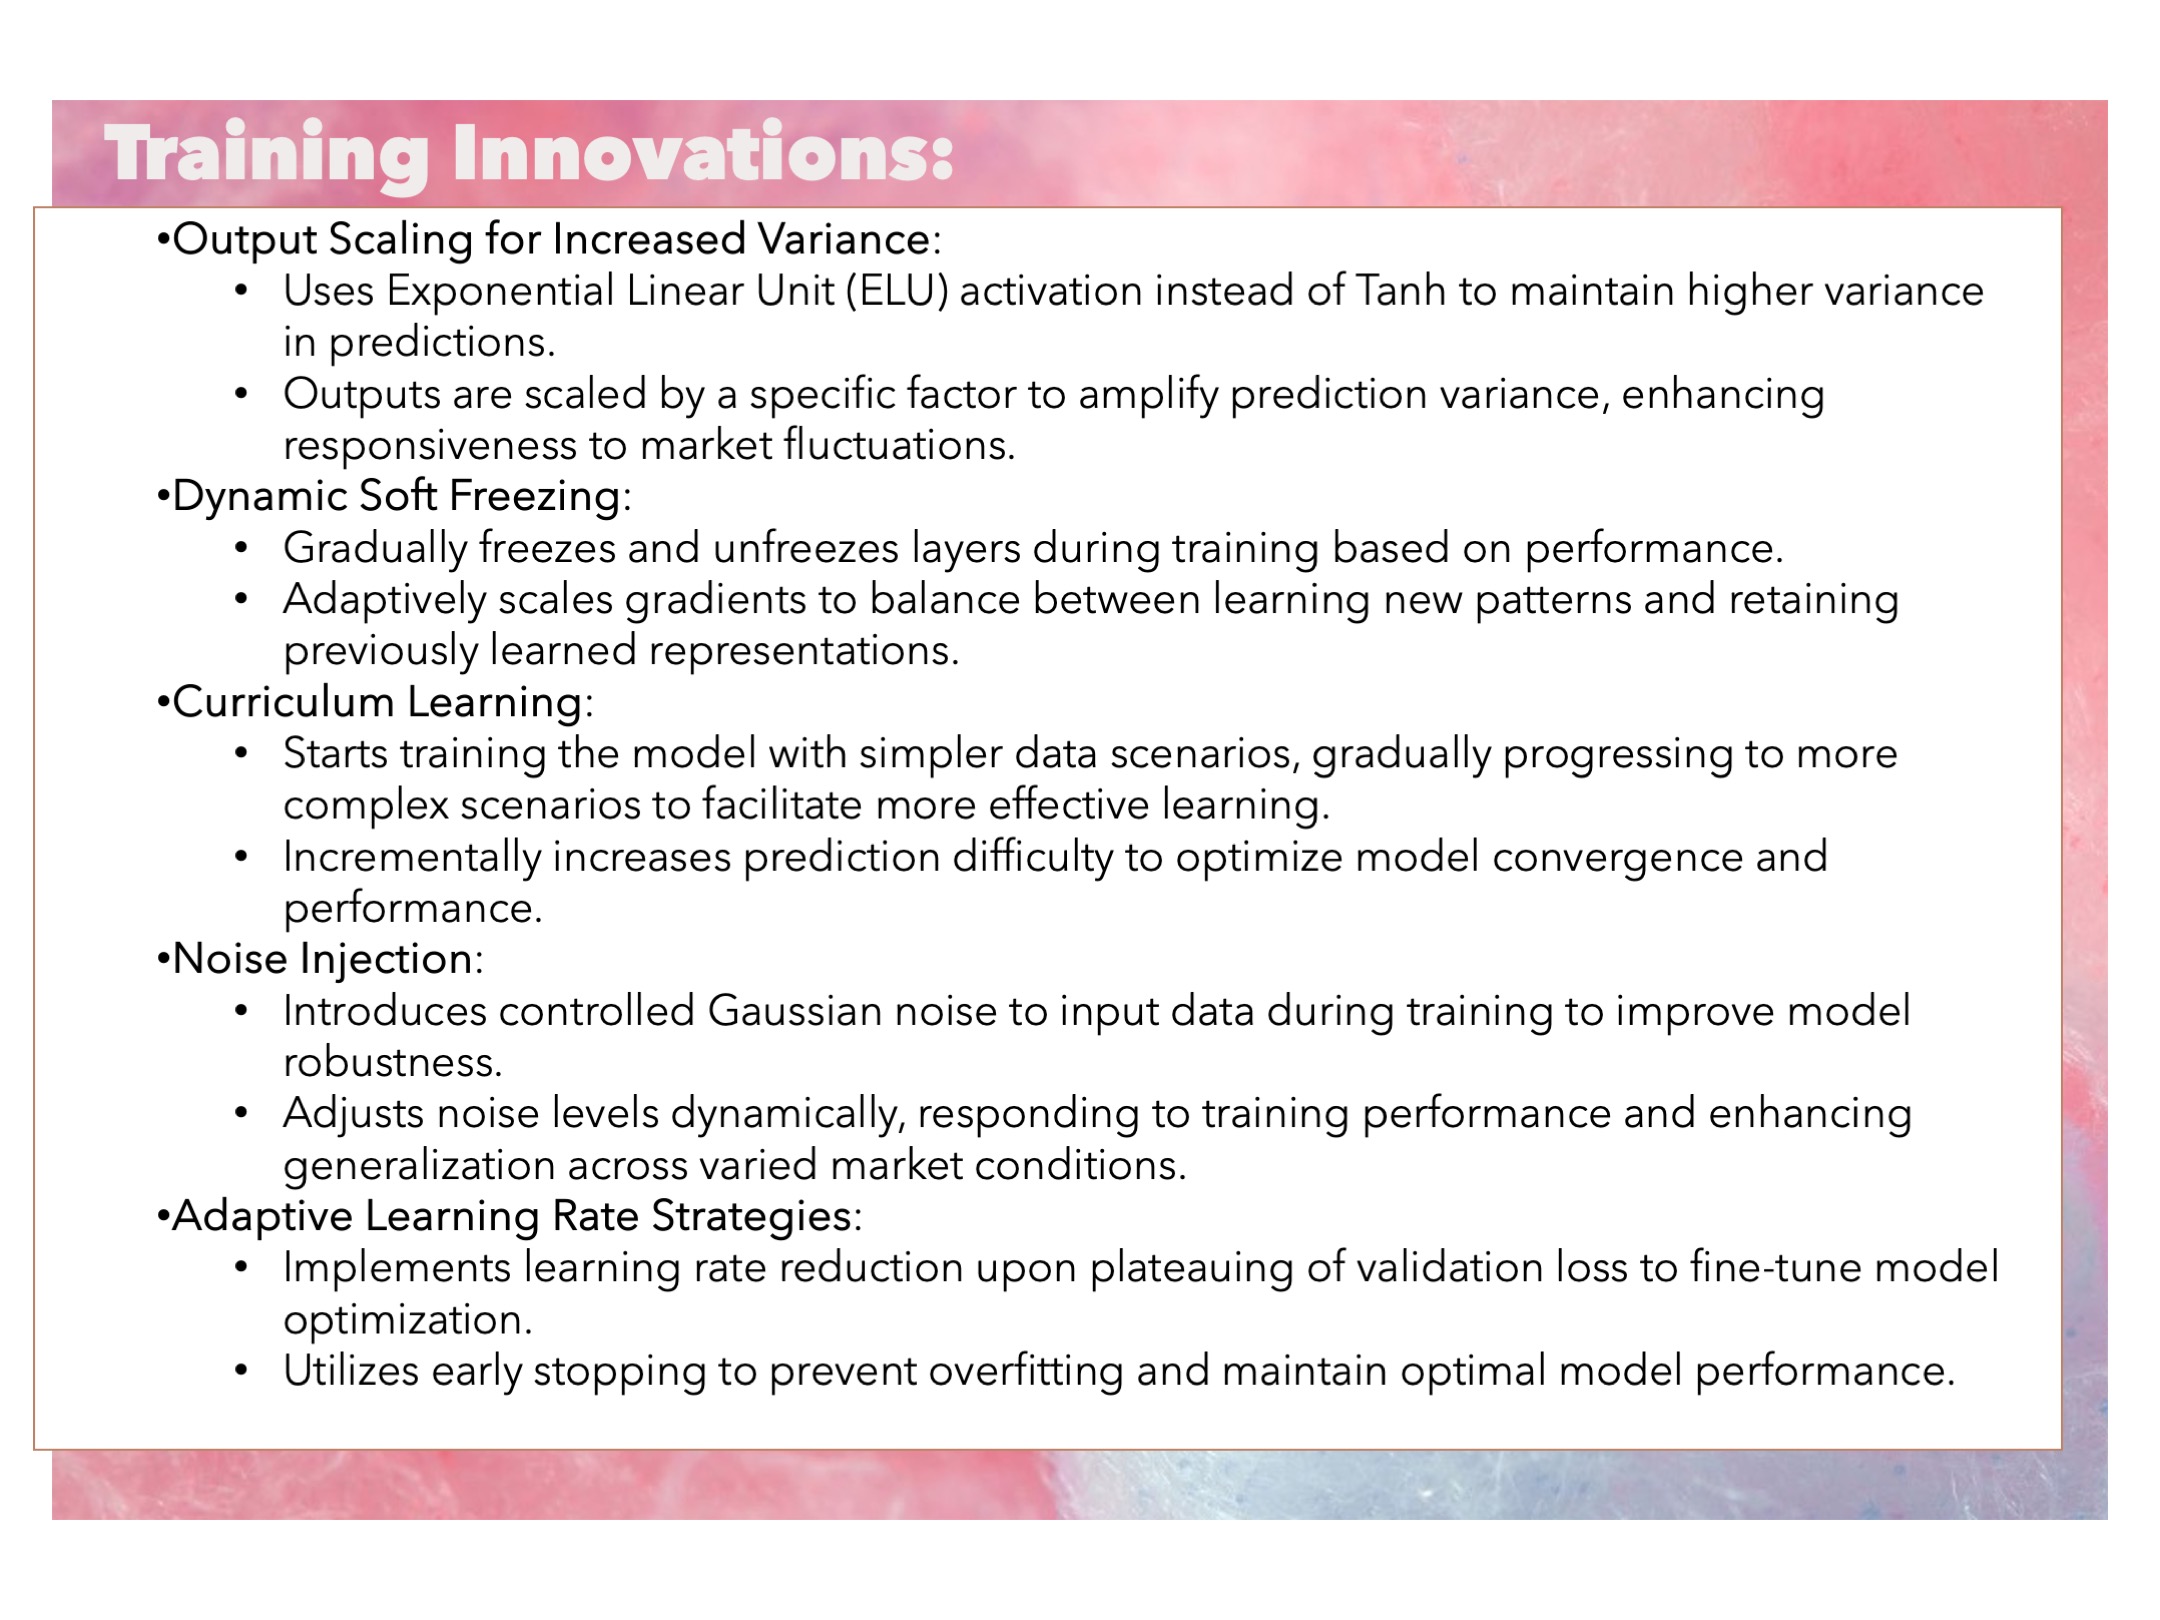
Training Innovations
-
Evaluation results
-
Future work
-
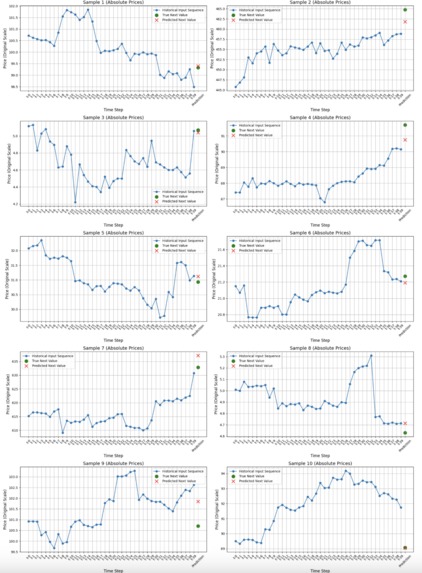
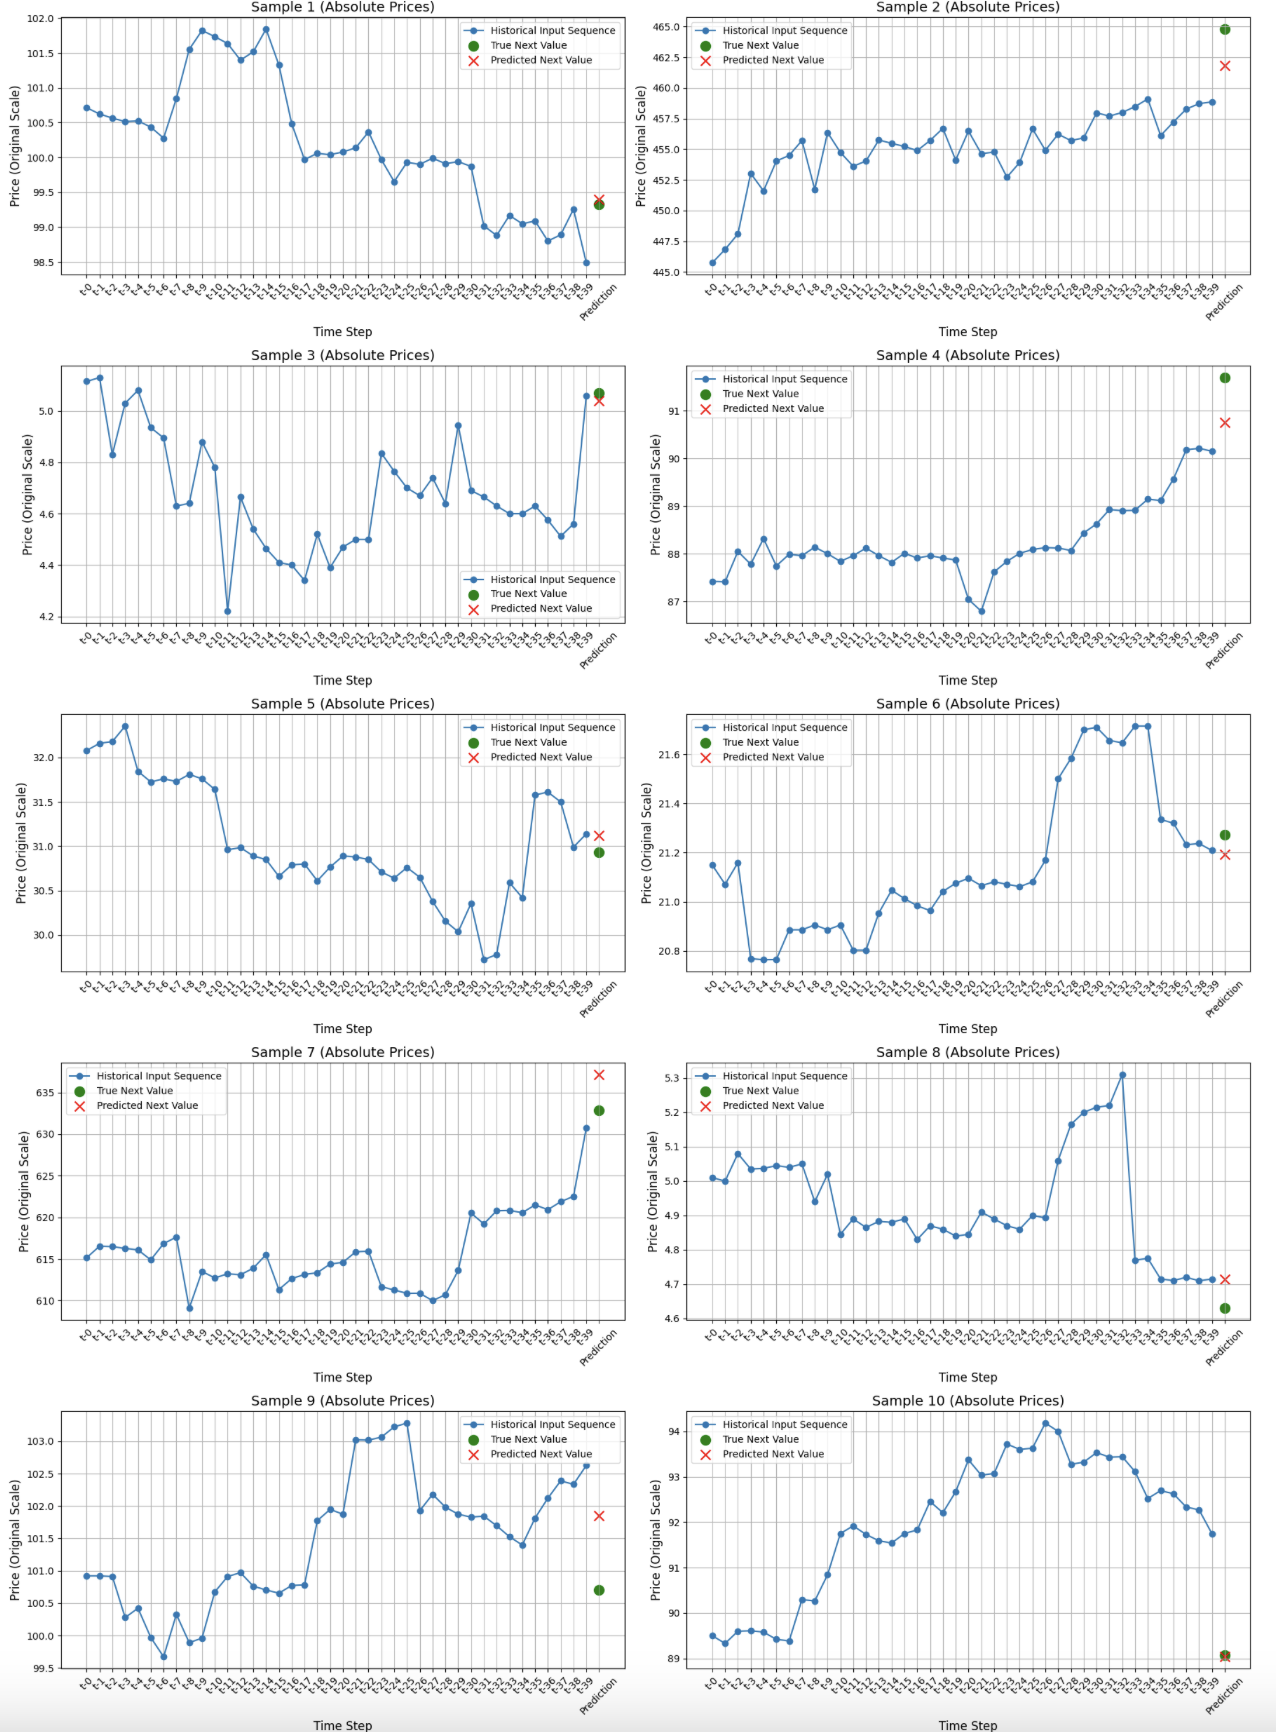
10 random samples


Inspiration
I have always been fascinated by physics and game theory, and I'm captivated by the idea that our seemingly chaotic world can be accurately predicted. Mathematics provides the framework to forecast the behavior of the physical world; the more information we have about a system, the more accurately we can predict its outcomes. If we can predict something as complex as our natural environment, then it should be relatively straightforward to determine the outcome of a virtual system, where most of the factors are visible. Motivated by this belief, I developed a trading model to test how effectively artificial intelligence—a new framework that leverages vast amounts of data—can predict the outcome of such a virtual system.
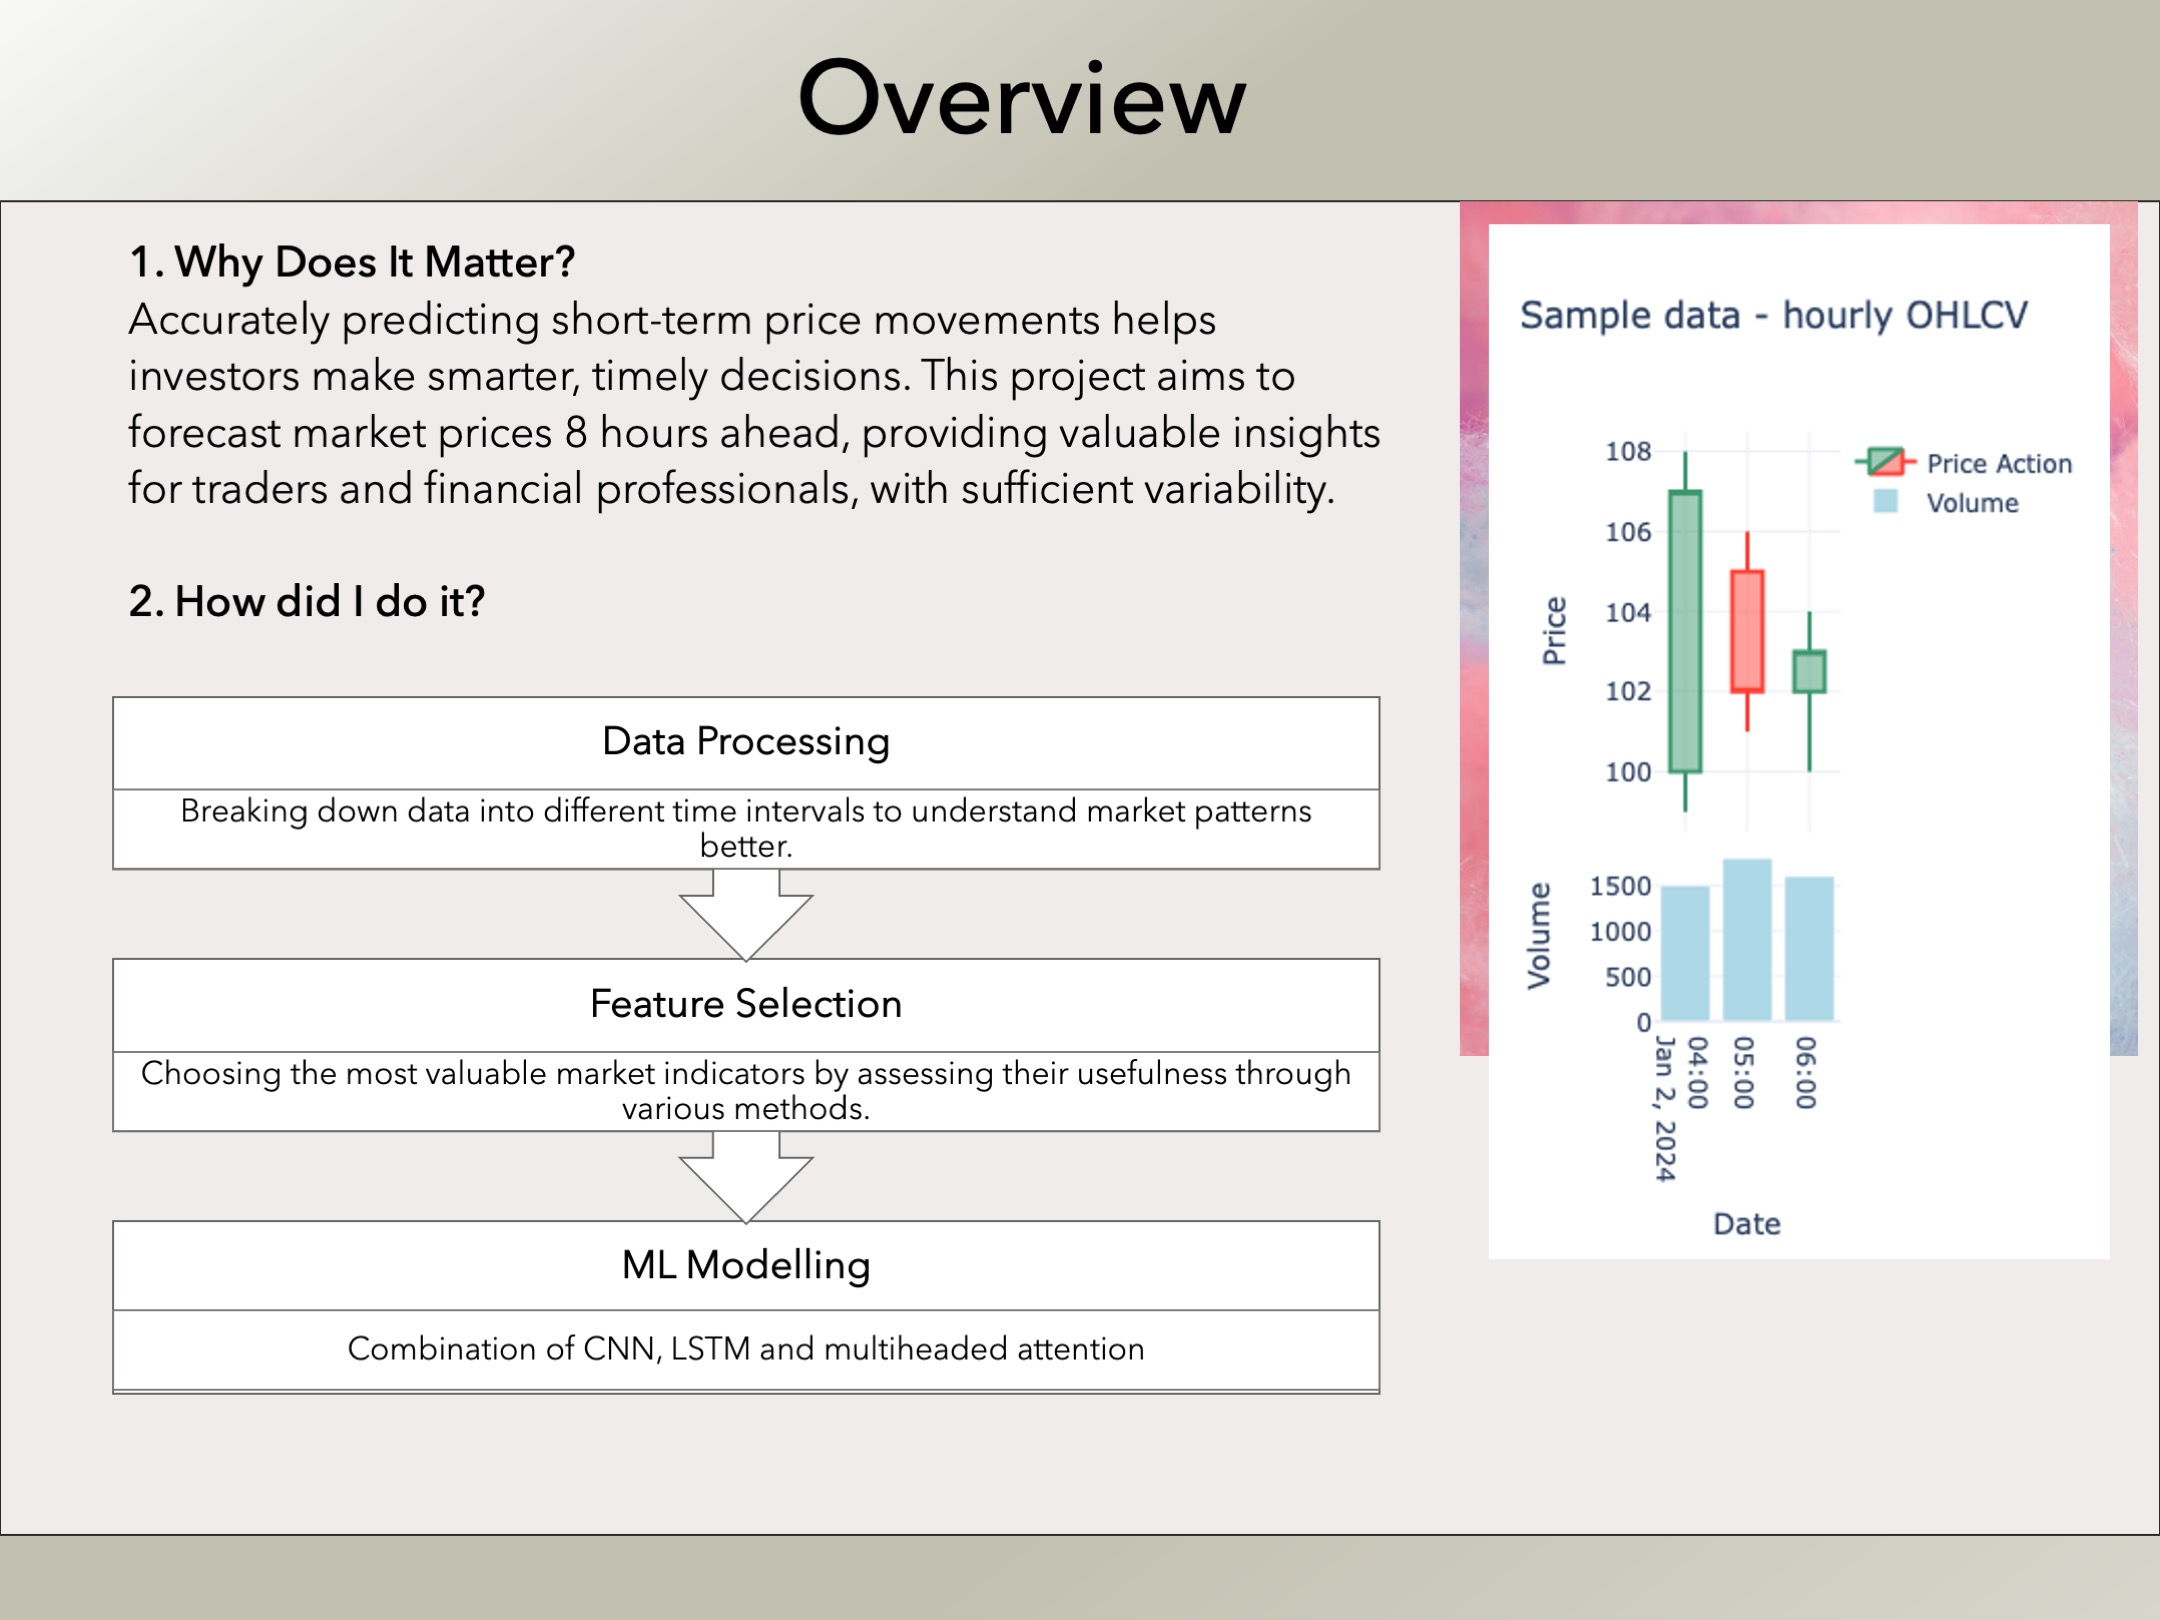
What it does
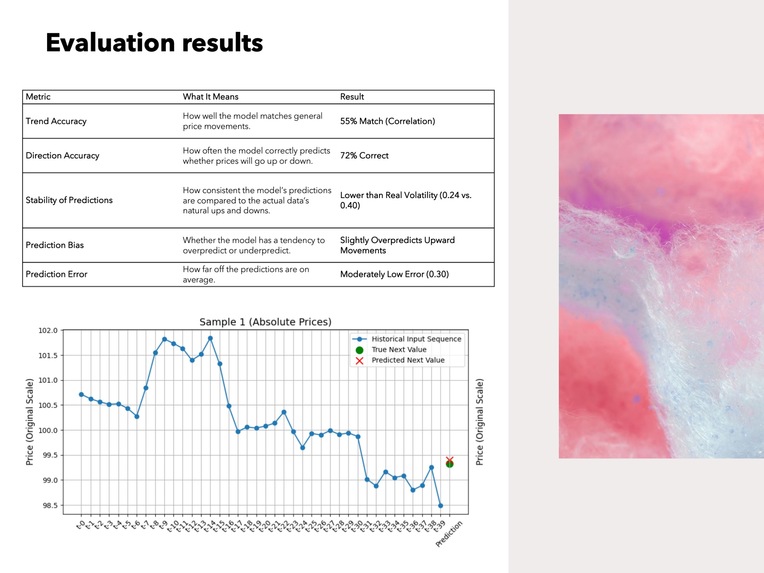
The model predicts the price change of any stock regardless of the company. It uses only the hourly OHLCV (open, high, low, close, volume) data from the past 5 days, as all the features are derived from these, to forecast the price change expected over the next 8 hours. The accuracy of these predictions is evaluated using a set of performance metrics, which provide insight into both the statistical properties of the predictions and their practical effectiveness.
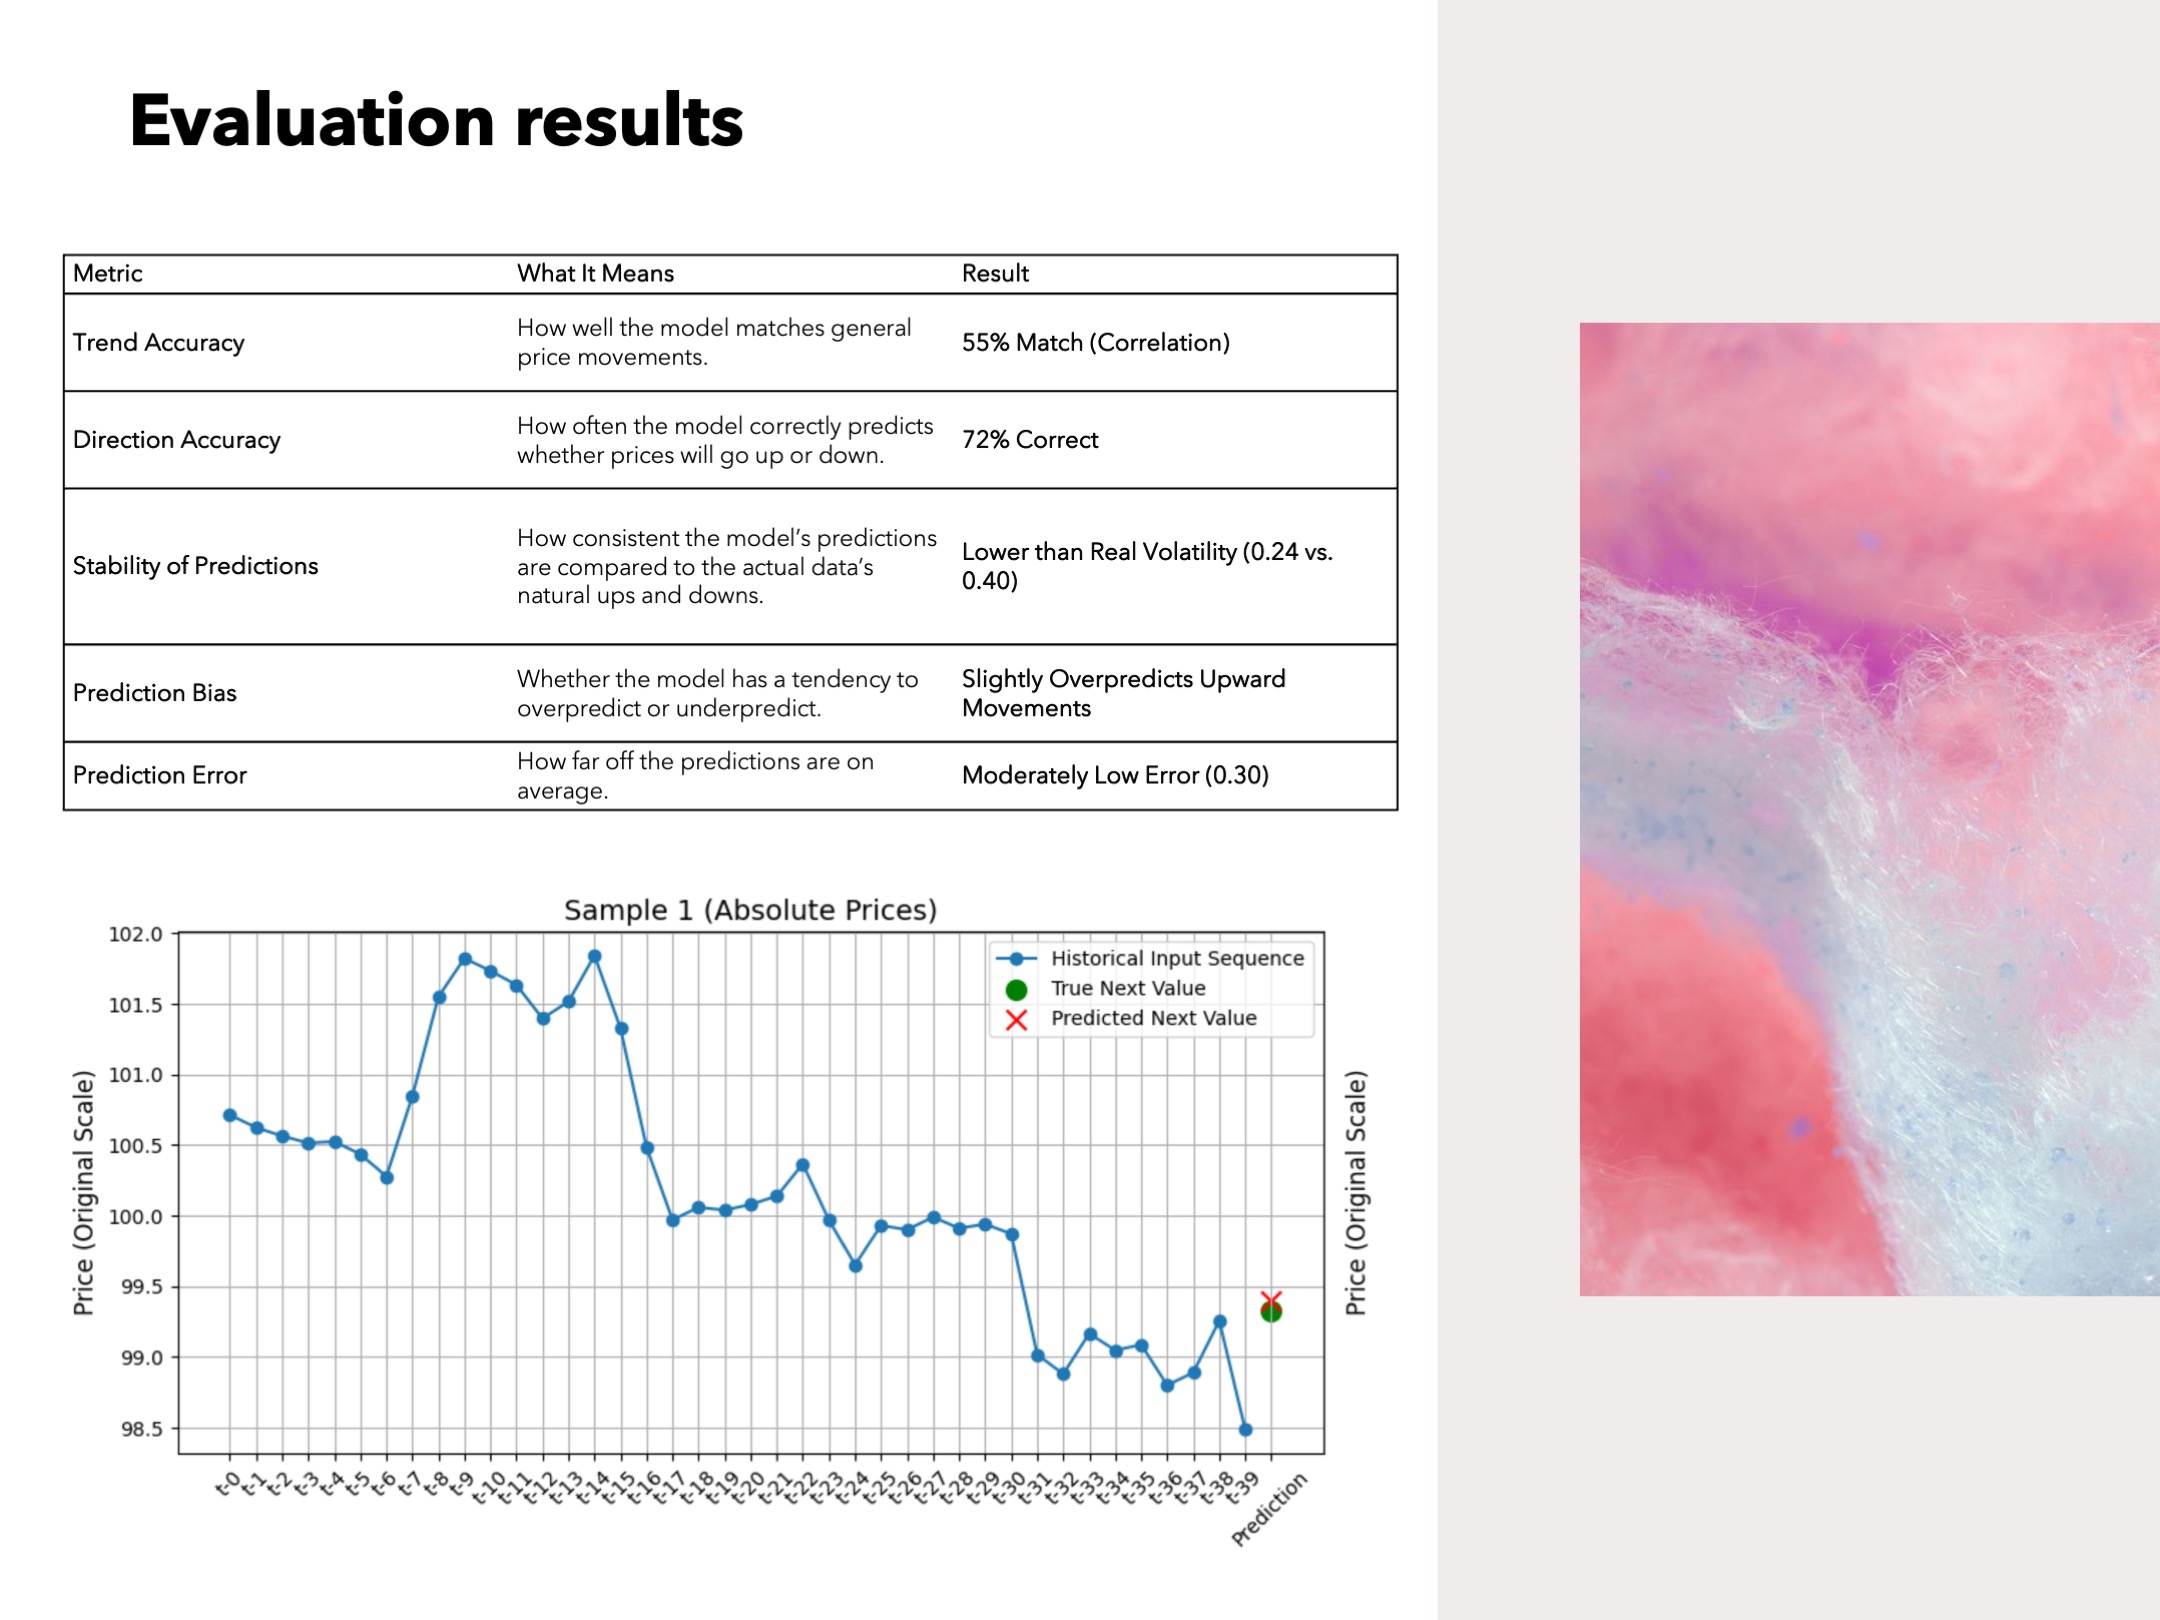
- Trend Accuracy, How well the model matches general price movements: 55% Match (Correlation)
- Direction Accuracy, How often the model correctly predicts whether prices will go up or down: 72% Correct
- Stability of Predictions, How consistent the model’s predictions are compared to the actual data’s natural ups and downs: Lower than Real Volatility (0.24 vs. 0.40)
- Prediction Bias, Whether the model has a tendency to overpredict or underpredict: Slightly Overpredicts Upward Movements
- Prediction Error, How far off the predictions are on average: Moderately Low Error (0.30)
How we built it
Feature Engineering
Creating a diverse set of indicators is important to describe the data, these include, momentum-based features and features that describe trend and volatility from the raw OHLCV prices. Examples include – ATR, ATR14, long-term rolling standard deviations, MACD and Stochastic Oscillator etc. Composite features were also found to have good predictive capabilities, particularly multiplying different features together.
Data Exploration
Data exploration is a critical first step in any machine learning project. By understanding the statistical characteristics of a dataset—such as skewness and the presence of long tails—we can identify potential issues early on. Highly skewed data or data with long tails can bias predictions, potentially leading to overfitting and a loss of accuracy. Moreover, if the data is negatively skewed and not properly standardized, even the most advanced ML architectures may perform poorly.
Feature Selection
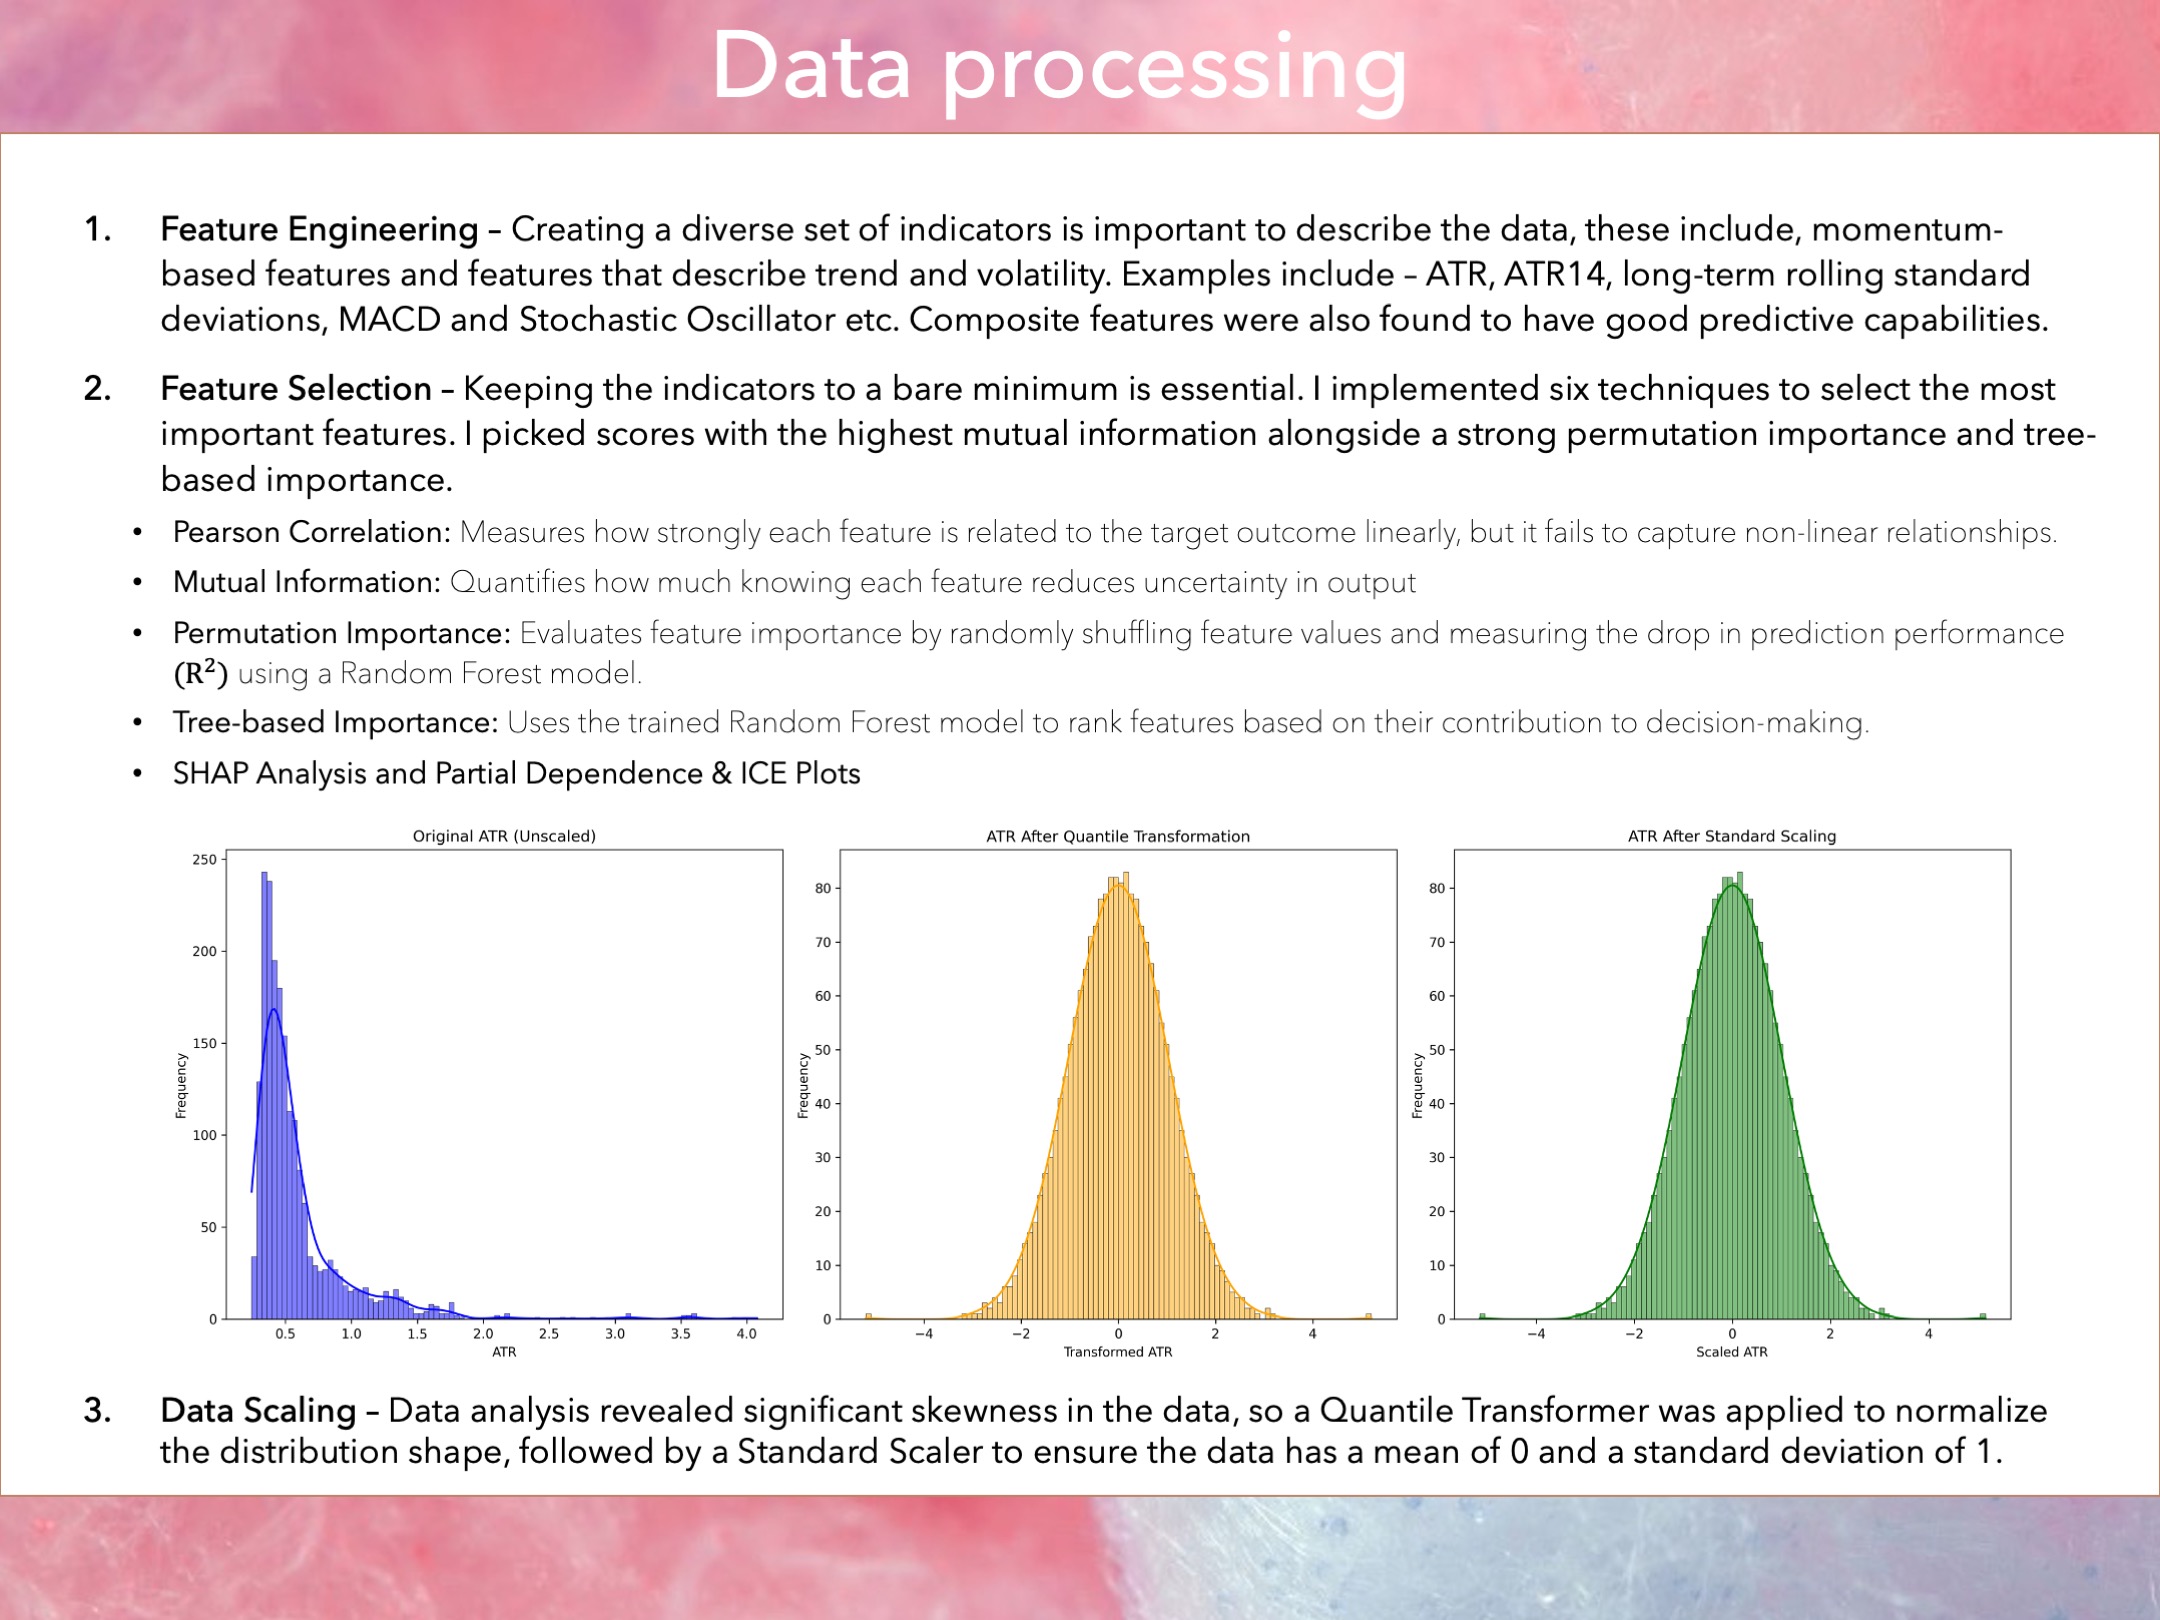
Keeping the indicators to a bare minimum is essential. I implemented six techniques to select the most important features. I picked scores with the highest mutual information alongside a strong permutation importance and tree-based importance.
- Pearson Correlation: Measures how strongly each feature is related to the target outcome linearly, but it fails to capture non-linear relationships.
- Mutual Information: Quantifies how much knowing each feature reduces uncertainty in output
- Permutation Importance: Evaluates feature importance by randomly shuffling feature values and measuring the drop in prediction performance using a Random Forest model.
- Tree-based Importance: Uses the trained Random Forest model to rank features based on their contribution to decision-making.
- SHAP Analysis and Partial Dependence & ICE Plots
Data Scaling
Data analysis revealed significant skewness in the data, so a Quantile Transformer was applied to normalize the distribution shape, followed by a Standard Scaler to ensure the data has a mean of 0 and a standard deviation of 1.
Model Architecture -
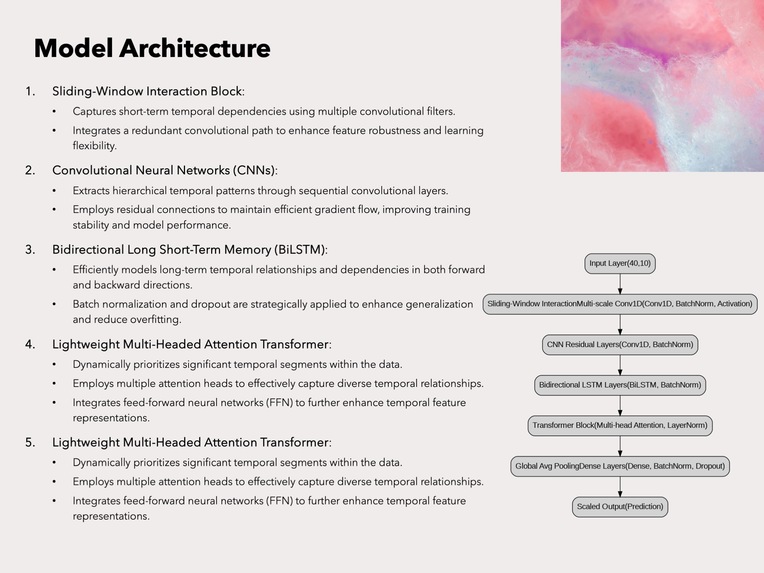
- Sliding-Window Interaction Block: Captures short-term temporal dependencies using multiple convolutional filters. Integrates a redundant convolutional path to enhance feature robustness and learning flexibility.
- Convolutional Neural Networks (CNNs): Extracts hierarchical temporal patterns through sequential convolutional layers. Employs residual connections to maintain efficient gradient flow, improving training stability and model performance.
- Bidirectional Long Short-Term Memory (BiLSTM): Efficiently models long-term temporal relationships and dependencies in both forward and backward directions. Batch normalization and dropout are strategically applied to enhance generalization and reduce overfitting.
- Lightweight Multi-Headed Attention Transformer: Dynamically prioritizes significant temporal segments within the data. Employs multiple attention heads to effectively capture diverse temporal relationships. Integrates feed-forward neural networks (FFN) to further enhance temporal feature representations.
Challenges we ran into
The loss function I used initially was Mean Squared Error, which is insensitive to outliers and as a results does poorly at capturing variance, so I switched to Mean Absolute Error, which is sensitive to outliers. Both of them were bad at capturing the true variance in the data, MAE overshot and MSE undershot. I ended up using Huber Loss which combines the characteristics of both and lies somewhere in the middle of both.
After the sign accuracy increased to 58%, I decided to implement a sliding window interaction block that captures interactions between different patterns and residual layers followed by this to identify short-term temporal patterns. But adding this was very complex and I struggled for hours to get the code to work as I intended.
Along with these challenges, the project consisted of a lot of minor challenges and alignment issues.
Accomplishments that we're proud of
A trading model can easily overfit when it's too complex or underfit if it's not capable of capturing the relevant patterns. Despite training on just one year of data, which is admittedly less than ideal, I managed to develop a relatively complex model that delivered excellent results without succumbing to overfitting or under-fitting. After hours of refining the architecture, achieving the right balance was incredibly rewarding.
This project is my most elaborate hackathon effort yet, and I'm proud of its performance. While a sign accuracy of 60% might make a trading model usable, reaching 72% not only enhances usability but makes it truly desirable. Additionally, maintaining a 5:3 ratio between true variance and predicted variance, along with such high sign accuracy, is extremely impressive and highlights the model's robustness and precision.
What we learned
This project taught me a great deal about data standardization techniques and various ML model architectures capable of capturing complex patterns. I experimented with different loss functions and regularization methods to balance model complexity with performance, ensuring that my model could generalize well from a limited dataset.
I also learned how crucial it is to harmonize the learning rate and schedule for efficient convergence. In addition to tuning these hyperparameters, I explored advanced feature selection and evaluation strategies, which helped me manage overfitting and underfitting effectively. Overall, this experience deepened my understanding of building robust models for real-world applications.
What's next for IQtrader
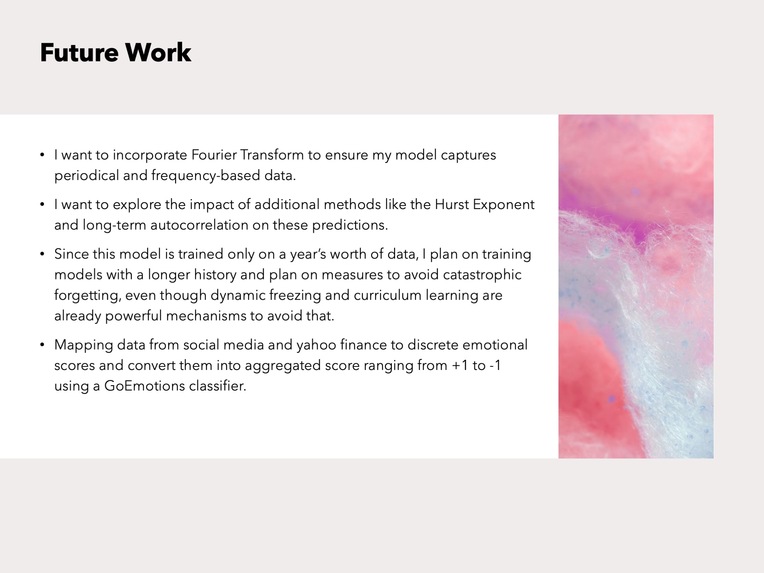
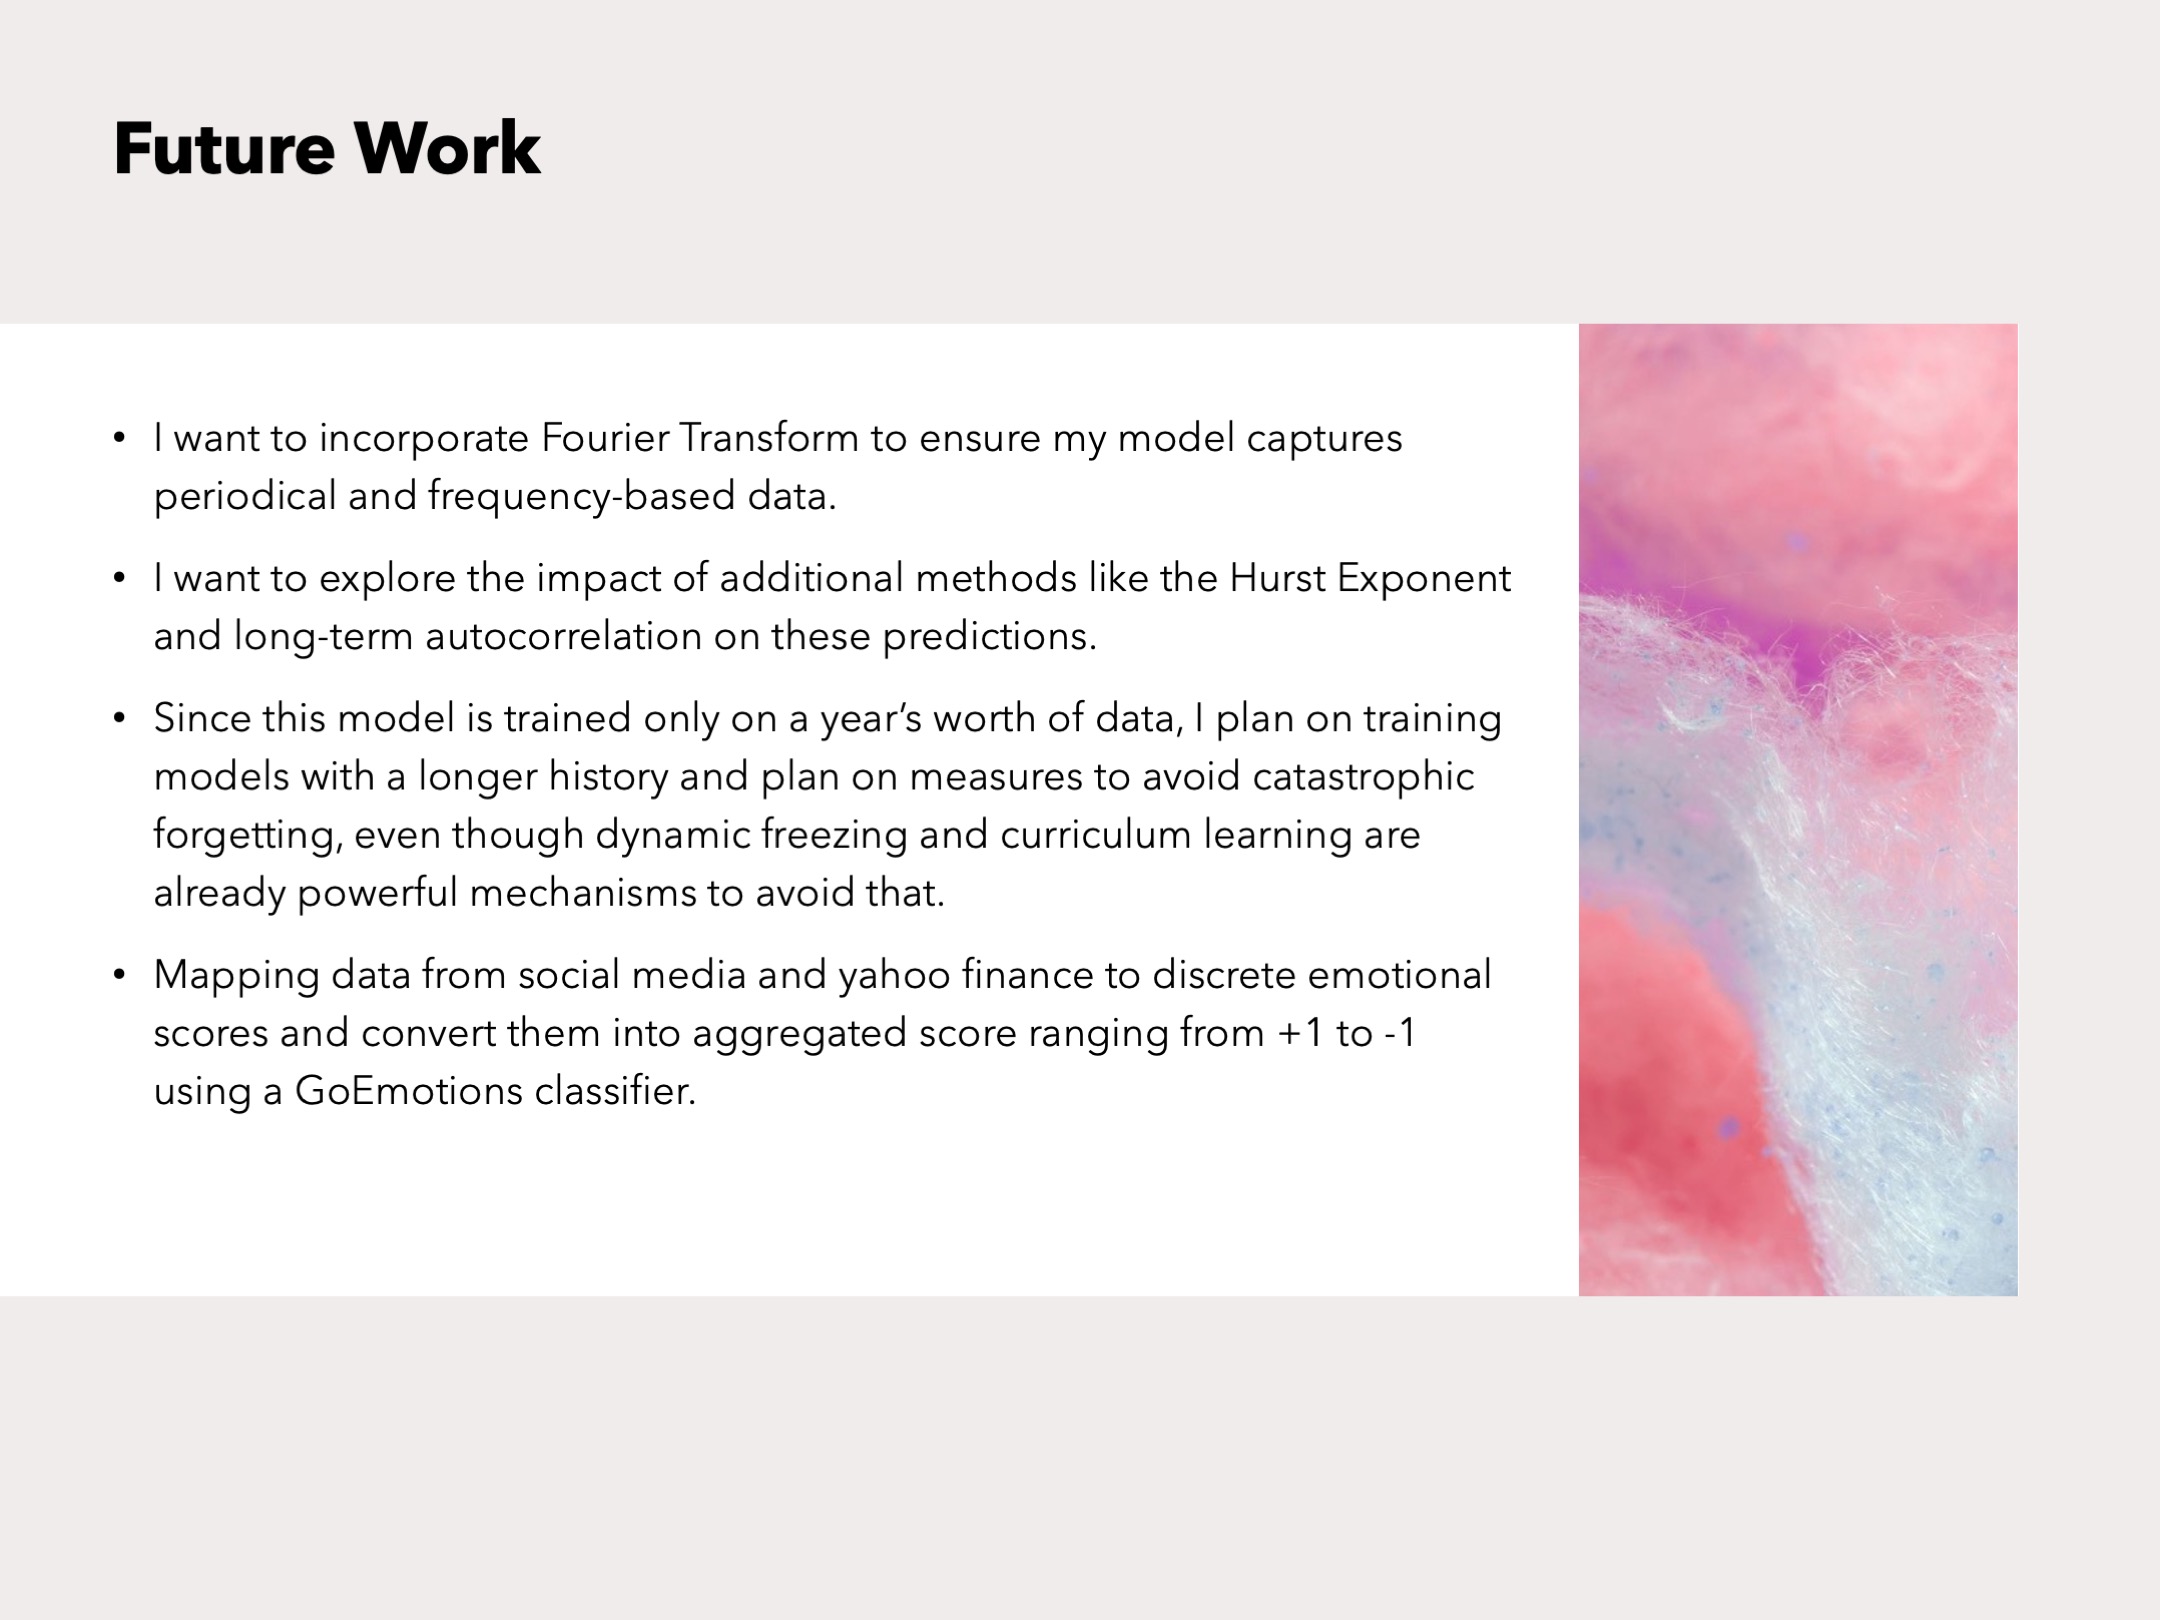
I want to incorporate Fourier Transform to ensure my model captures periodical and frequency-based data. I also want to explore the impact of additional methods like the Hurst Exponent and long-term autocorrelation on these predictions. Since this model is trained only on a year’s worth of data, I plan on training models with a longer history and plan on measures to avoid catastrophic forgetting, even though dynamic freezing and curriculum learning are already powerful mechanisms to avoid that. Mapping data from social media and yahoo finance to discrete emotional scores and convert them into aggregated score ranging from +1 to -1 using a GoEmotions classifier and including that as an indicator of public sentiment.
Built With
- matplotlib
- numpy
- pandas
- python
- scikit-learn
- tensorflow

Log in or sign up for Devpost to join the conversation.