Inspiration
The IPL 2022 Data Analysis and Visualization project was inspired by the large amount of match data generated during the Indian Premier League. Cricket matches contain valuable information about teams, players, toss decisions, scores, venues, and match results. The goal of this project was to use data analytics to discover interesting patterns and convert raw cricket data into meaningful insights.
What it does
This project analyzes IPL 2022 match data using Python to find meaningful insights about teams, players, toss decisions, scores, venues, and match outcomes. It processes the raw CSV dataset using Pandas and NumPy and presents the results through visualizations created with Matplotlib and Seaborn.
How we built it
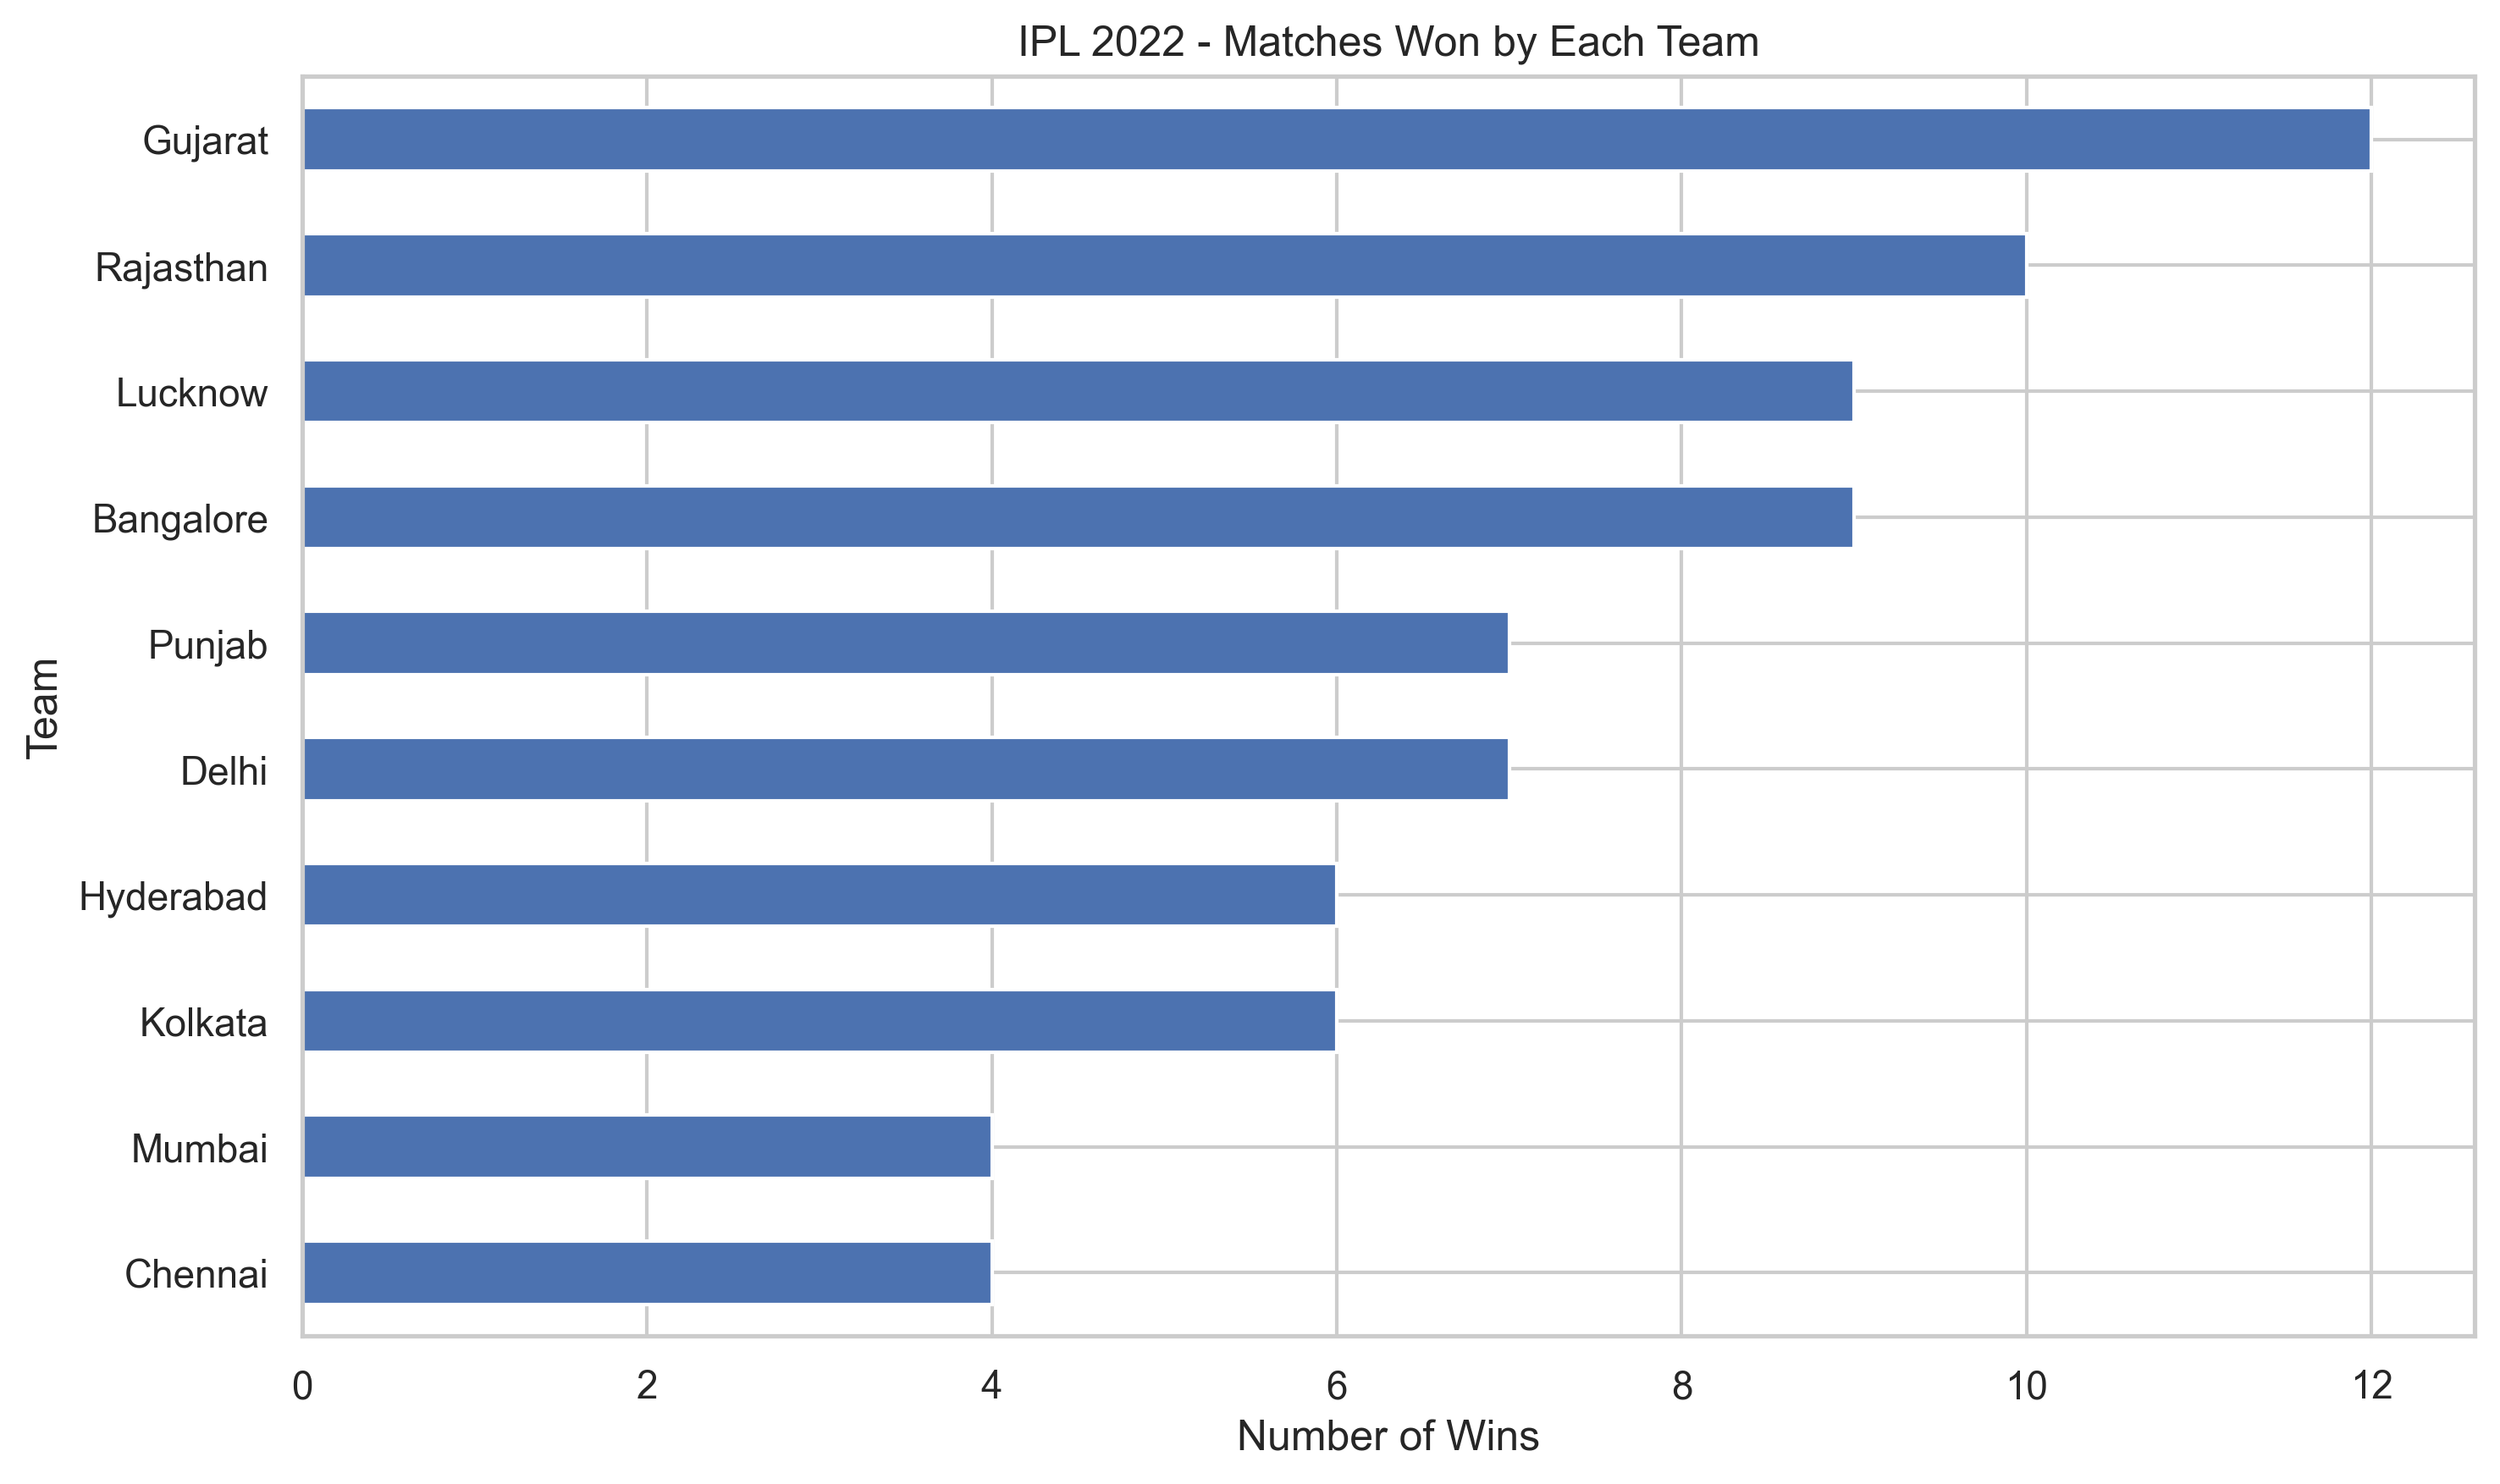
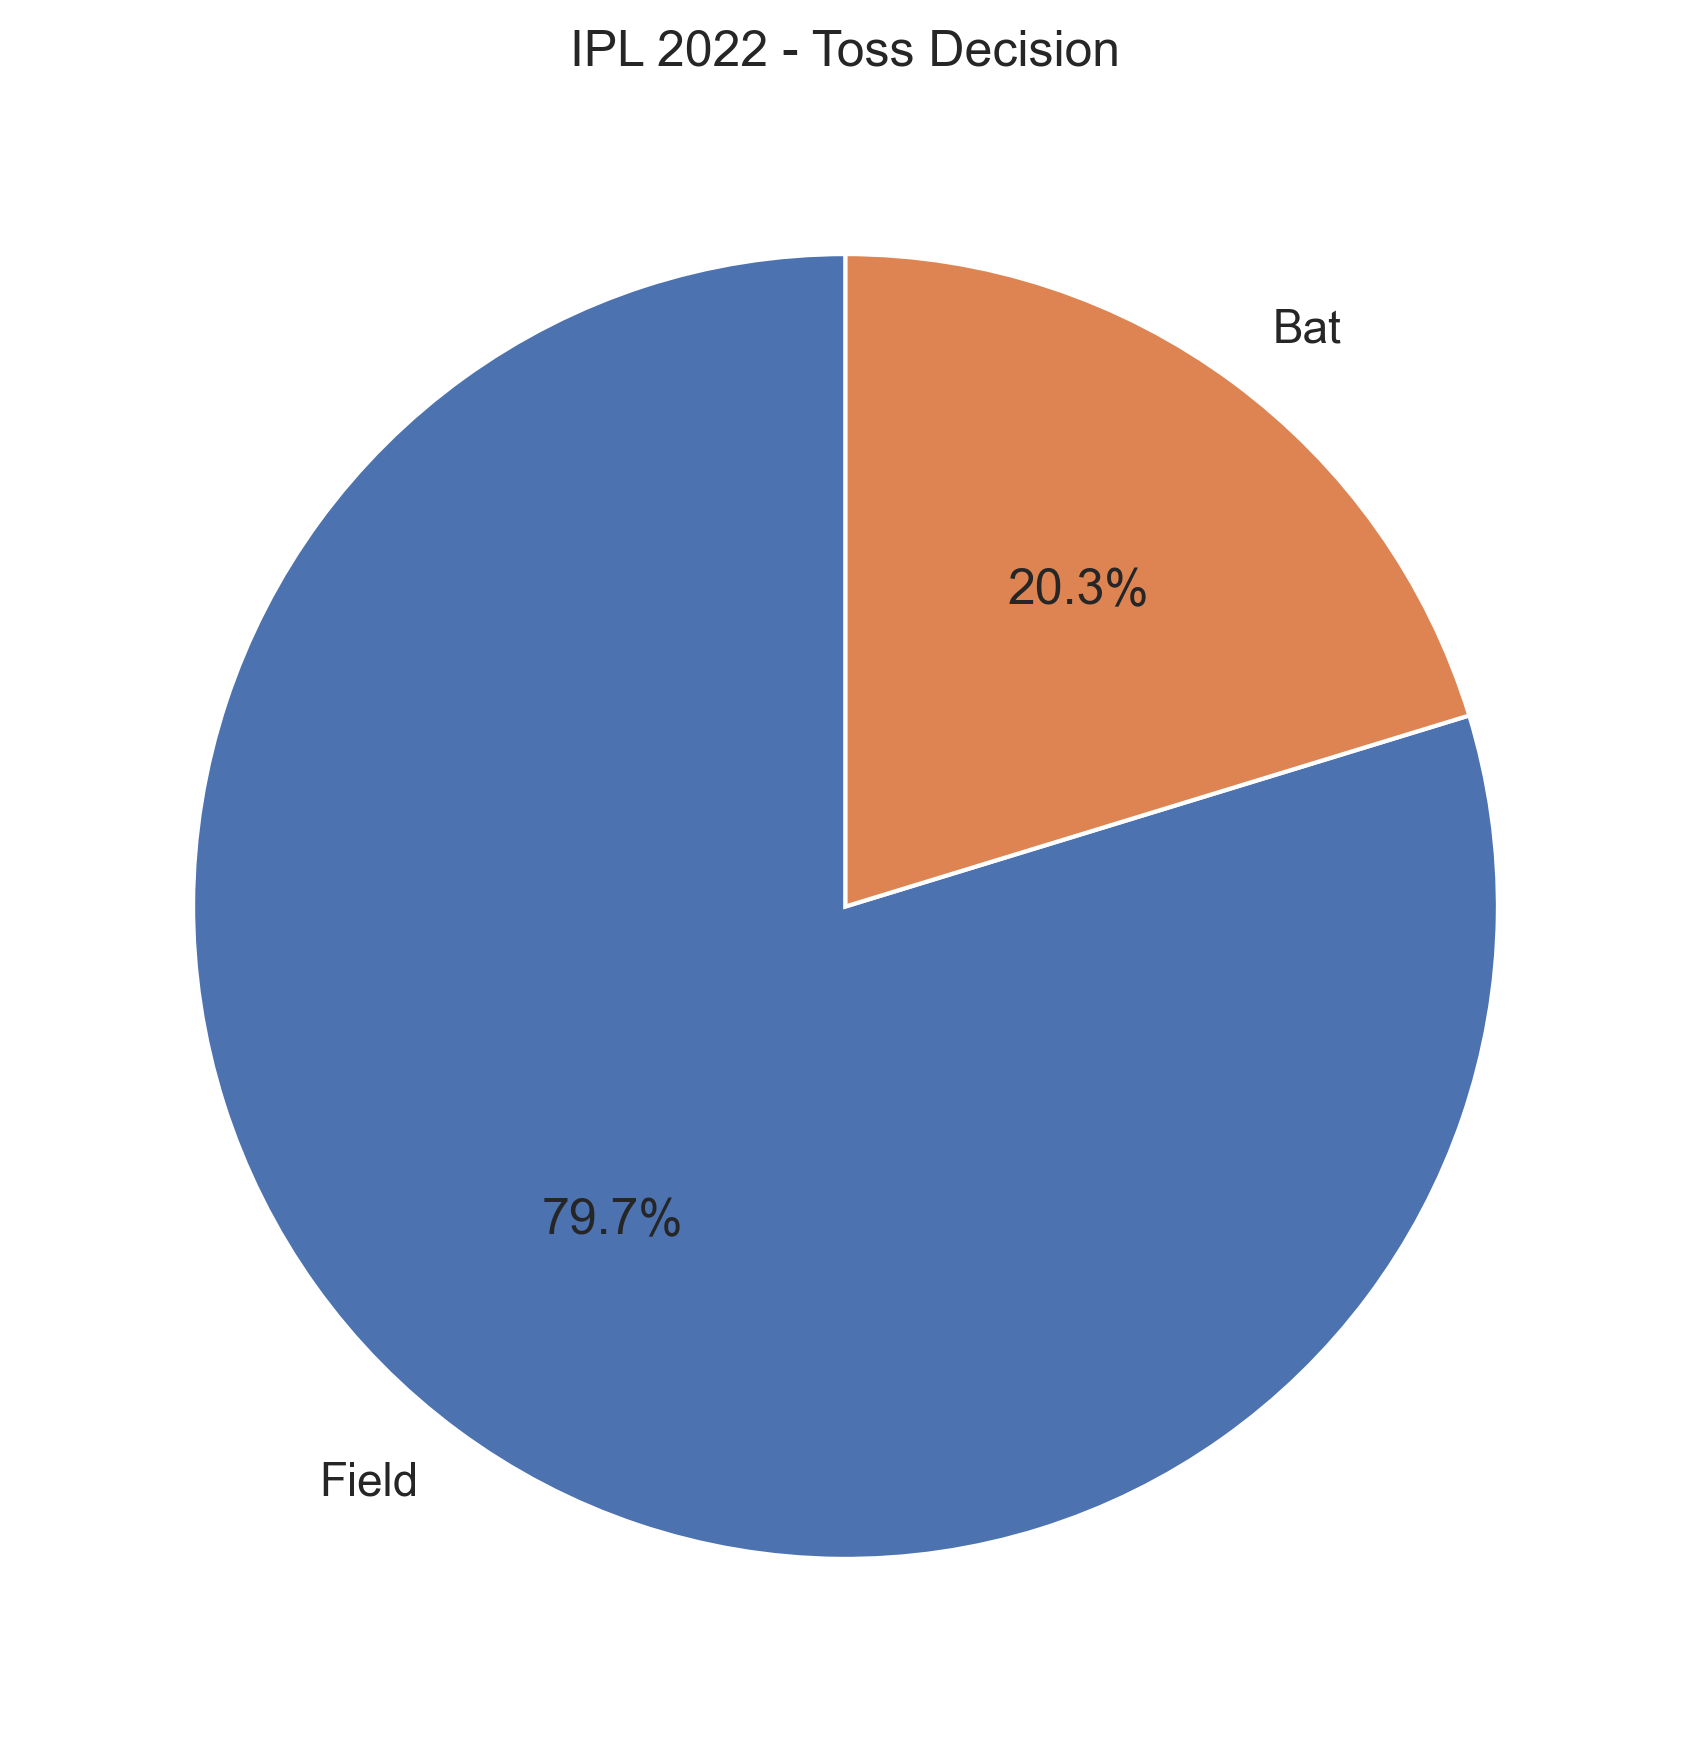
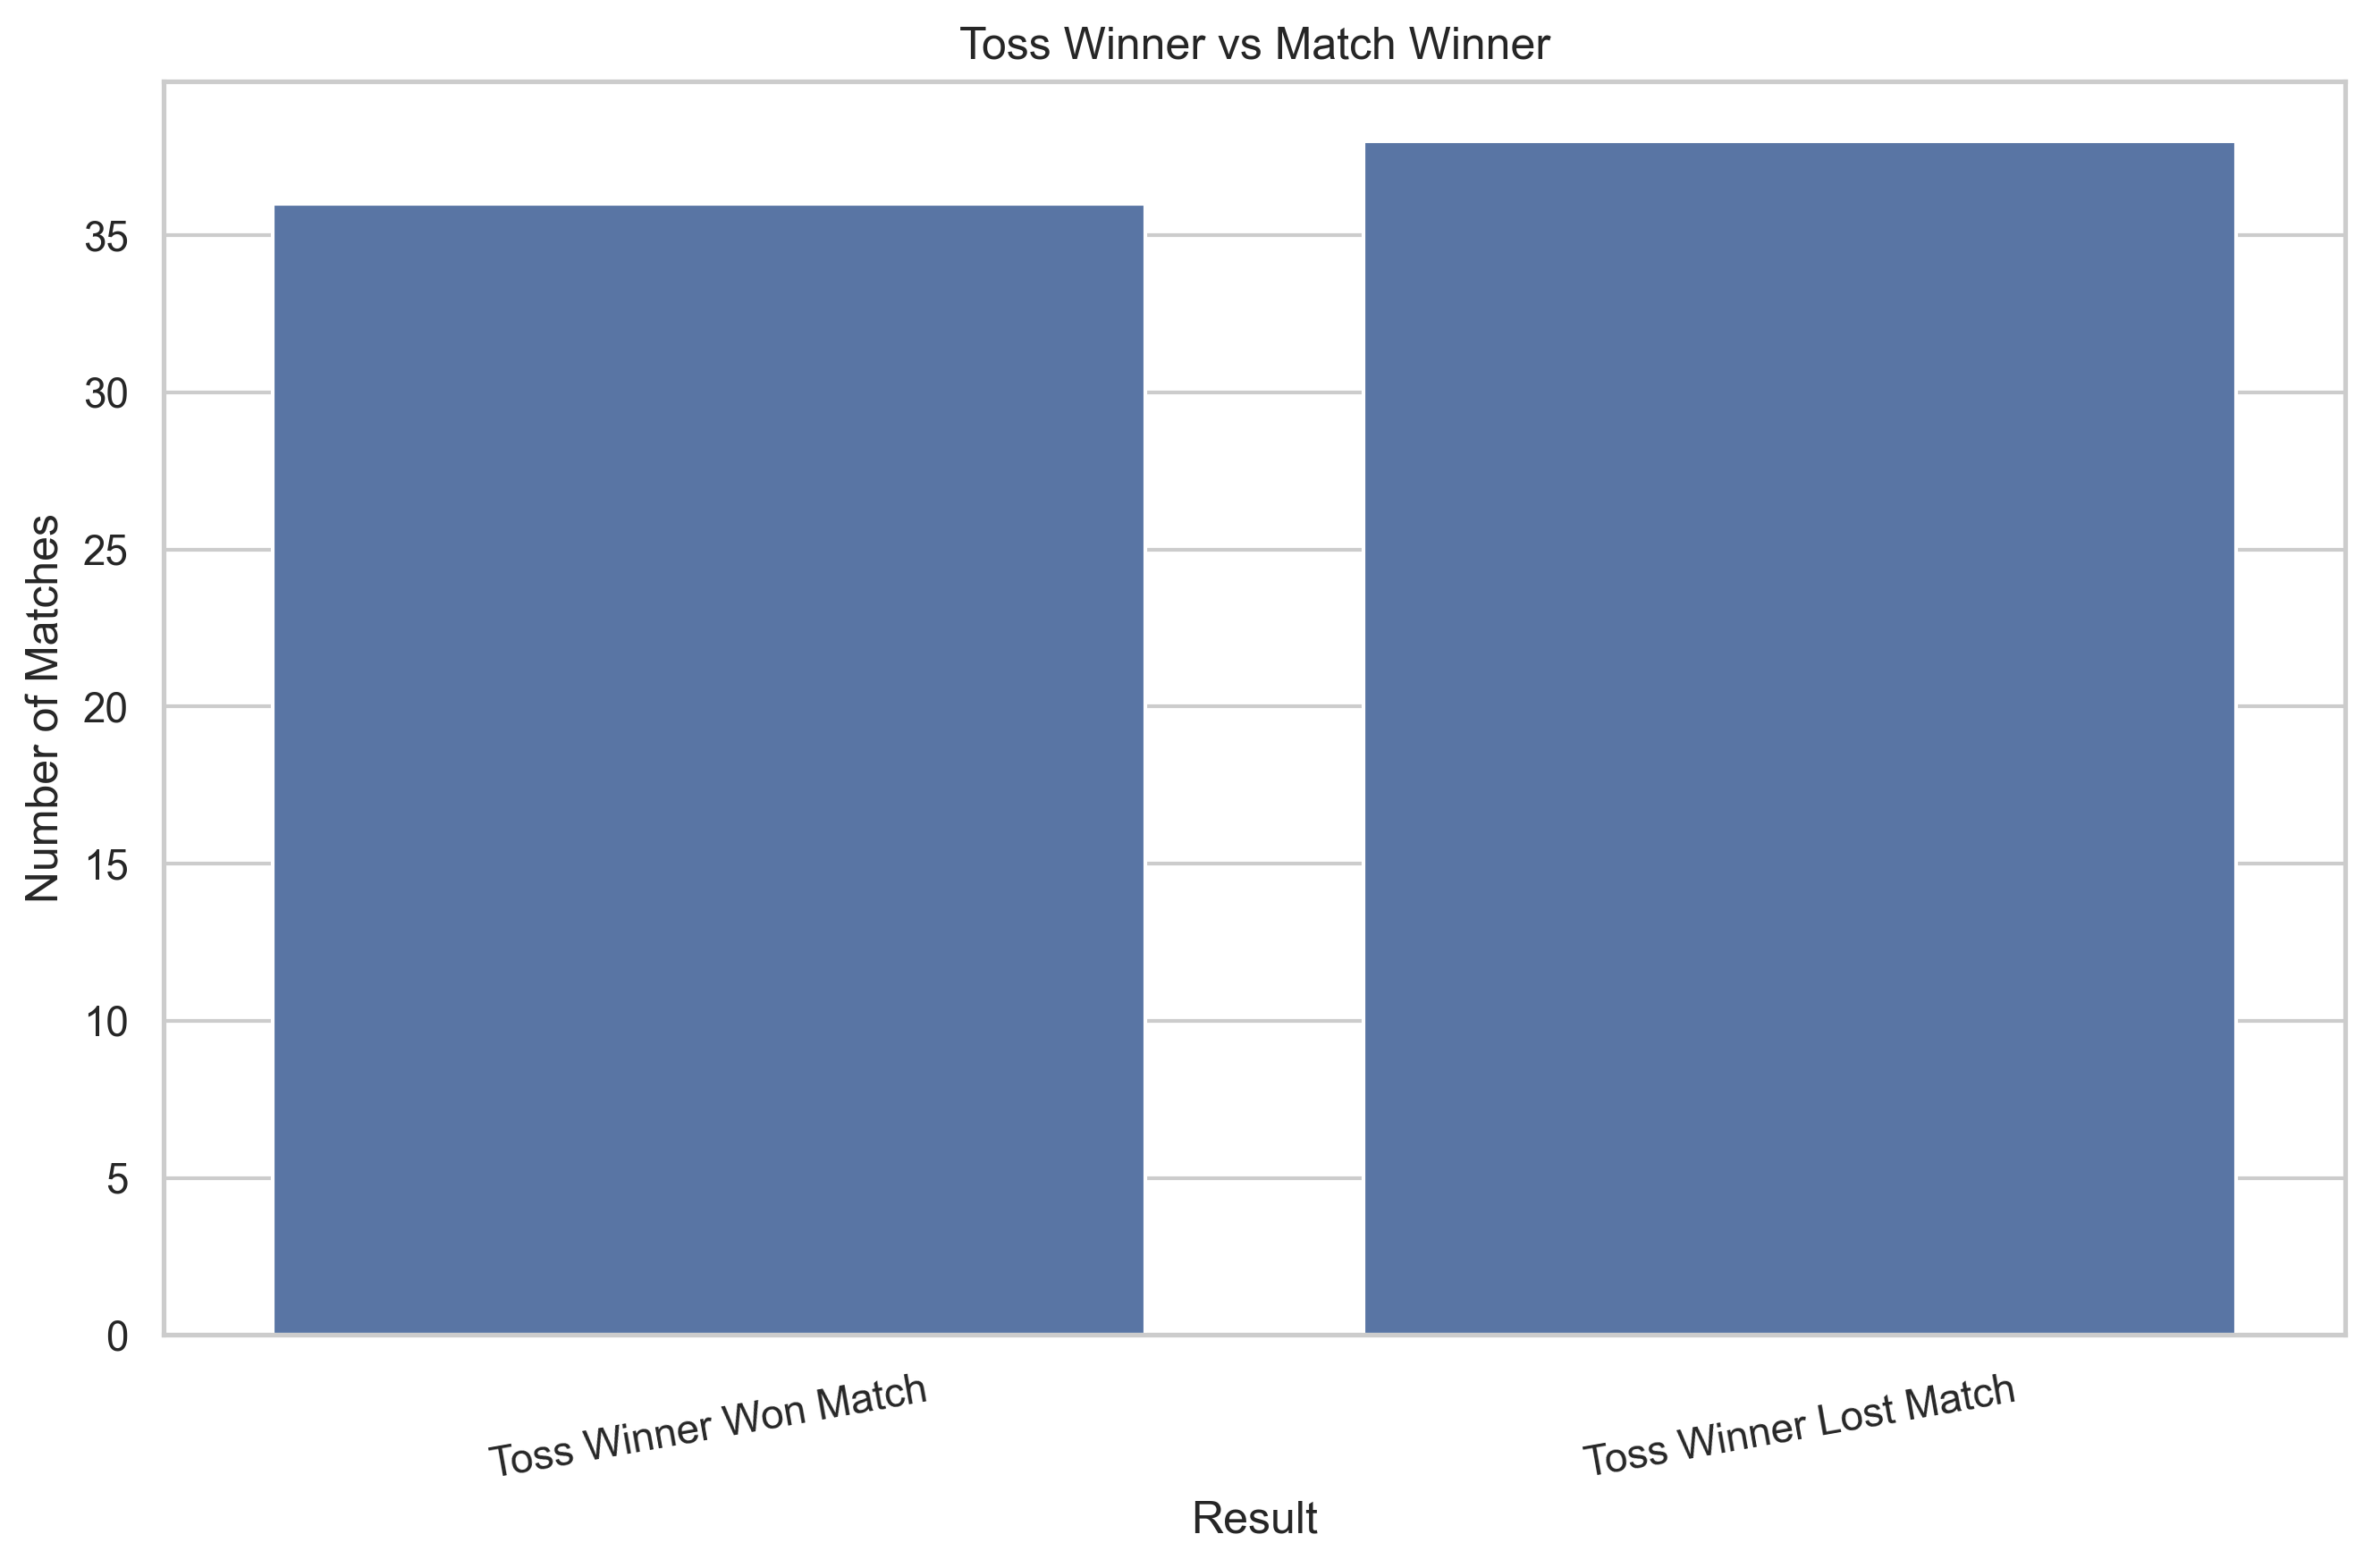
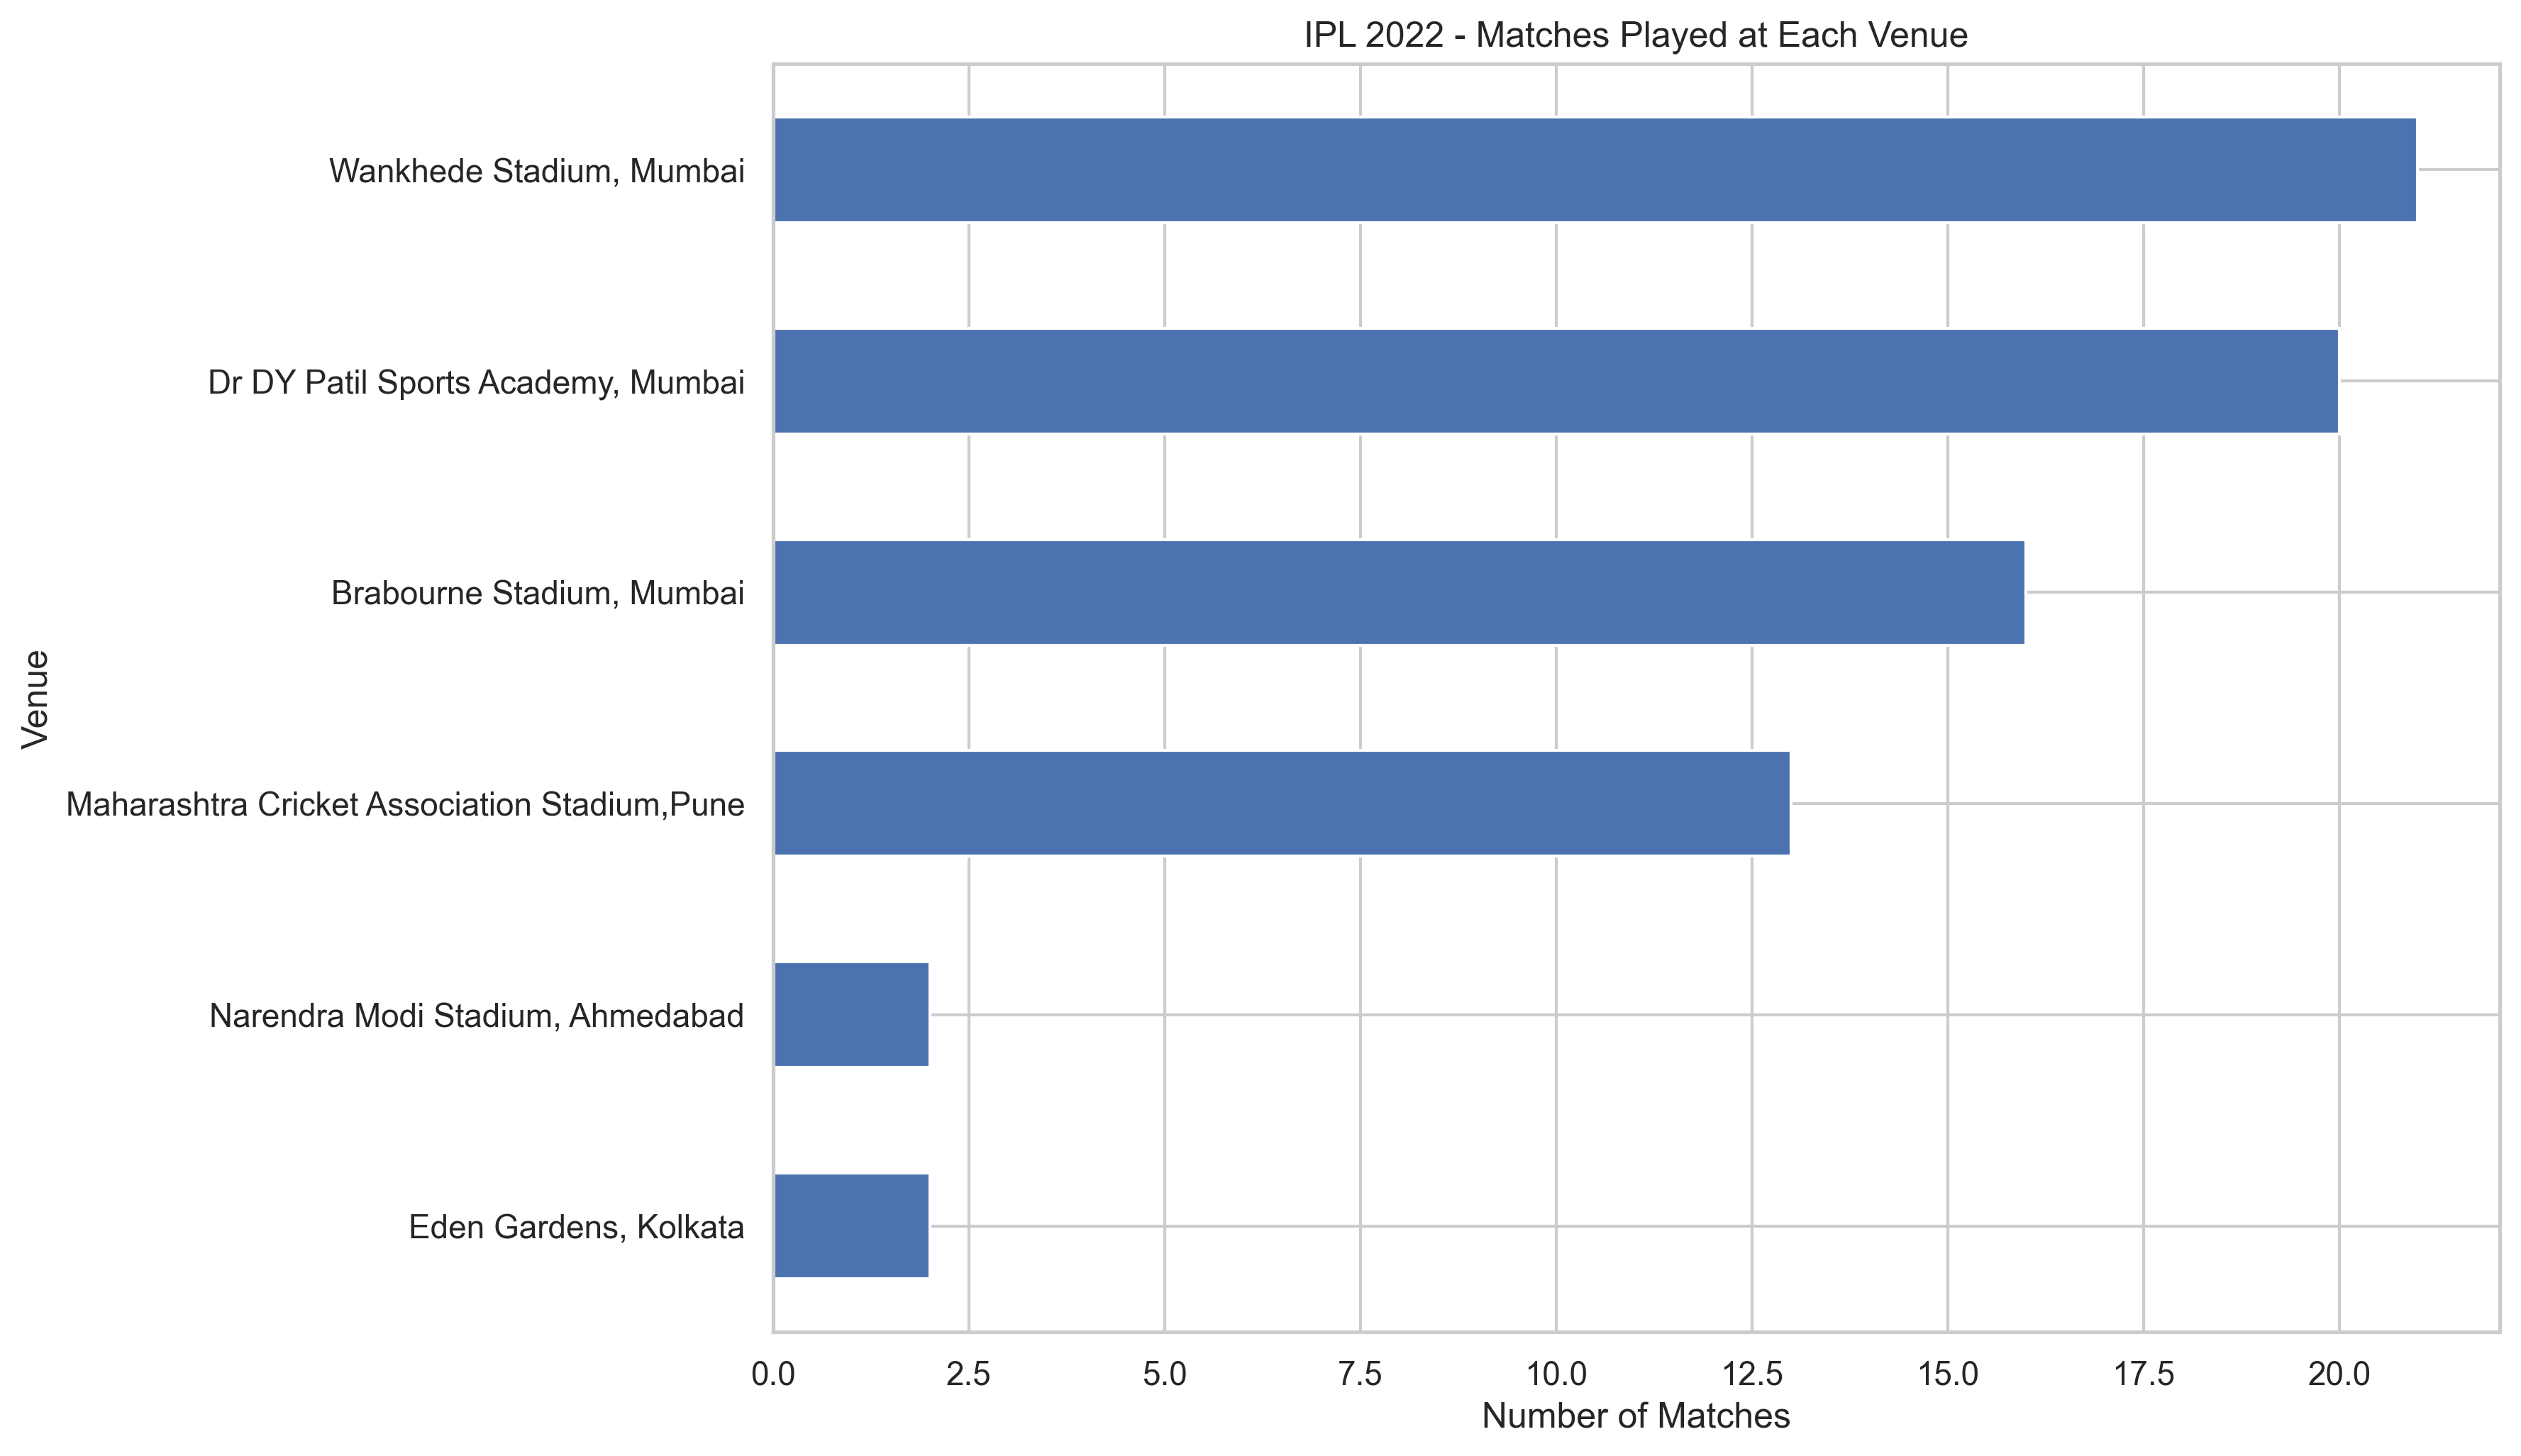
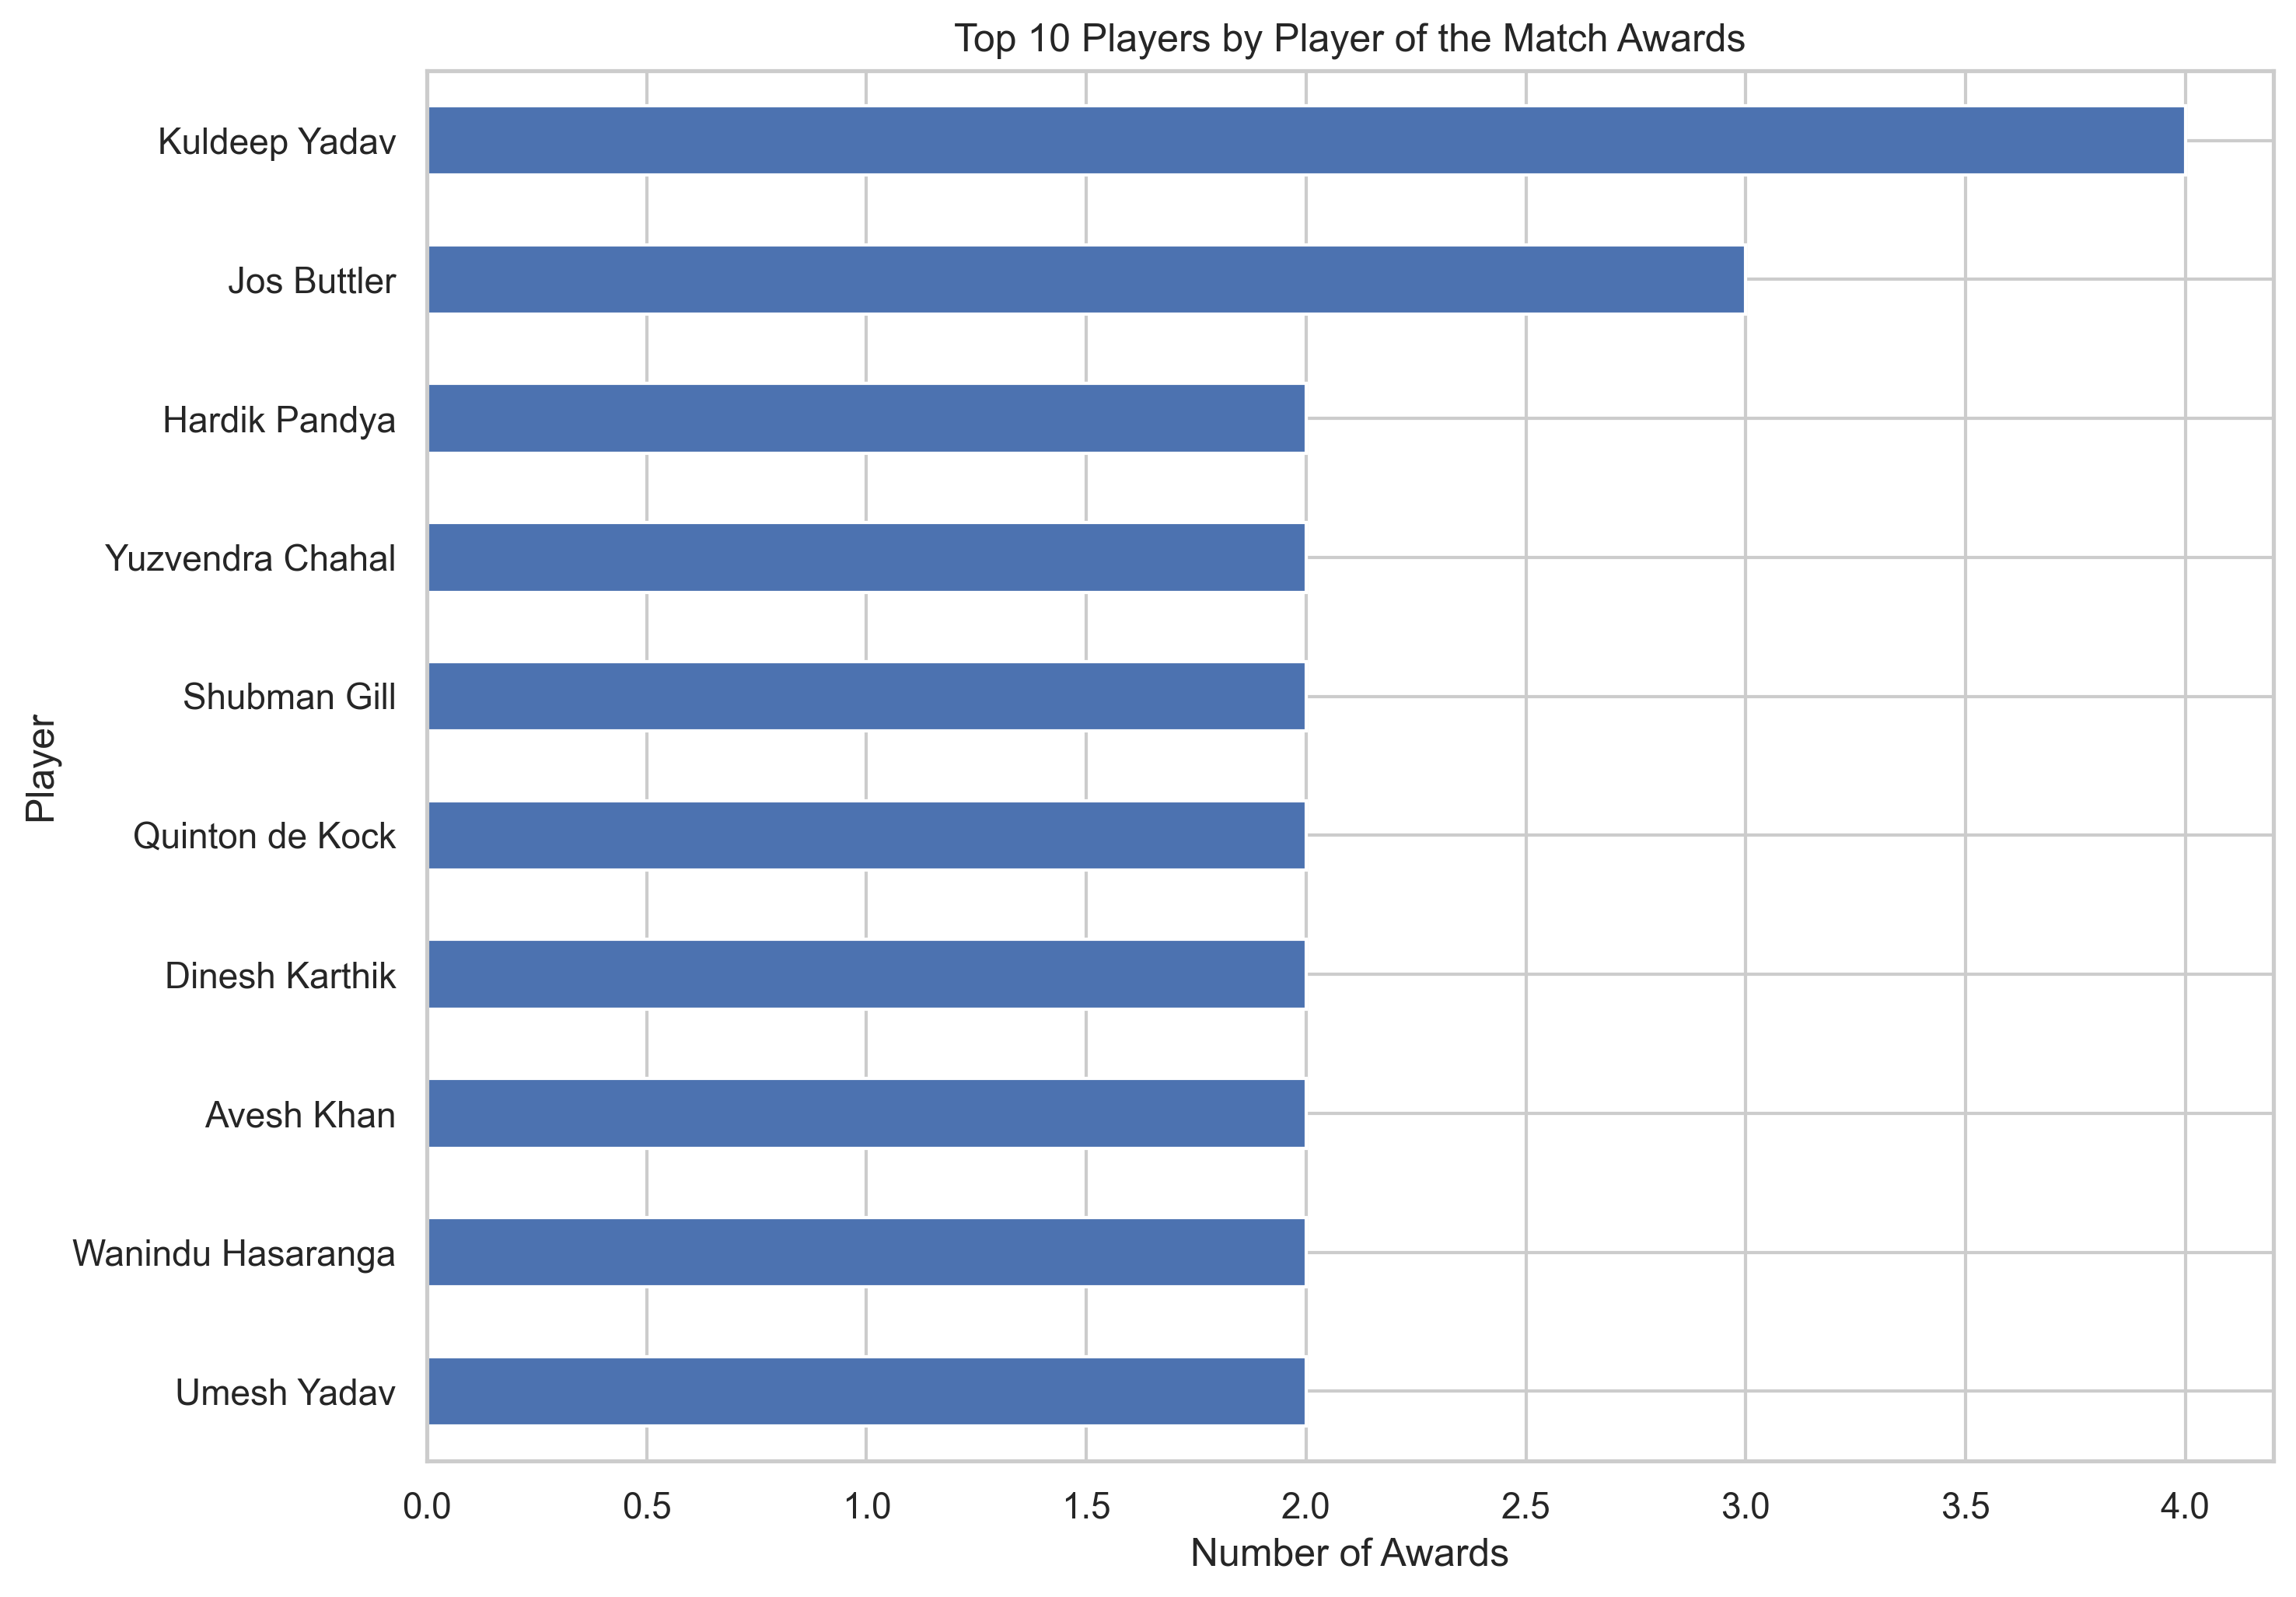
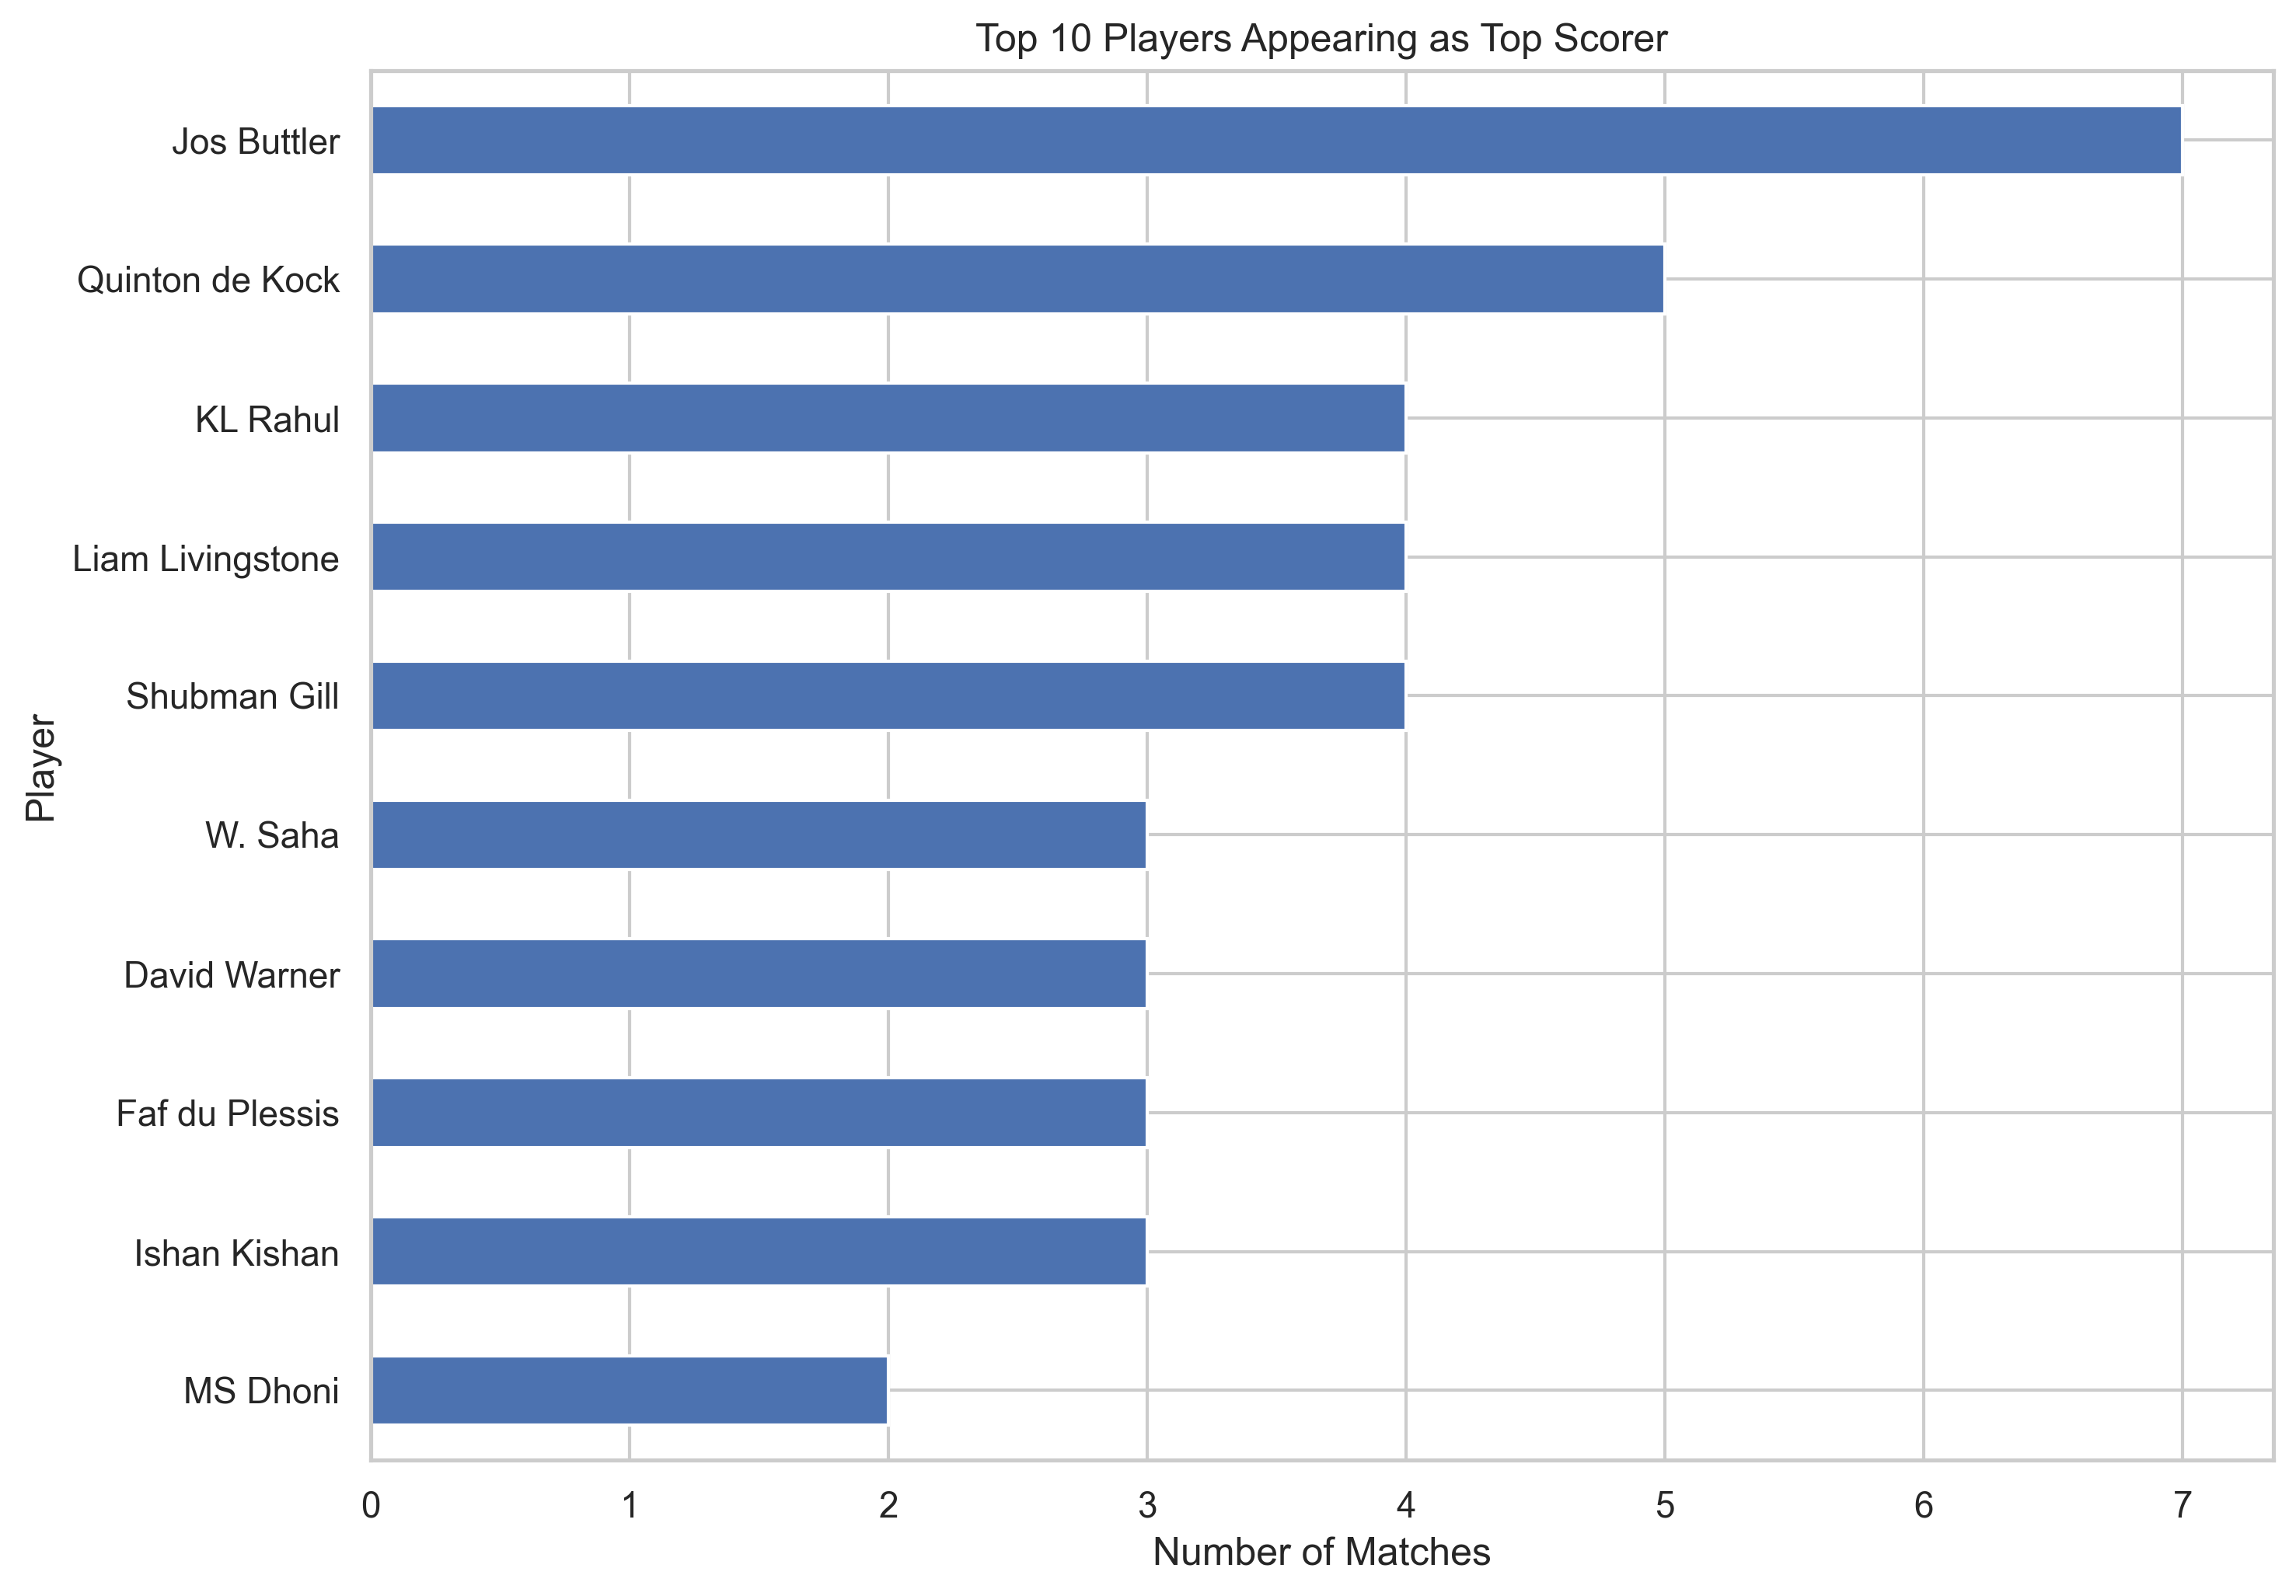
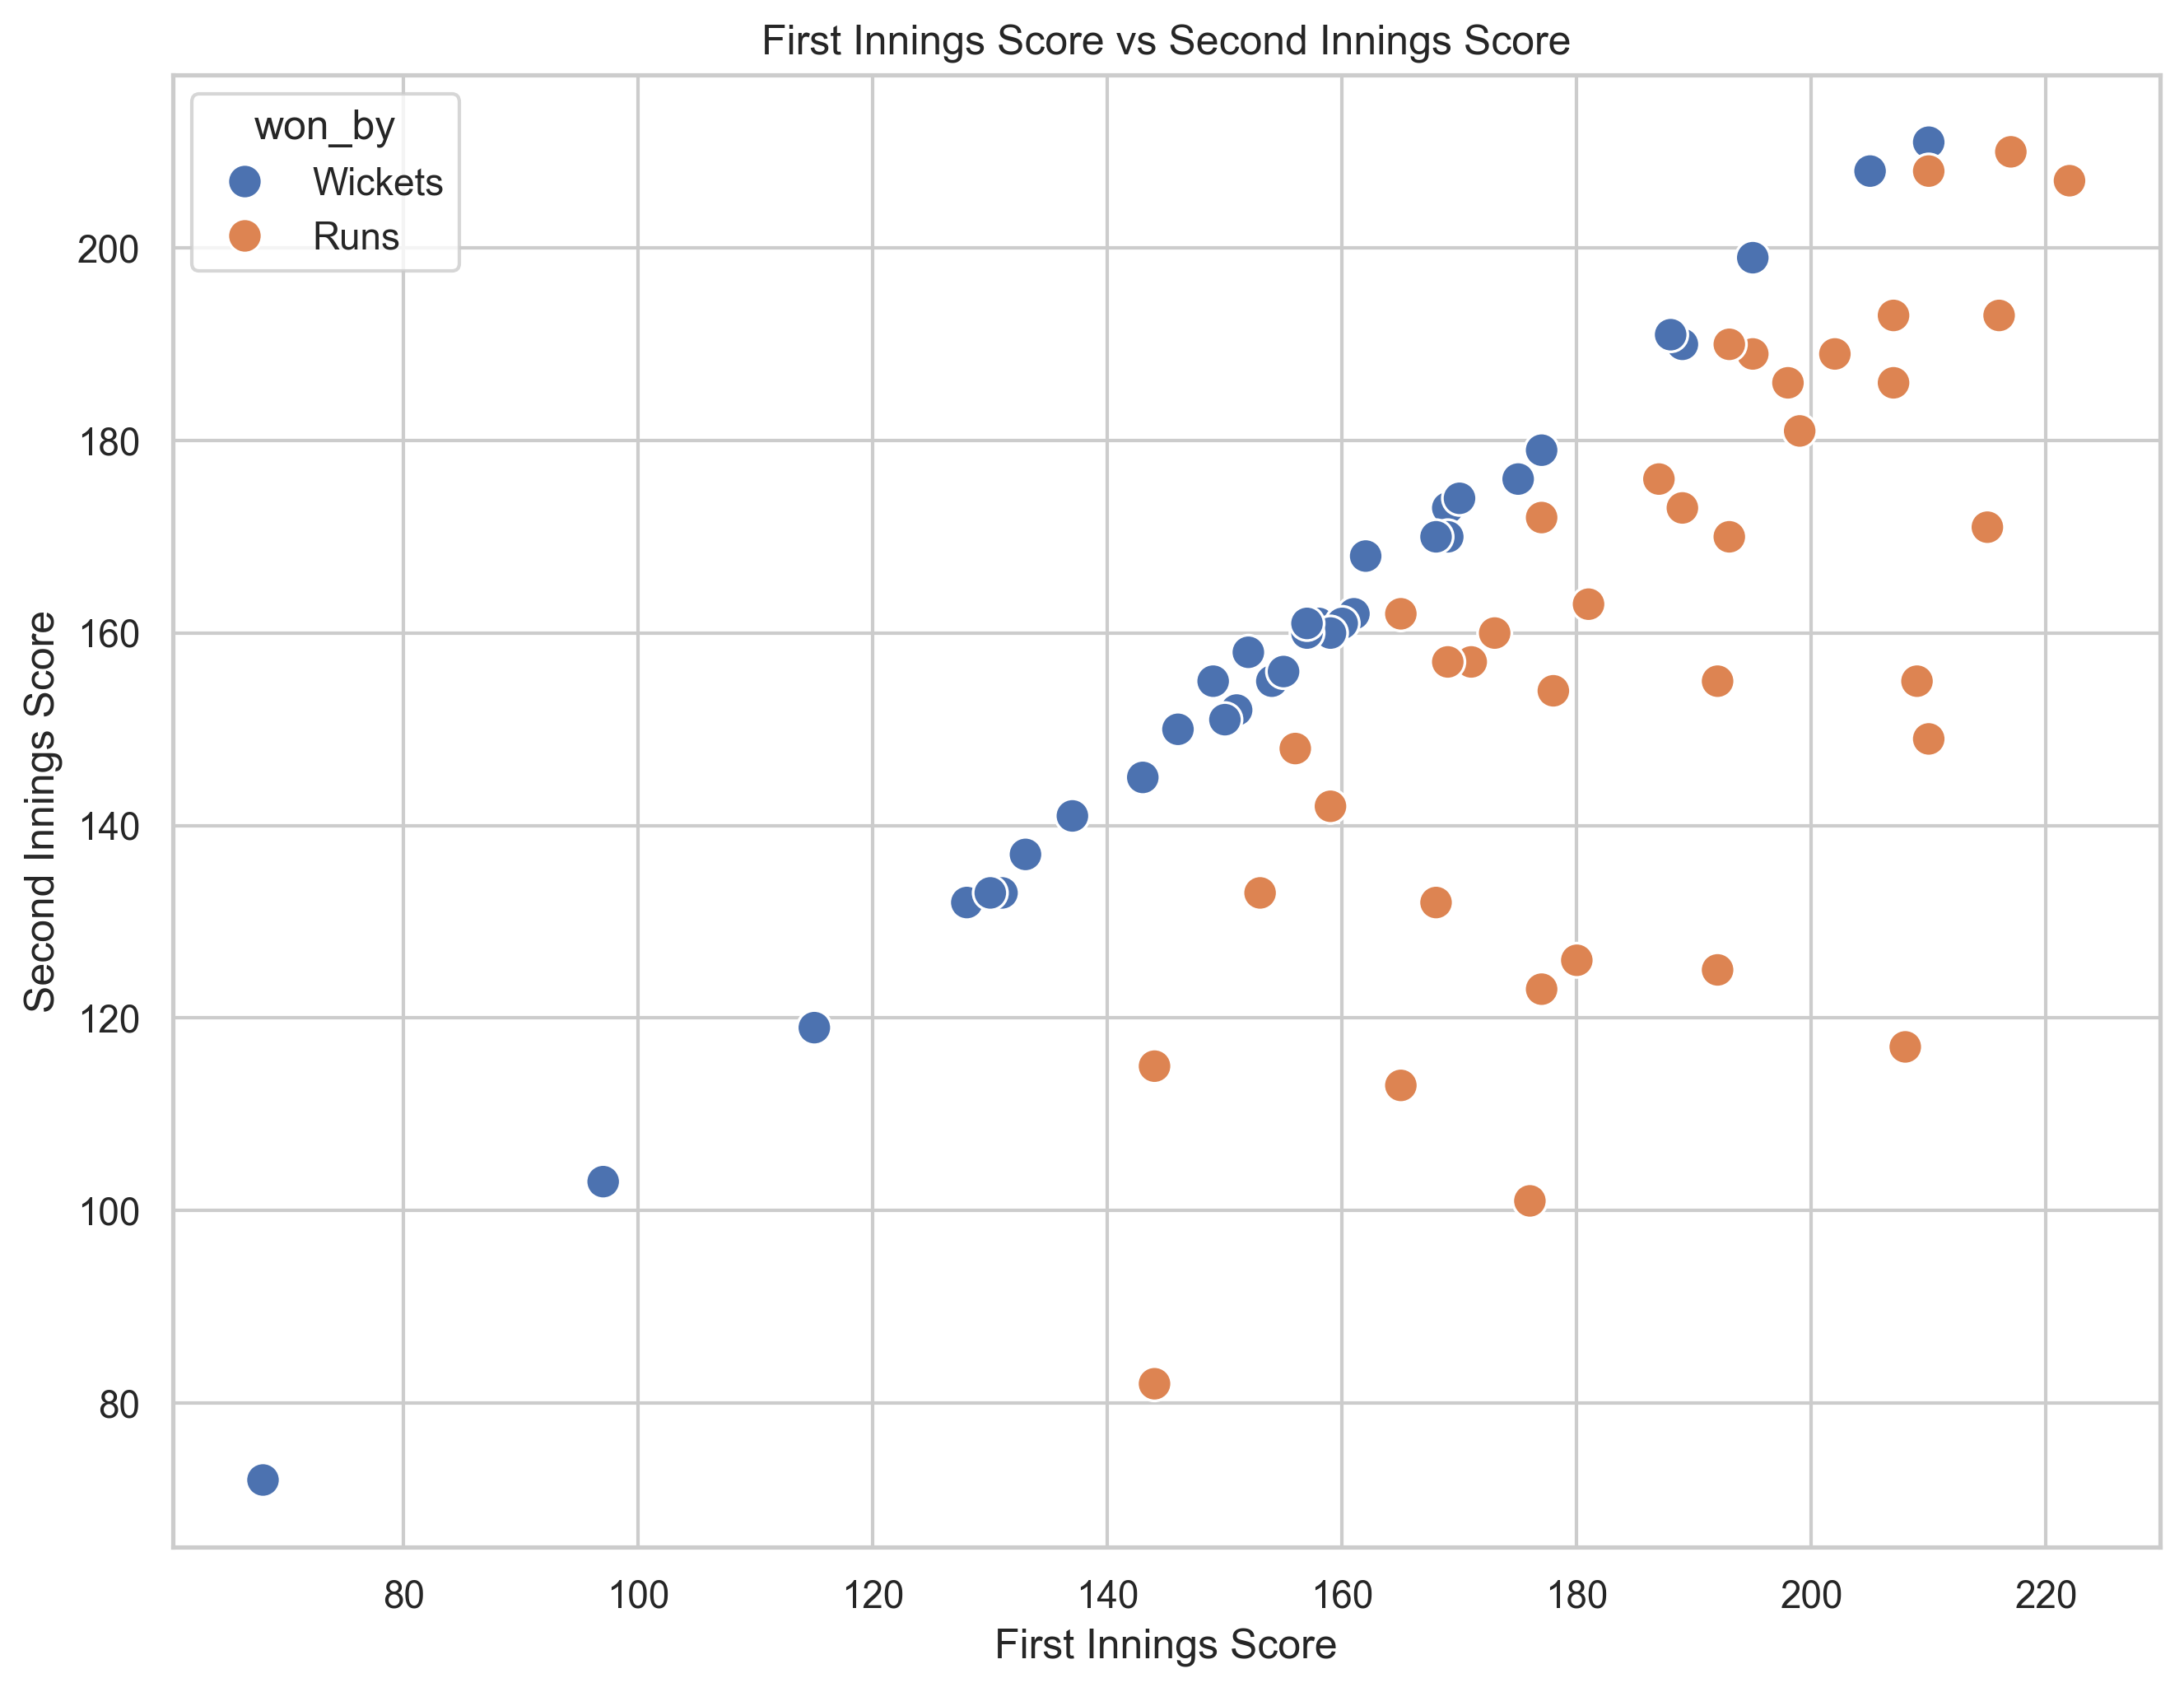
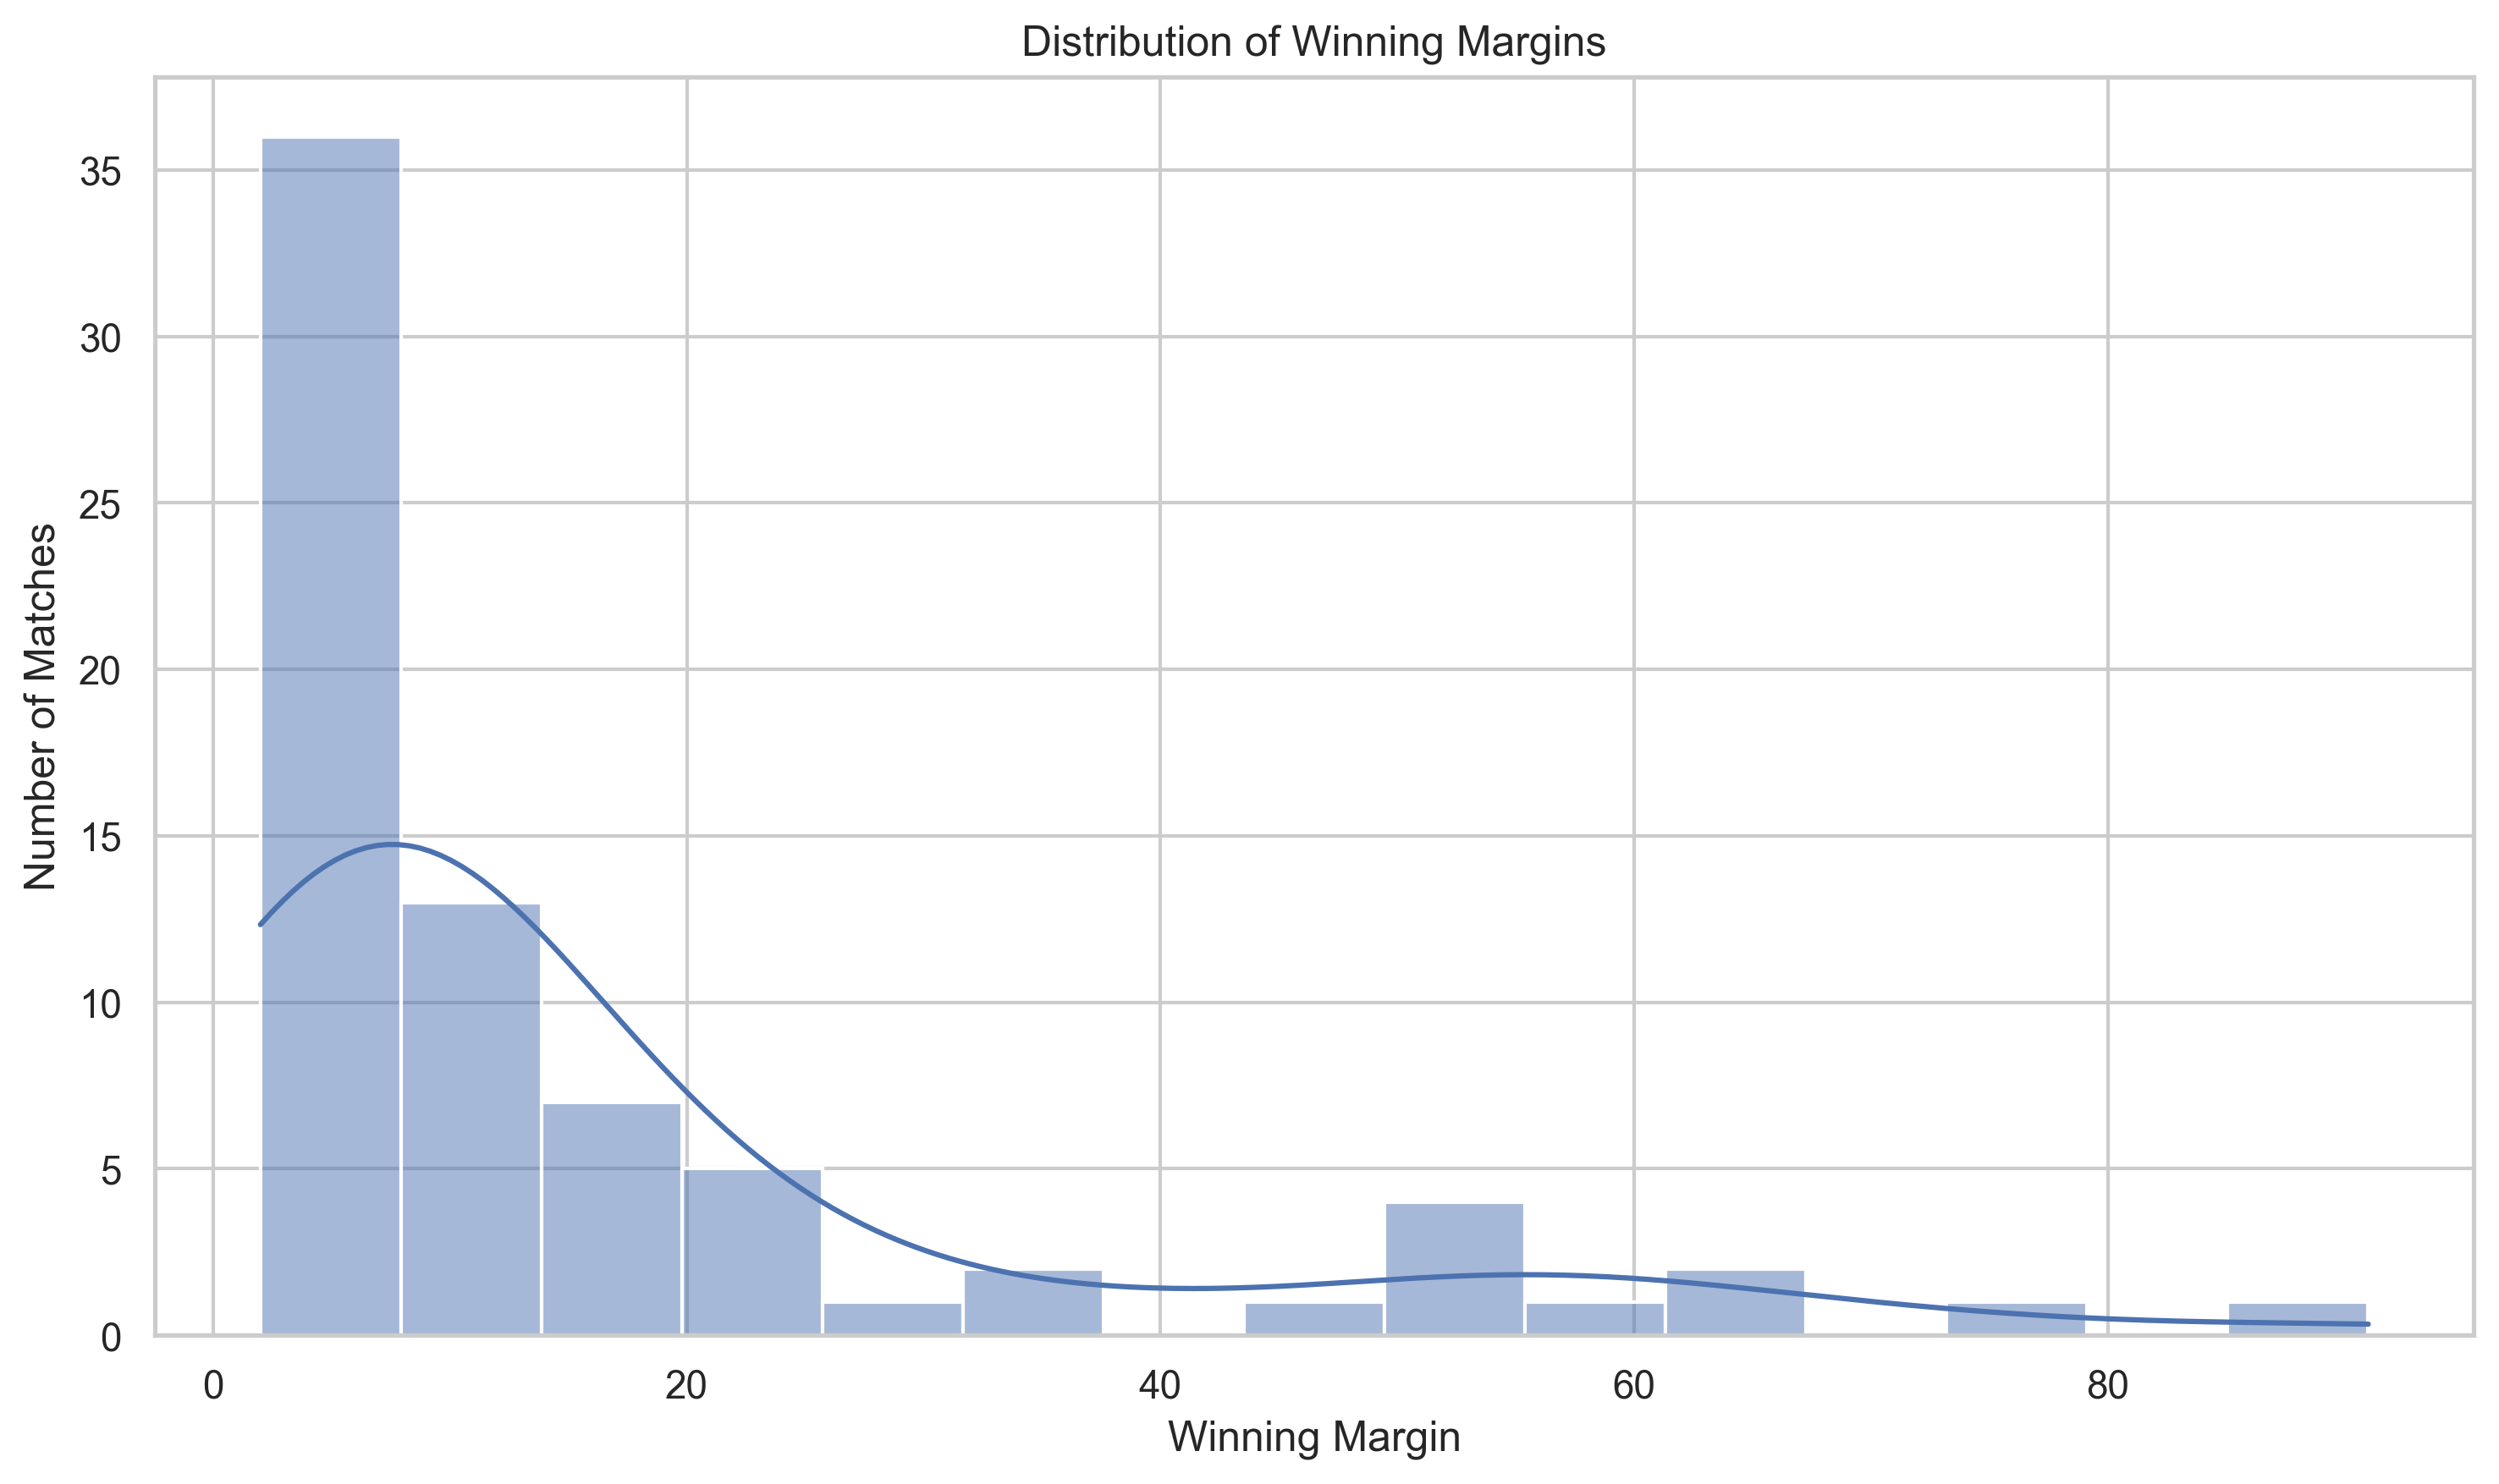
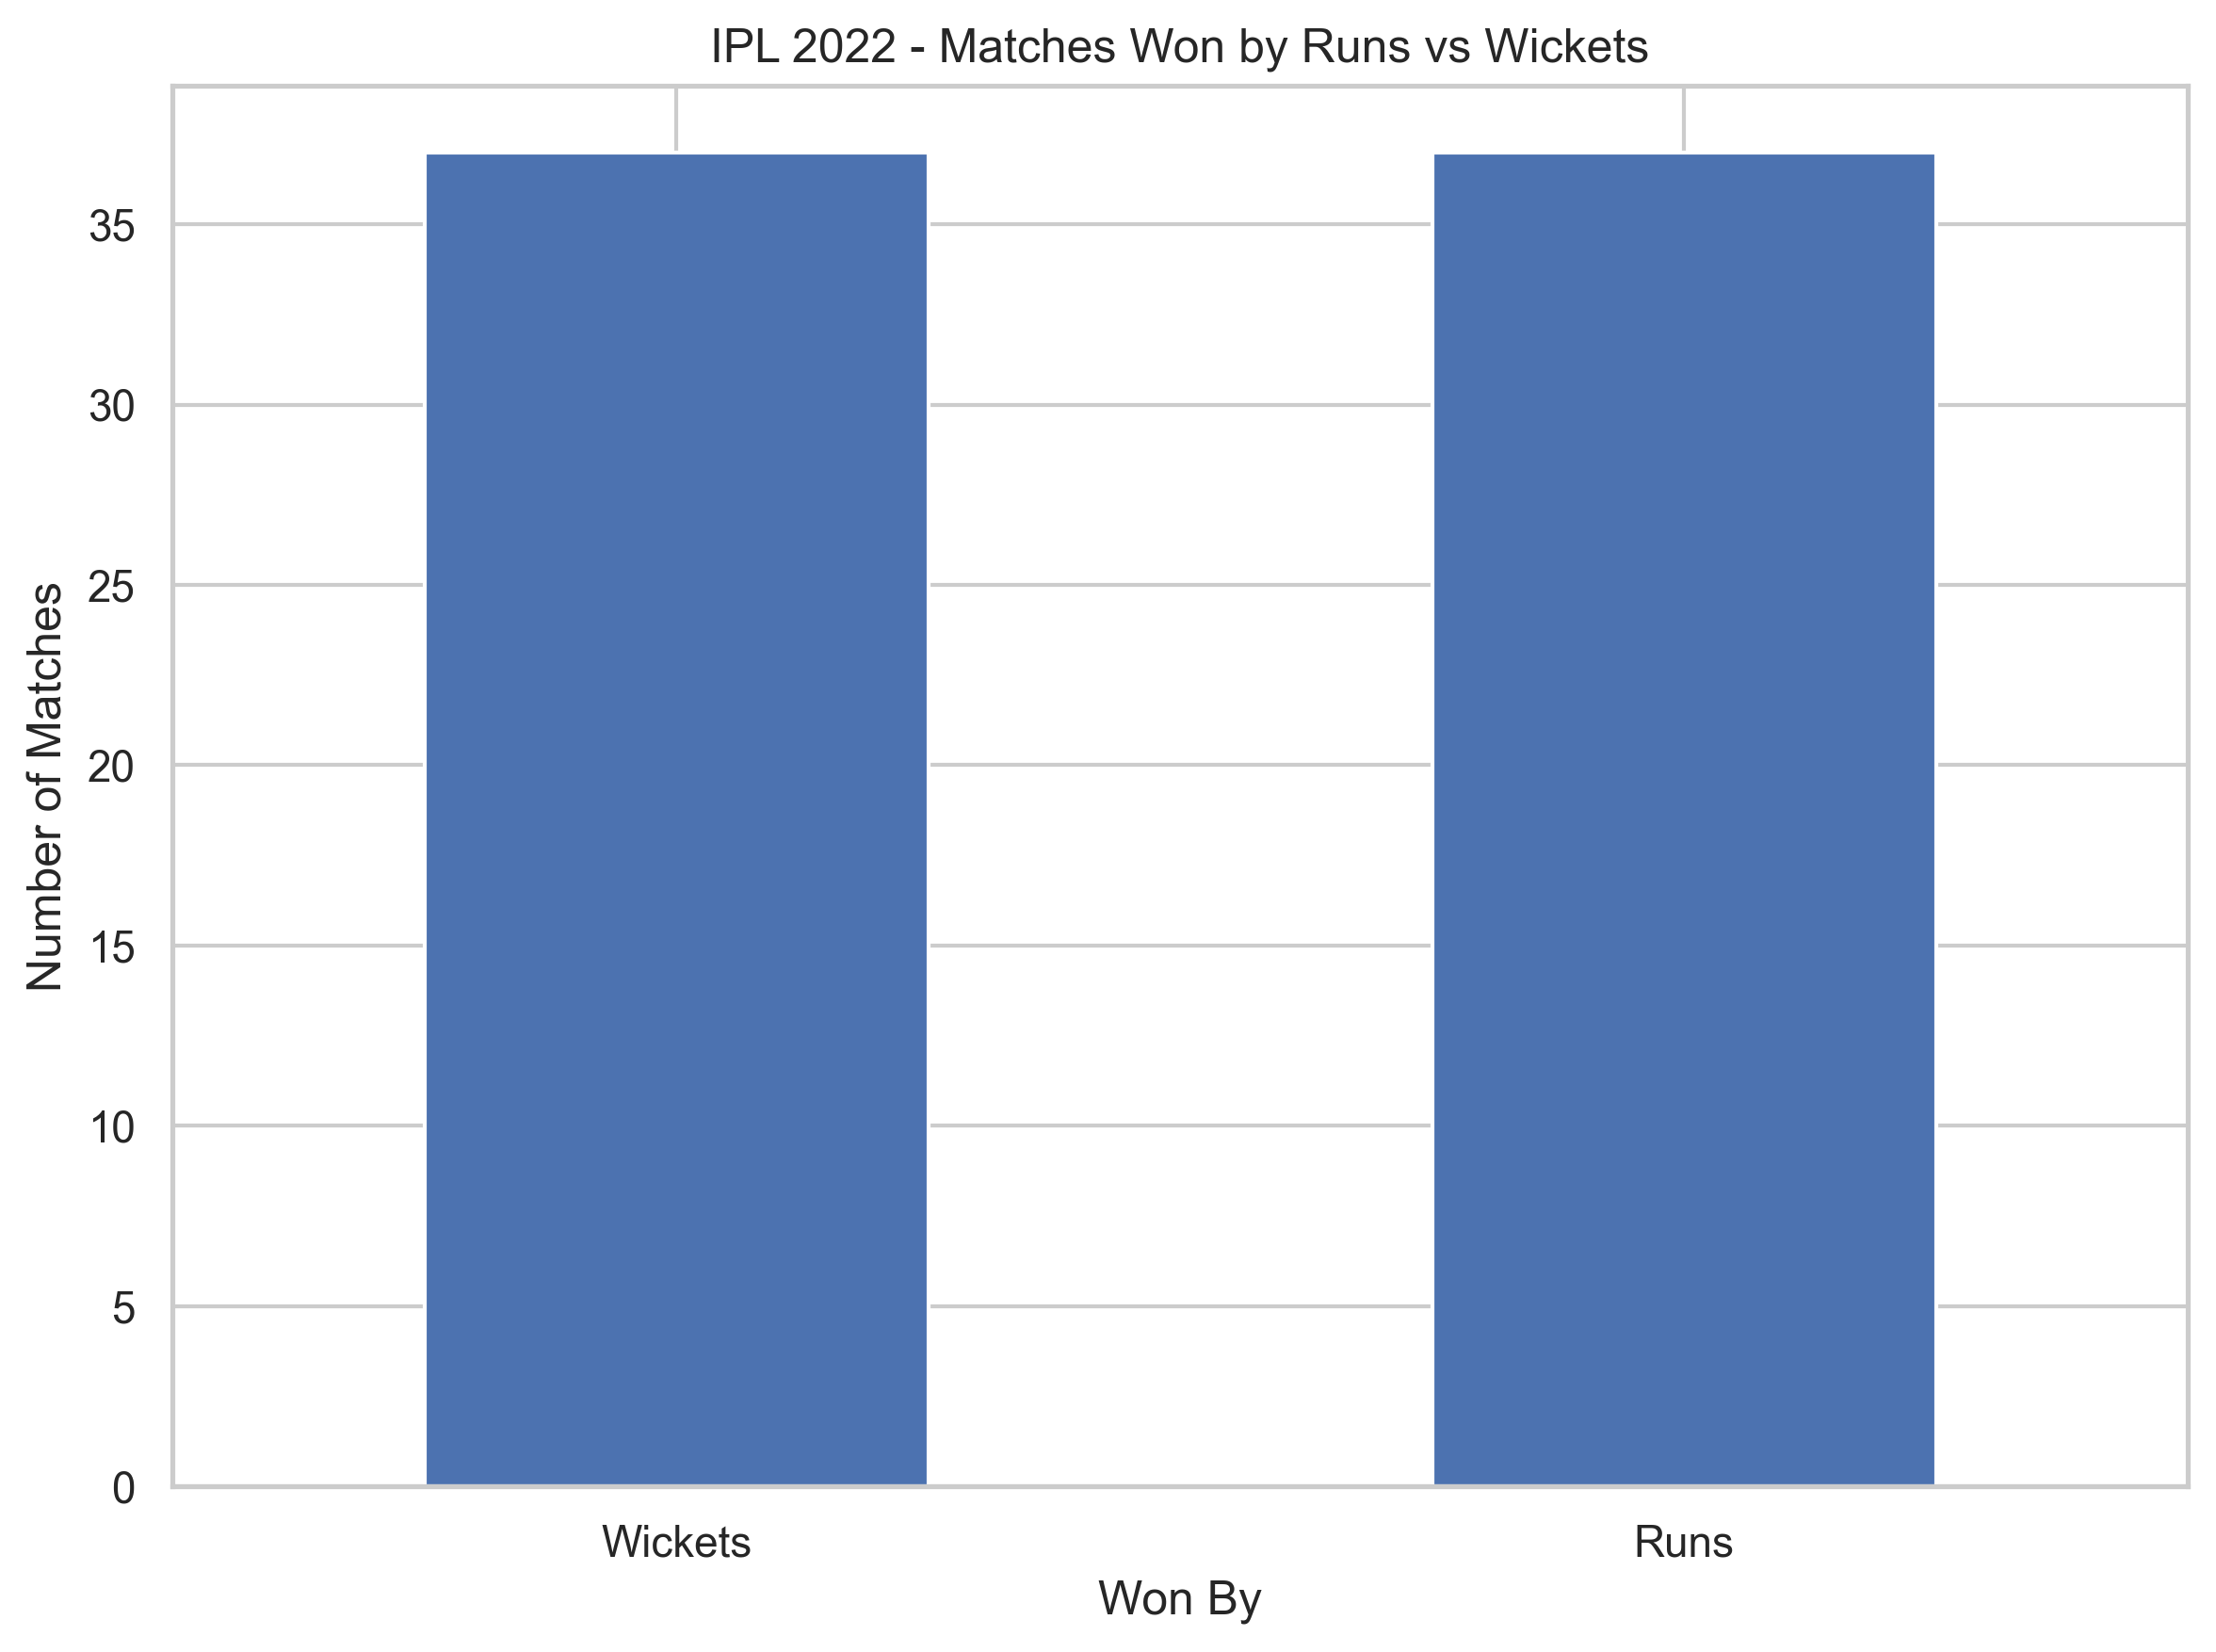
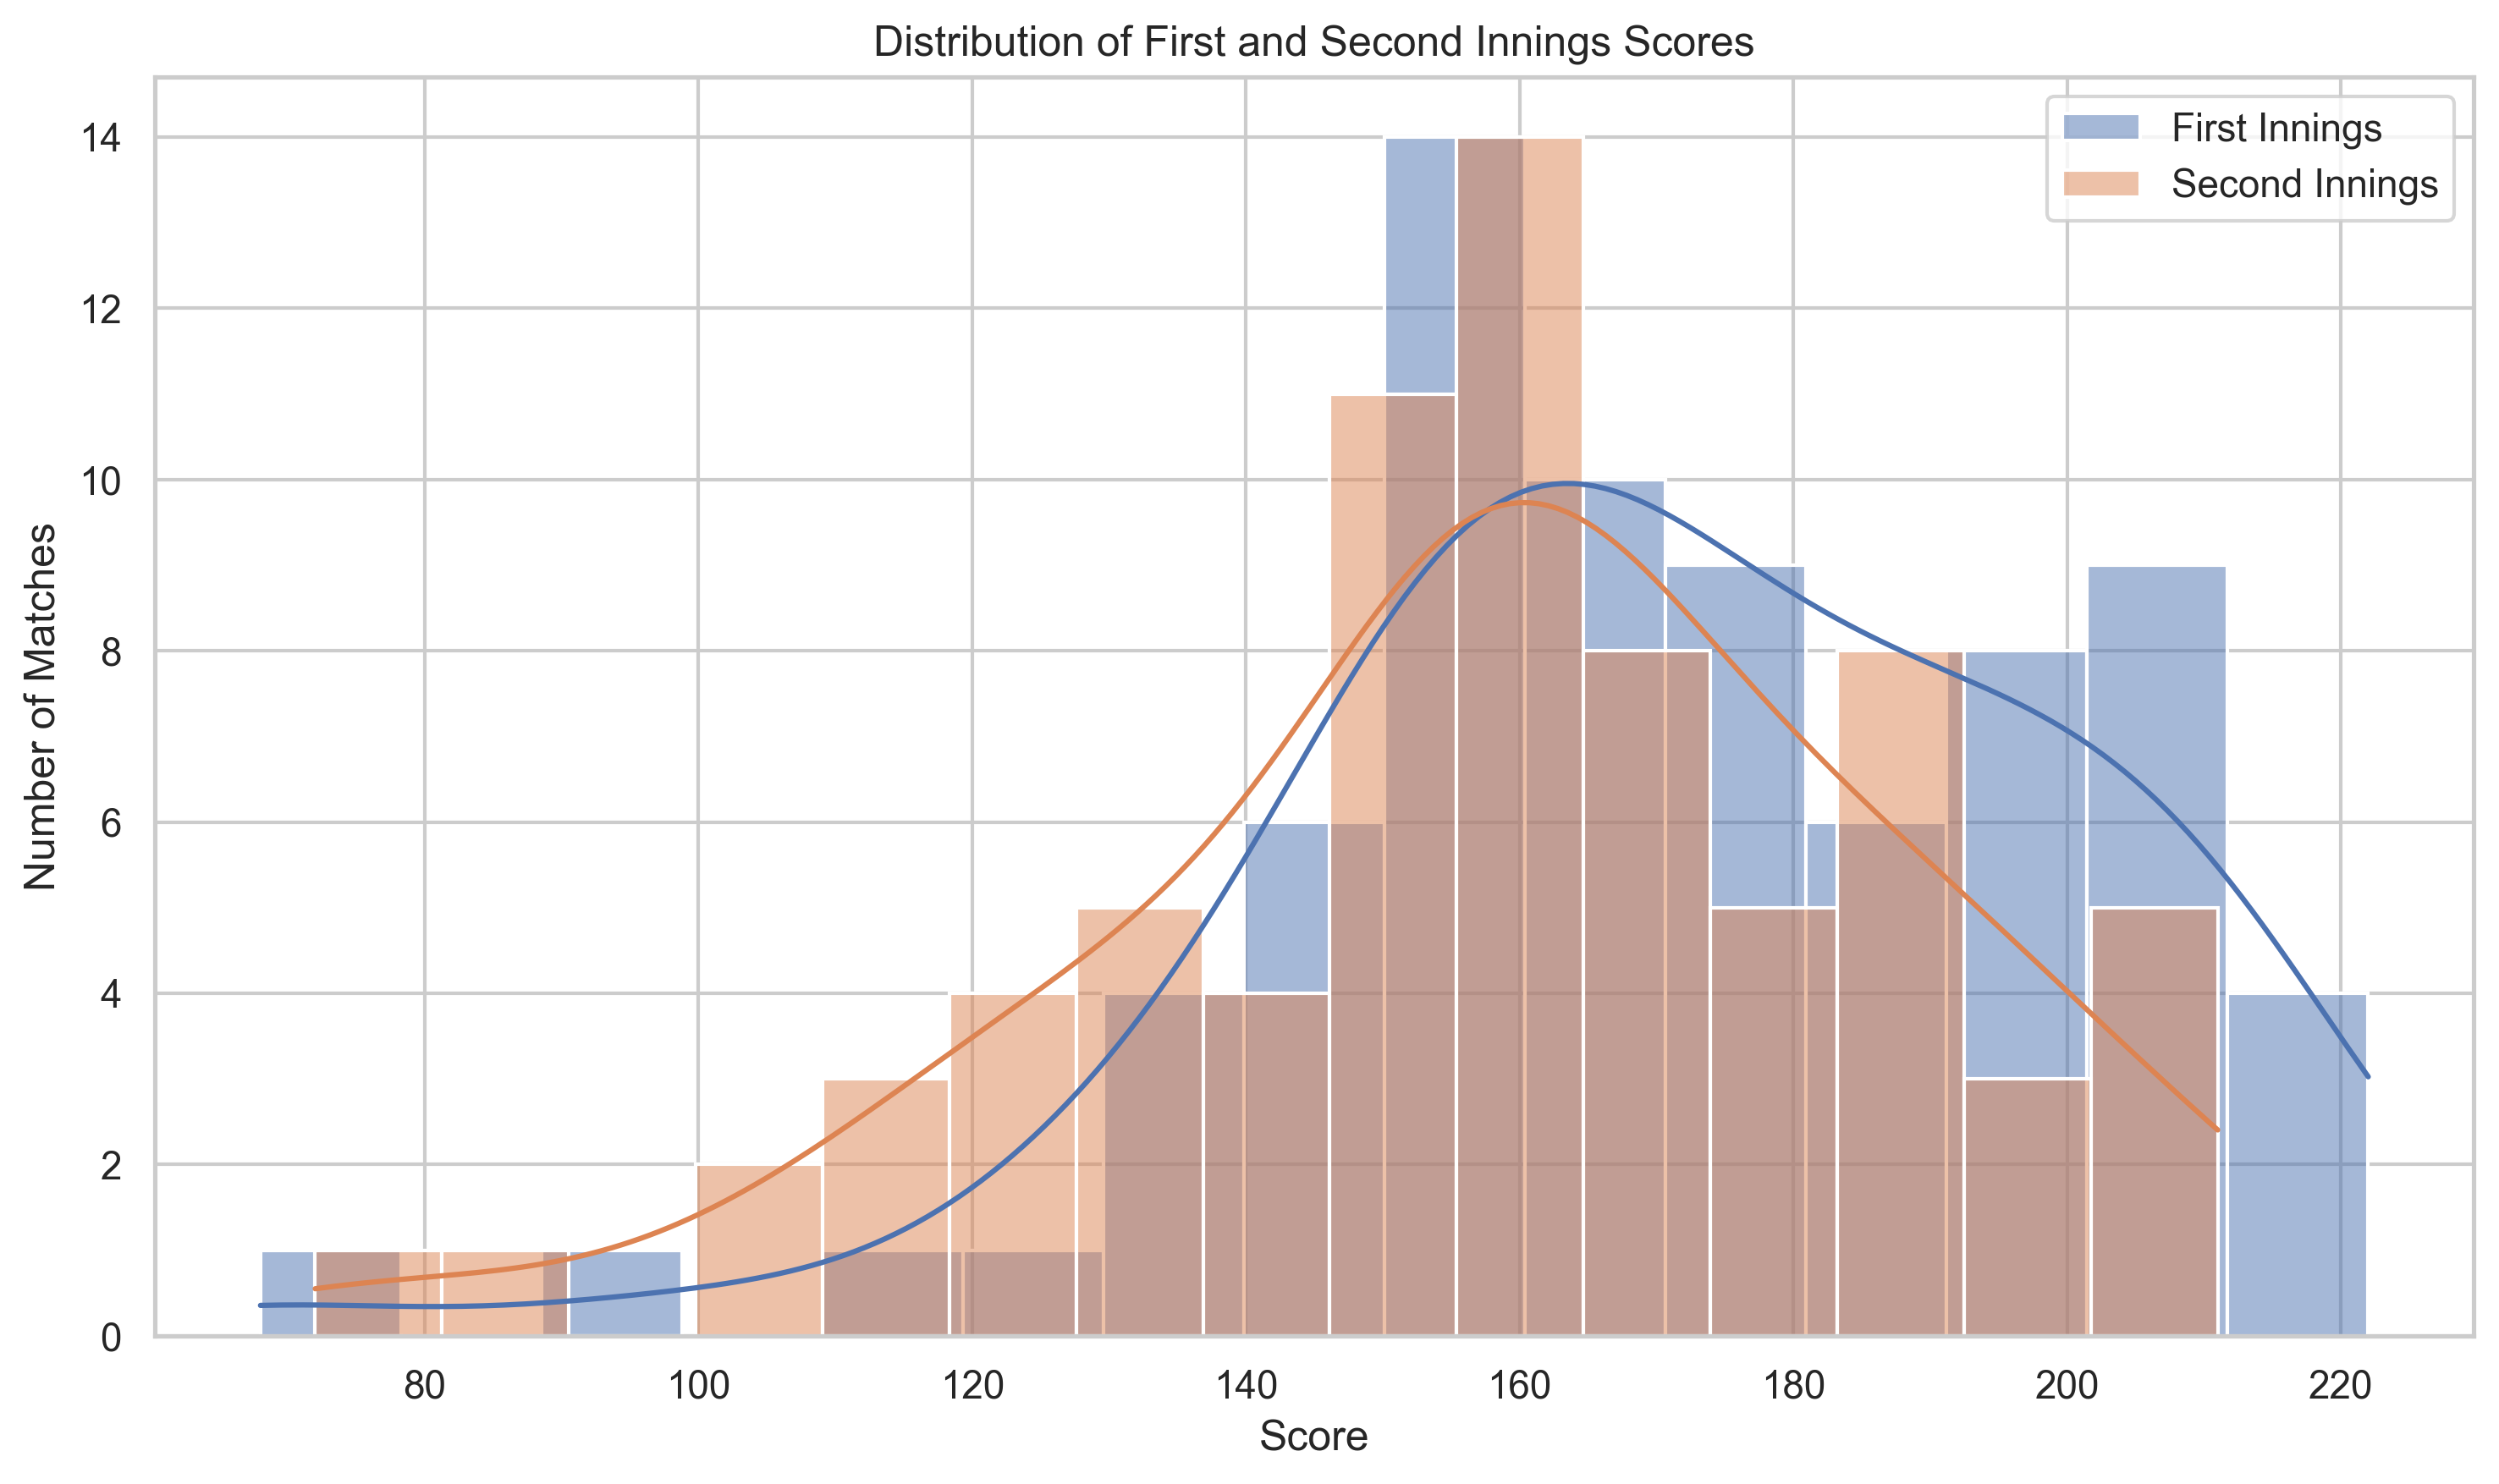
The project was developed using Python and an IPL 2022 CSV dataset. First, the dataset was loaded using Pandas and its columns and values were examined. The data was then cleaned and prepared for analysis. Different analyses were performed to study team wins, toss outcomes, player performances, scores, venues, and winning margins. Finally, charts such as bar charts, pie charts, scatter plots, and histograms were created to present the findings visually.
Challenges we ran into
One of the key challenges was working with a real-world IPL dataset and understanding the meaning and structure of its different attributes. We had to carefully handle data types, verify missing values, standardize inconsistent values, and ensure that the dataset was suitable for analysis. Another challenge was selecting the most relevant analytical questions and matching them with appropriate visualizations. We also faced practical challenges such as managing file paths, handling categorical data, and presenting the results in a clear and meaningful way.
Accomplishments that we're proud of
We successfully developed a complete IPL 2022 data analysis and visualization project using Python. The project transforms raw match-level data into meaningful insights about team performance, toss outcomes, player contributions, scoring patterns, venues, and winning margins. We implemented multiple visualizations using Matplotlib and Seaborn, allowing complex information to be understood quickly. We are particularly proud of creating an automated analysis workflow that processes the dataset, generates insights, and produces visual outputs in a structured manner.
What we learned
This project gave us practical experience in the complete data analysis workflow, from data collection and cleaning to analysis, visualization, and interpretation. We learned how to use Pandas for data manipulation, NumPy for numerical operations, and Matplotlib and Seaborn for visualization. More importantly, we learned that effective data analysis is not only about generating graphs but also about asking meaningful questions, identifying patterns, validating findings, and communicating insights clearly.
What's next for IPL 2022 Match Insights Using Python and Data Visualization
The project can be extended beyond IPL 2022 by incorporating data from multiple IPL seasons to identify long-term trends in team and player performance. Future improvements could include an interactive dashboard using Power BI, Tableau, or Streamlit, allowing users to filter matches by team, player, venue, or season. We could also introduce advanced statistical analysis and machine-learning techniques to study factors influencing match outcomes and build predictive models. The long-term goal is to transform the project from a static analysis into an interactive cricket analytics platform capable of providing deeper, data-driven insights.

Log in or sign up for Devpost to join the conversation.