-
-
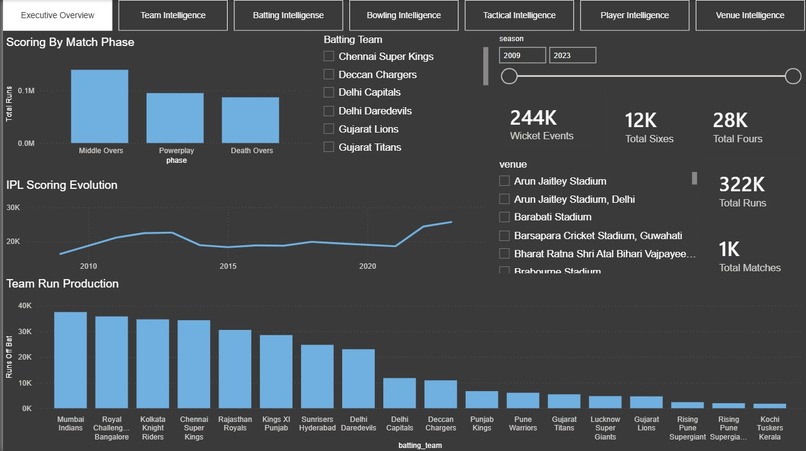
EXECUTIVE OVERVIEW
-
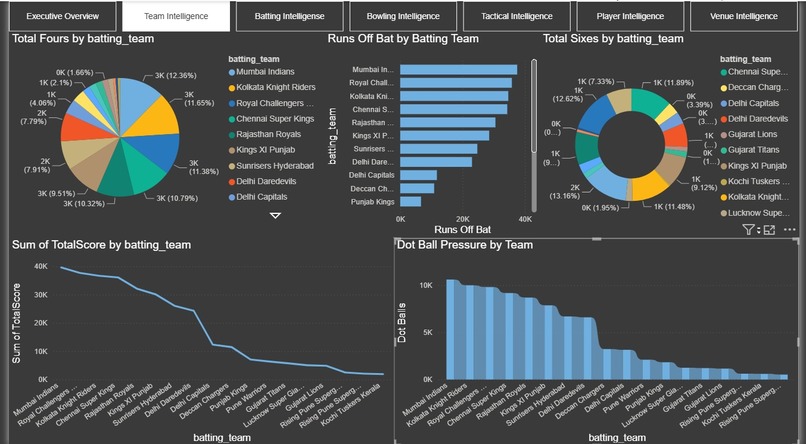
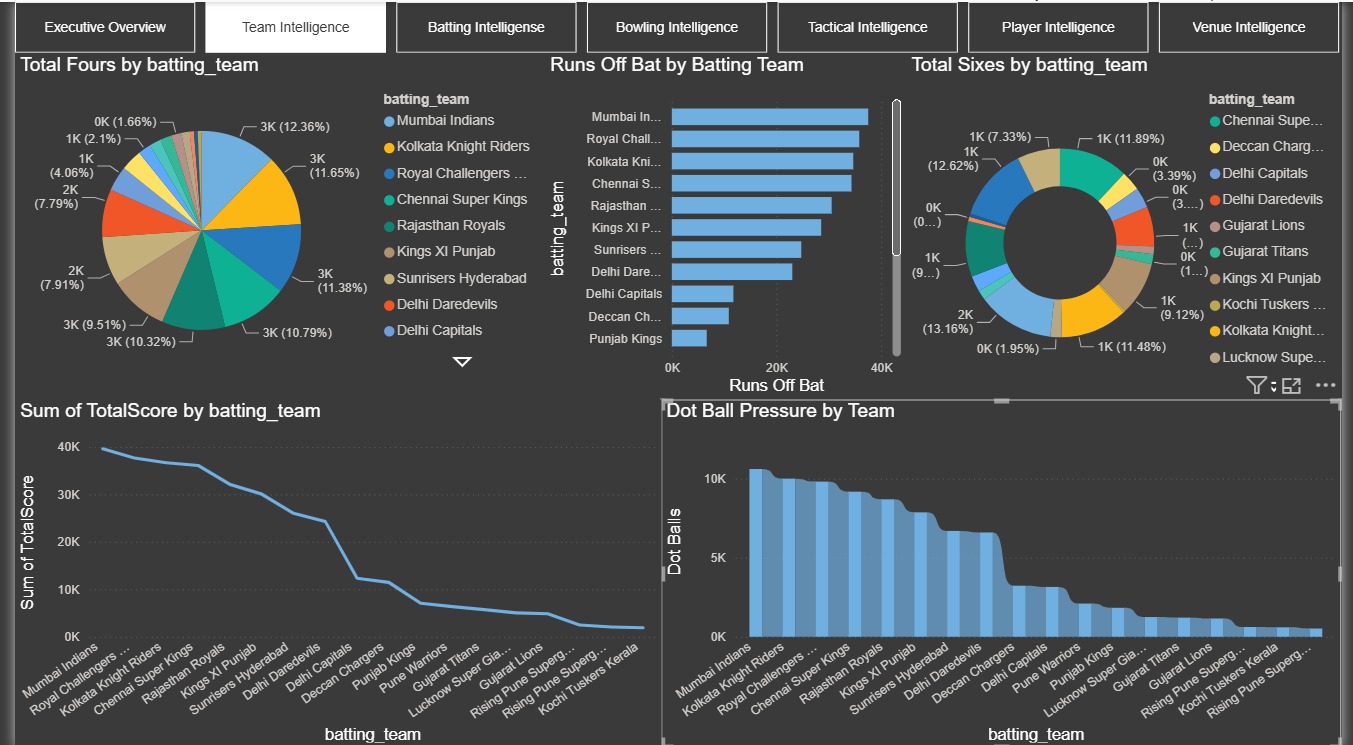
TEAM INTELLIGENCE
-
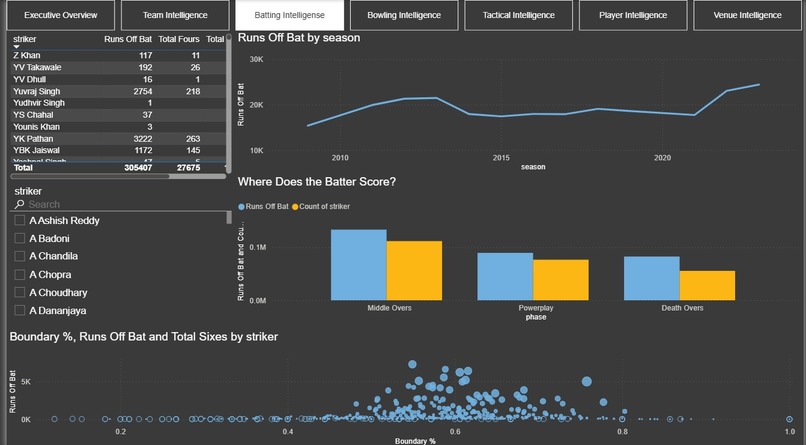
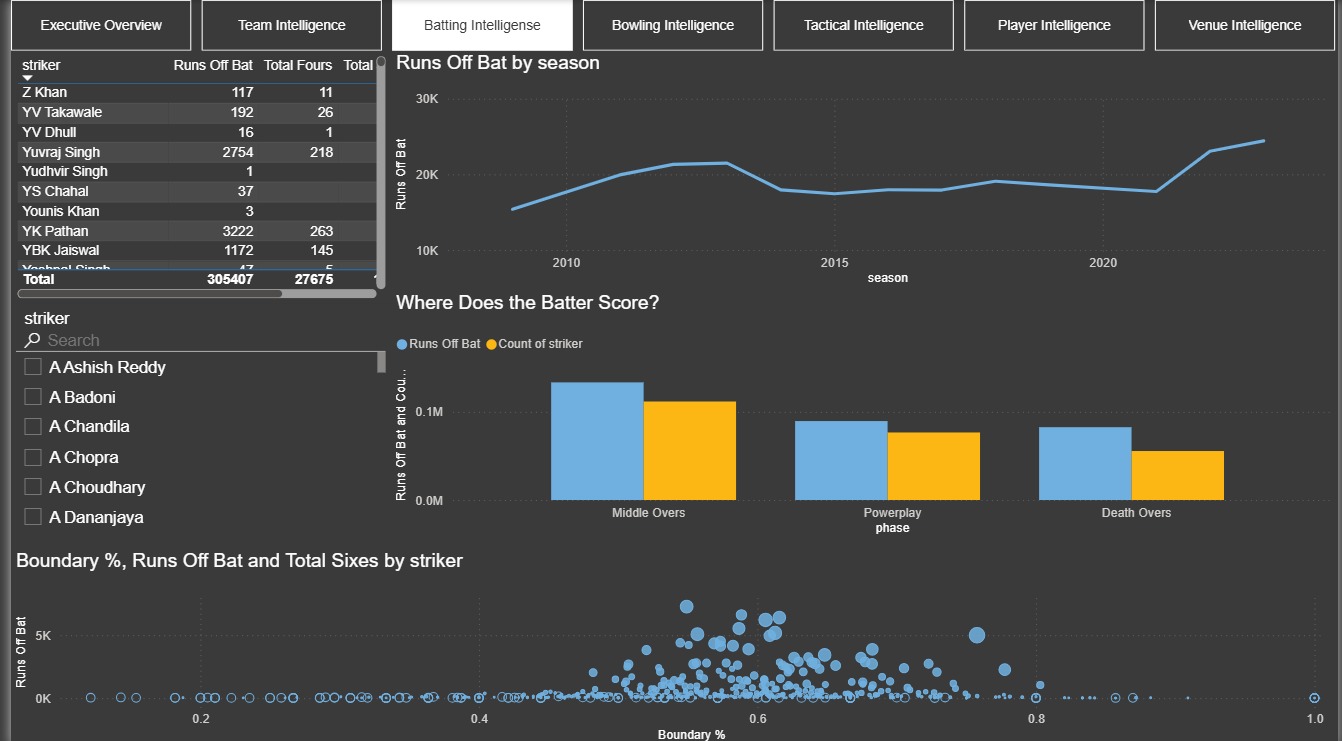
BATTING INTELLIGENCE
-
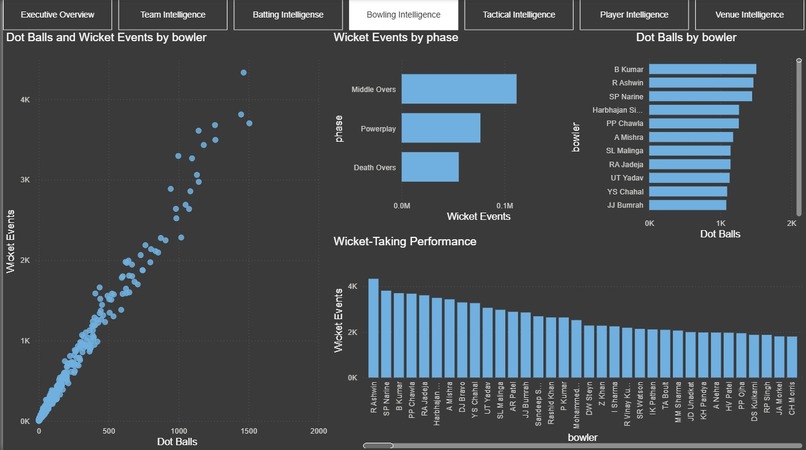
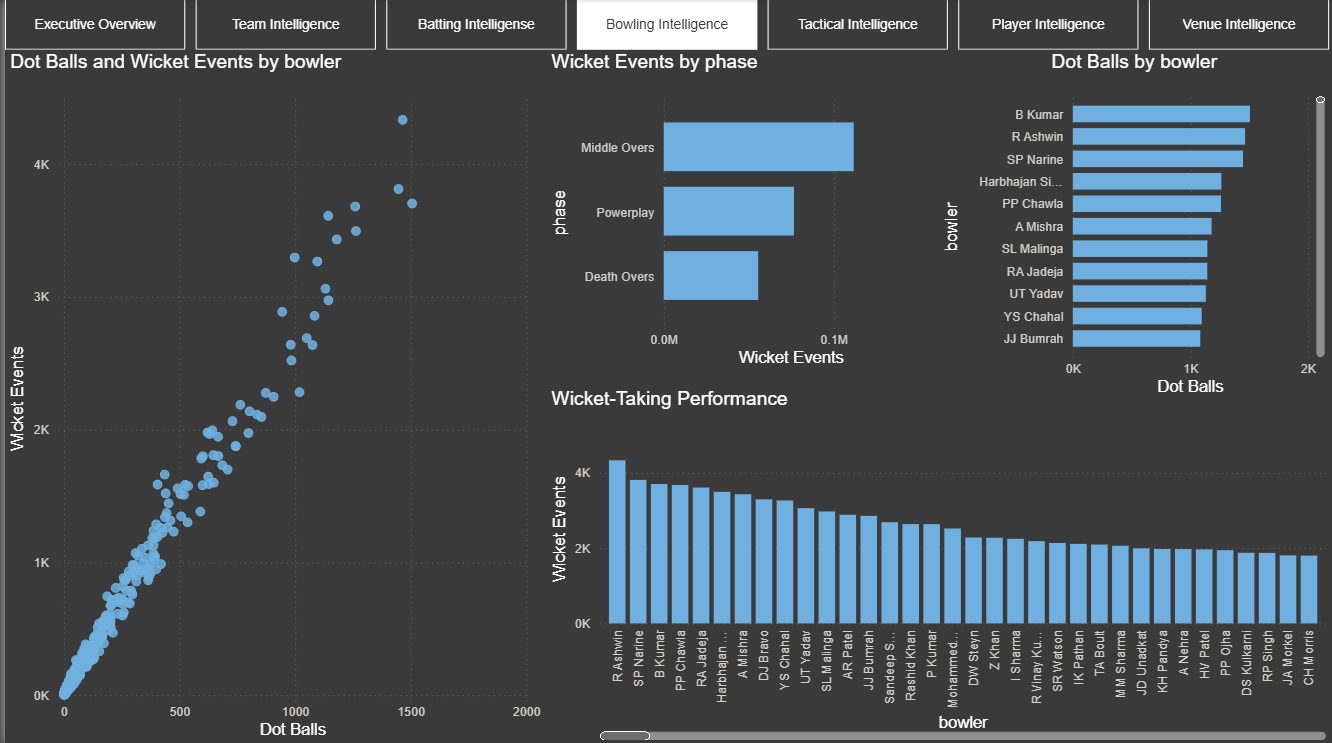
BOWLING INTELLIGENCE
-
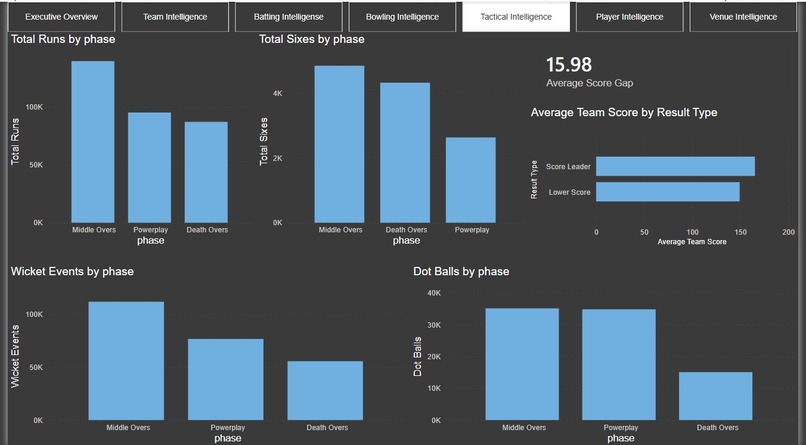
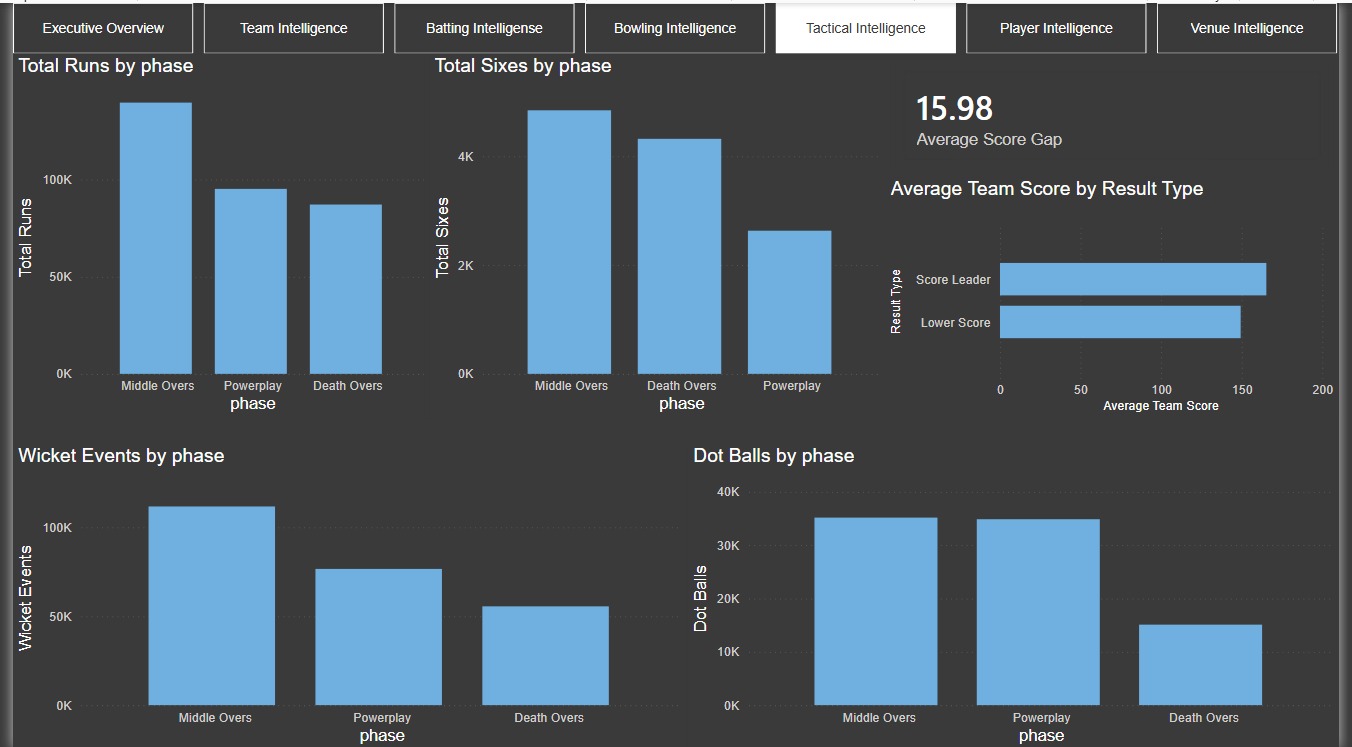
TACTIC INTELLIGENCE
-
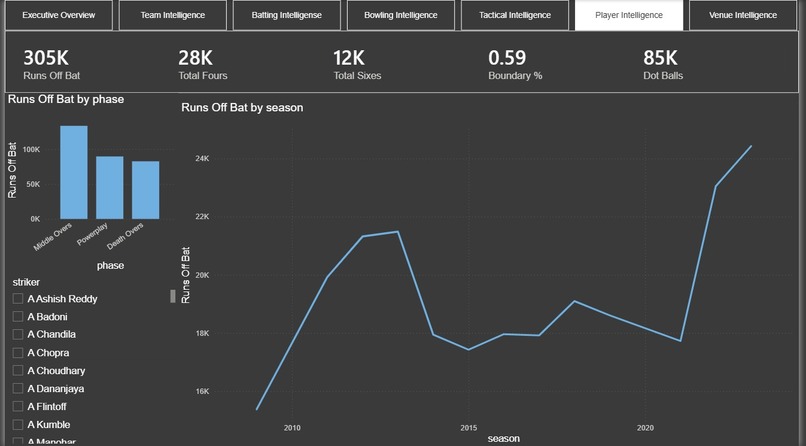
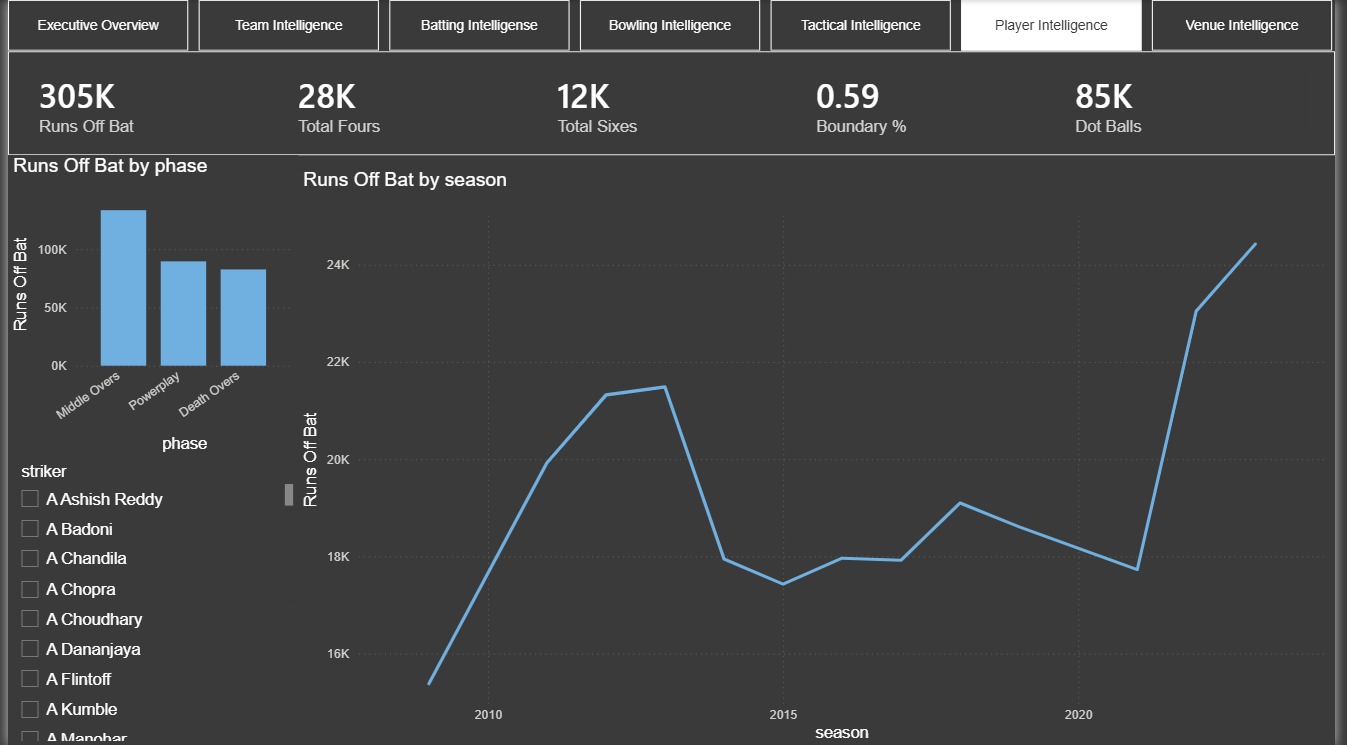
PLAYERS INTELLIGENCE
-
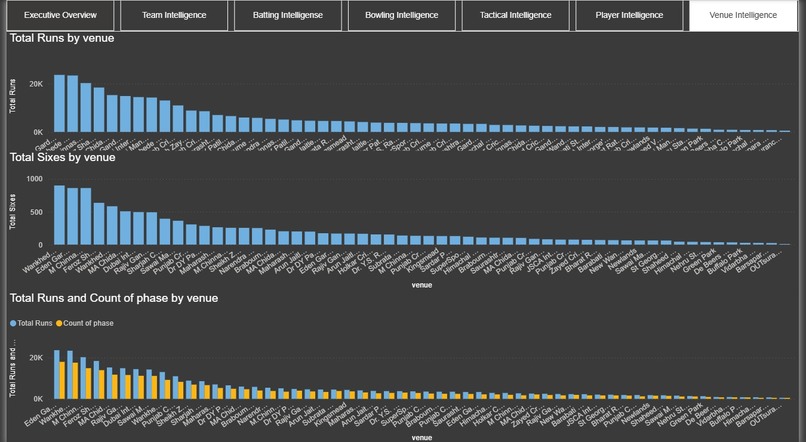
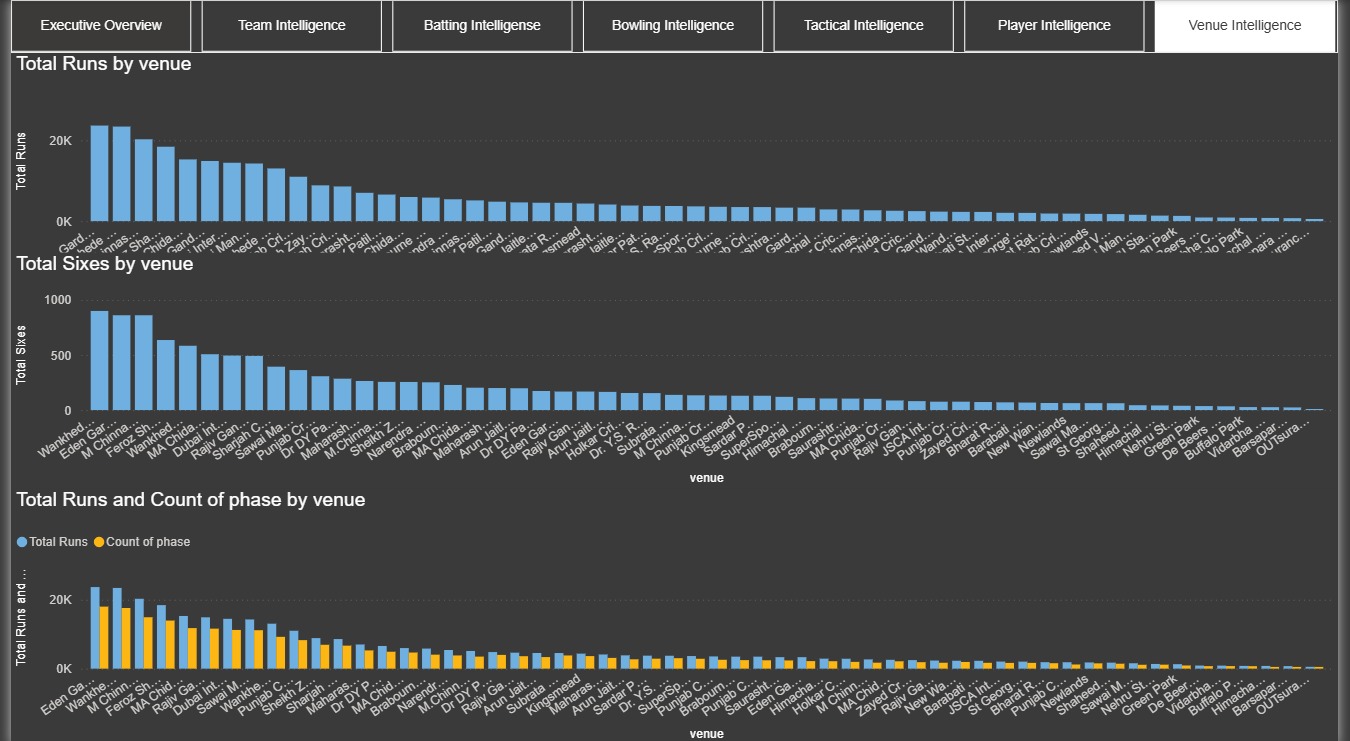
VENUE INTELLIGENCE
What it does
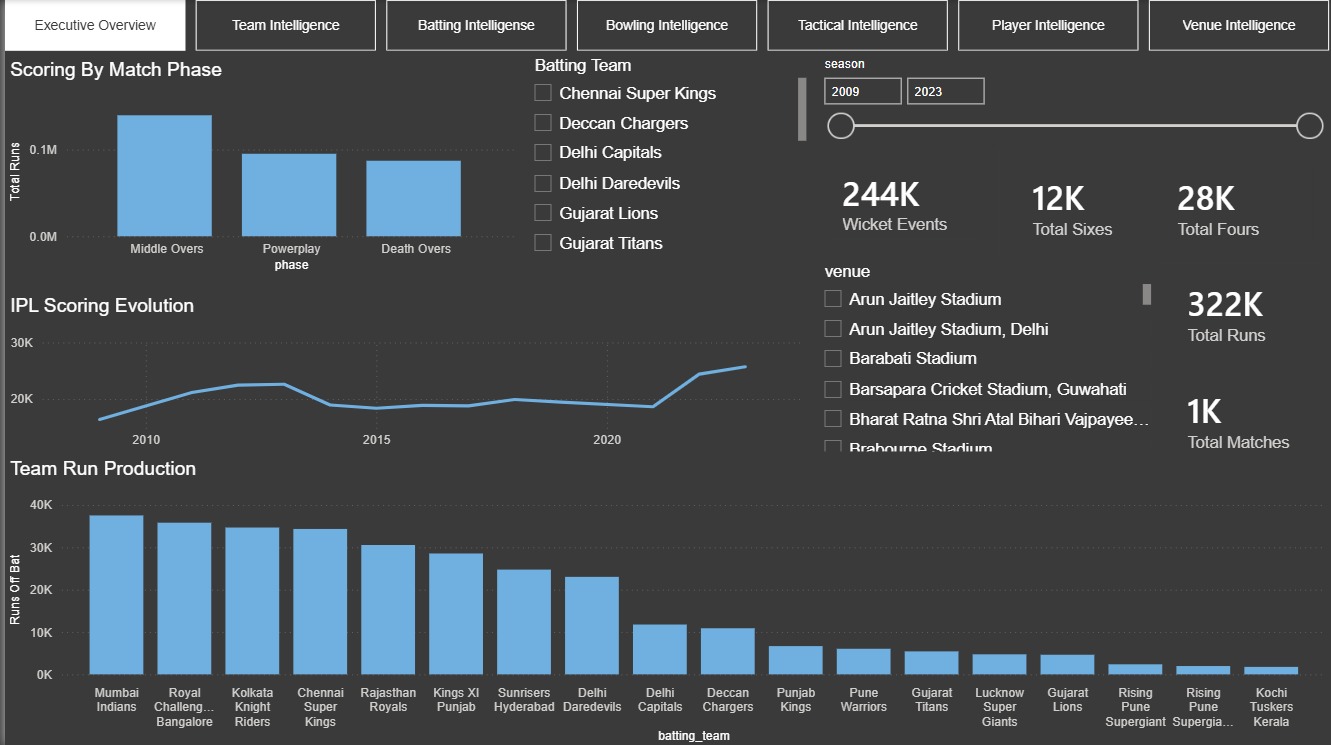
This project is a Power BI-based IPL analytics dashboard covering IPL data from 2009–2023. It provides insights into team, batting, bowling, tactical, player, and venue performance using interactive visualizations. Key metrics include runs, fours, sixes, dot balls, wicket events, scoring phases, and venue-wise performance.
How we built it
The dashboard was developed in Power BI using IPL match data and organized into multiple analytical sections. Visuals and filters were used to compare teams, players, bowlers, match phases, seasons, and venues.
Challenges we ran into
One of the main challenges was converting a large amount of IPL match data into clear and meaningful visual insights while keeping different aspects of batting, bowling, tactics, players, and venues organized.
Accomplishments that we're proud of
We created a multi-page dashboard that brings together key IPL statistics in one place, including team scoring, batting performance, bowling performance, match-phase analysis, player statistics, and venue analysis.
What we learned
This project helped us understand how to transform sports data into interactive dashboards and how different metrics can be used to analyze cricket performance across teams, players, match phases, and venues.
What's next for IPL (2009–2023) Analysis
The project can be further enhanced with deeper player comparisons, additional performance metrics, predictive analytics, and more advanced cricket intelligence features.
Built With
- csv
- kaggle
- powerbi


Log in or sign up for Devpost to join the conversation.