Inspiration
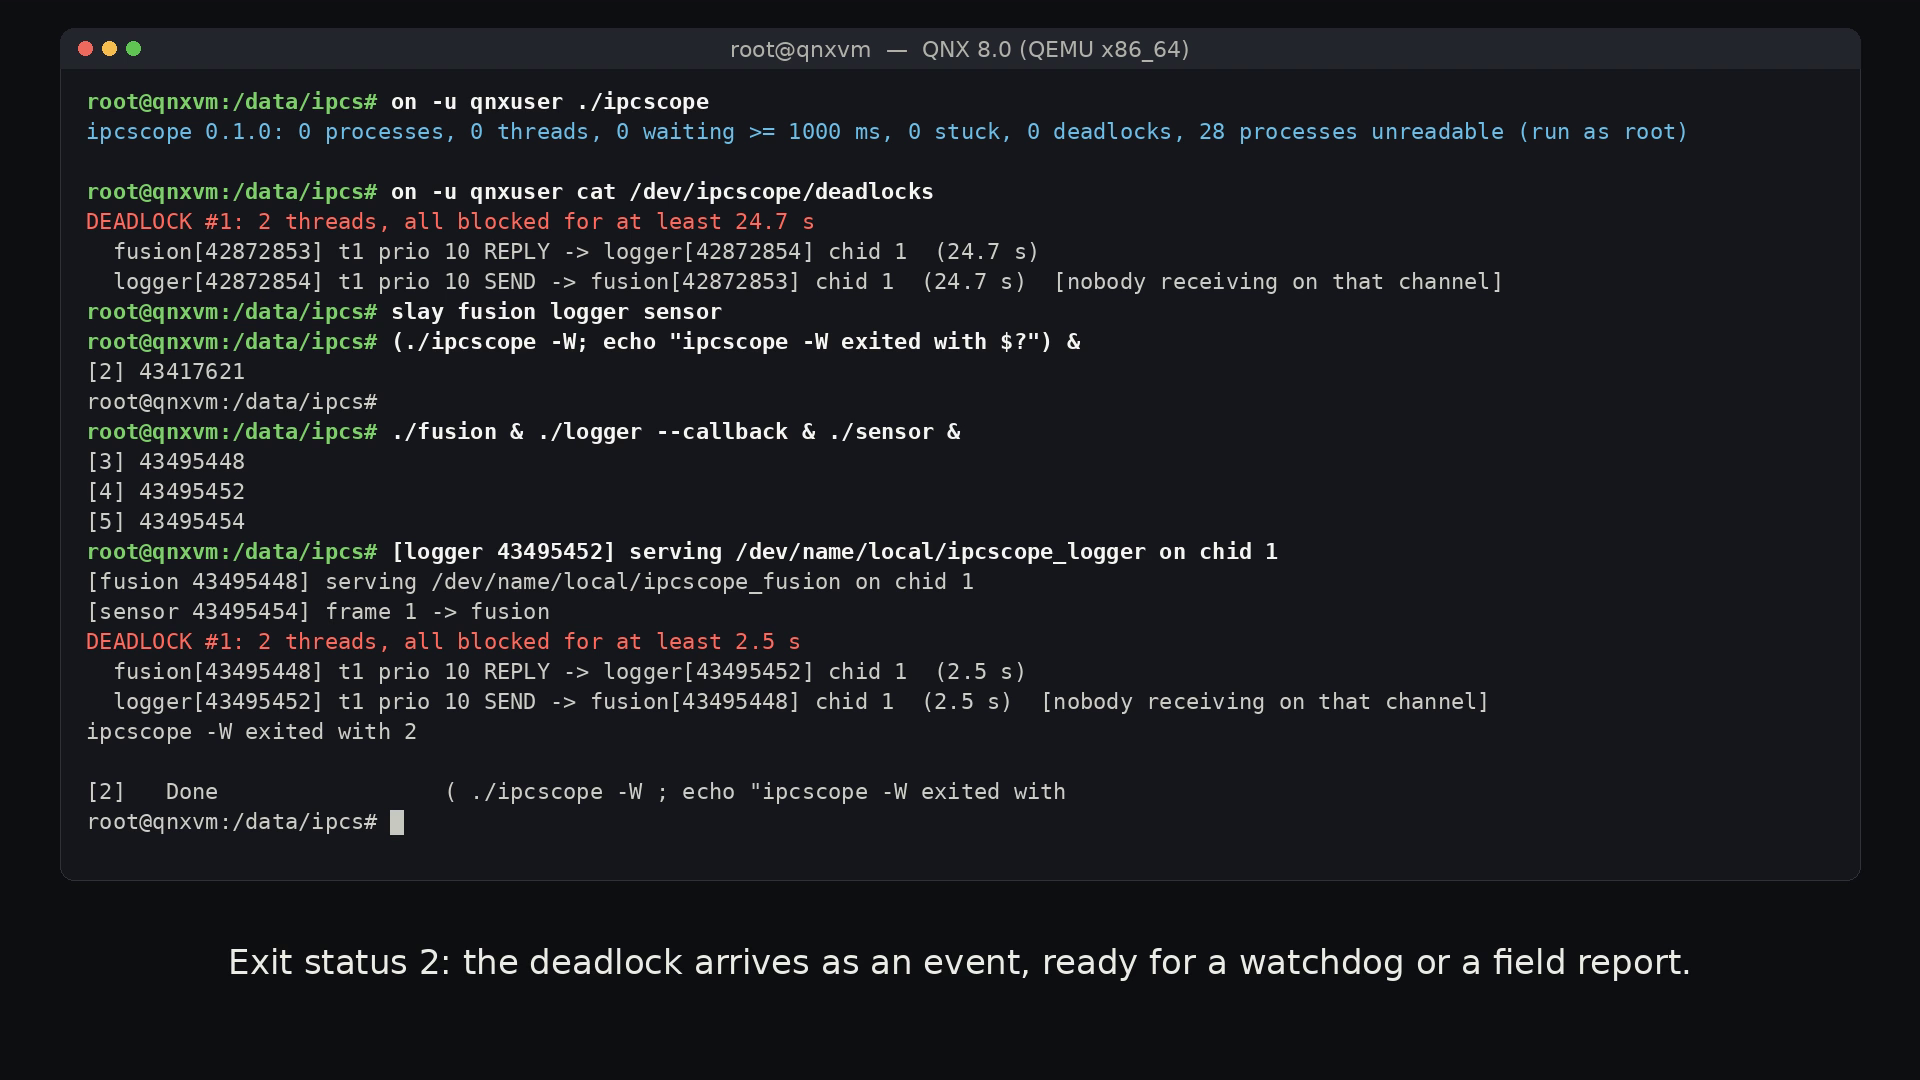
On QNX, almost every call is a message. open(), read() and a call into a driver or into your own server all block the caller until a server receives and replies. That synchronous model is what makes QNX systems predictable, and it is also how they freeze. Server A calls B while B calls back into A, and everything waiting on A stops too. Nothing crashes and nothing is logged.
pidin shows each thread's state one line at a time. Finding the cycle across dozens of servers and thread pools is still detective work, usually done at the worst possible moment. We wanted a tool that answers "who is waiting on whom, and can any of it ever wake up?" in one command, without root, and that can wake you up when it happens.
What it does
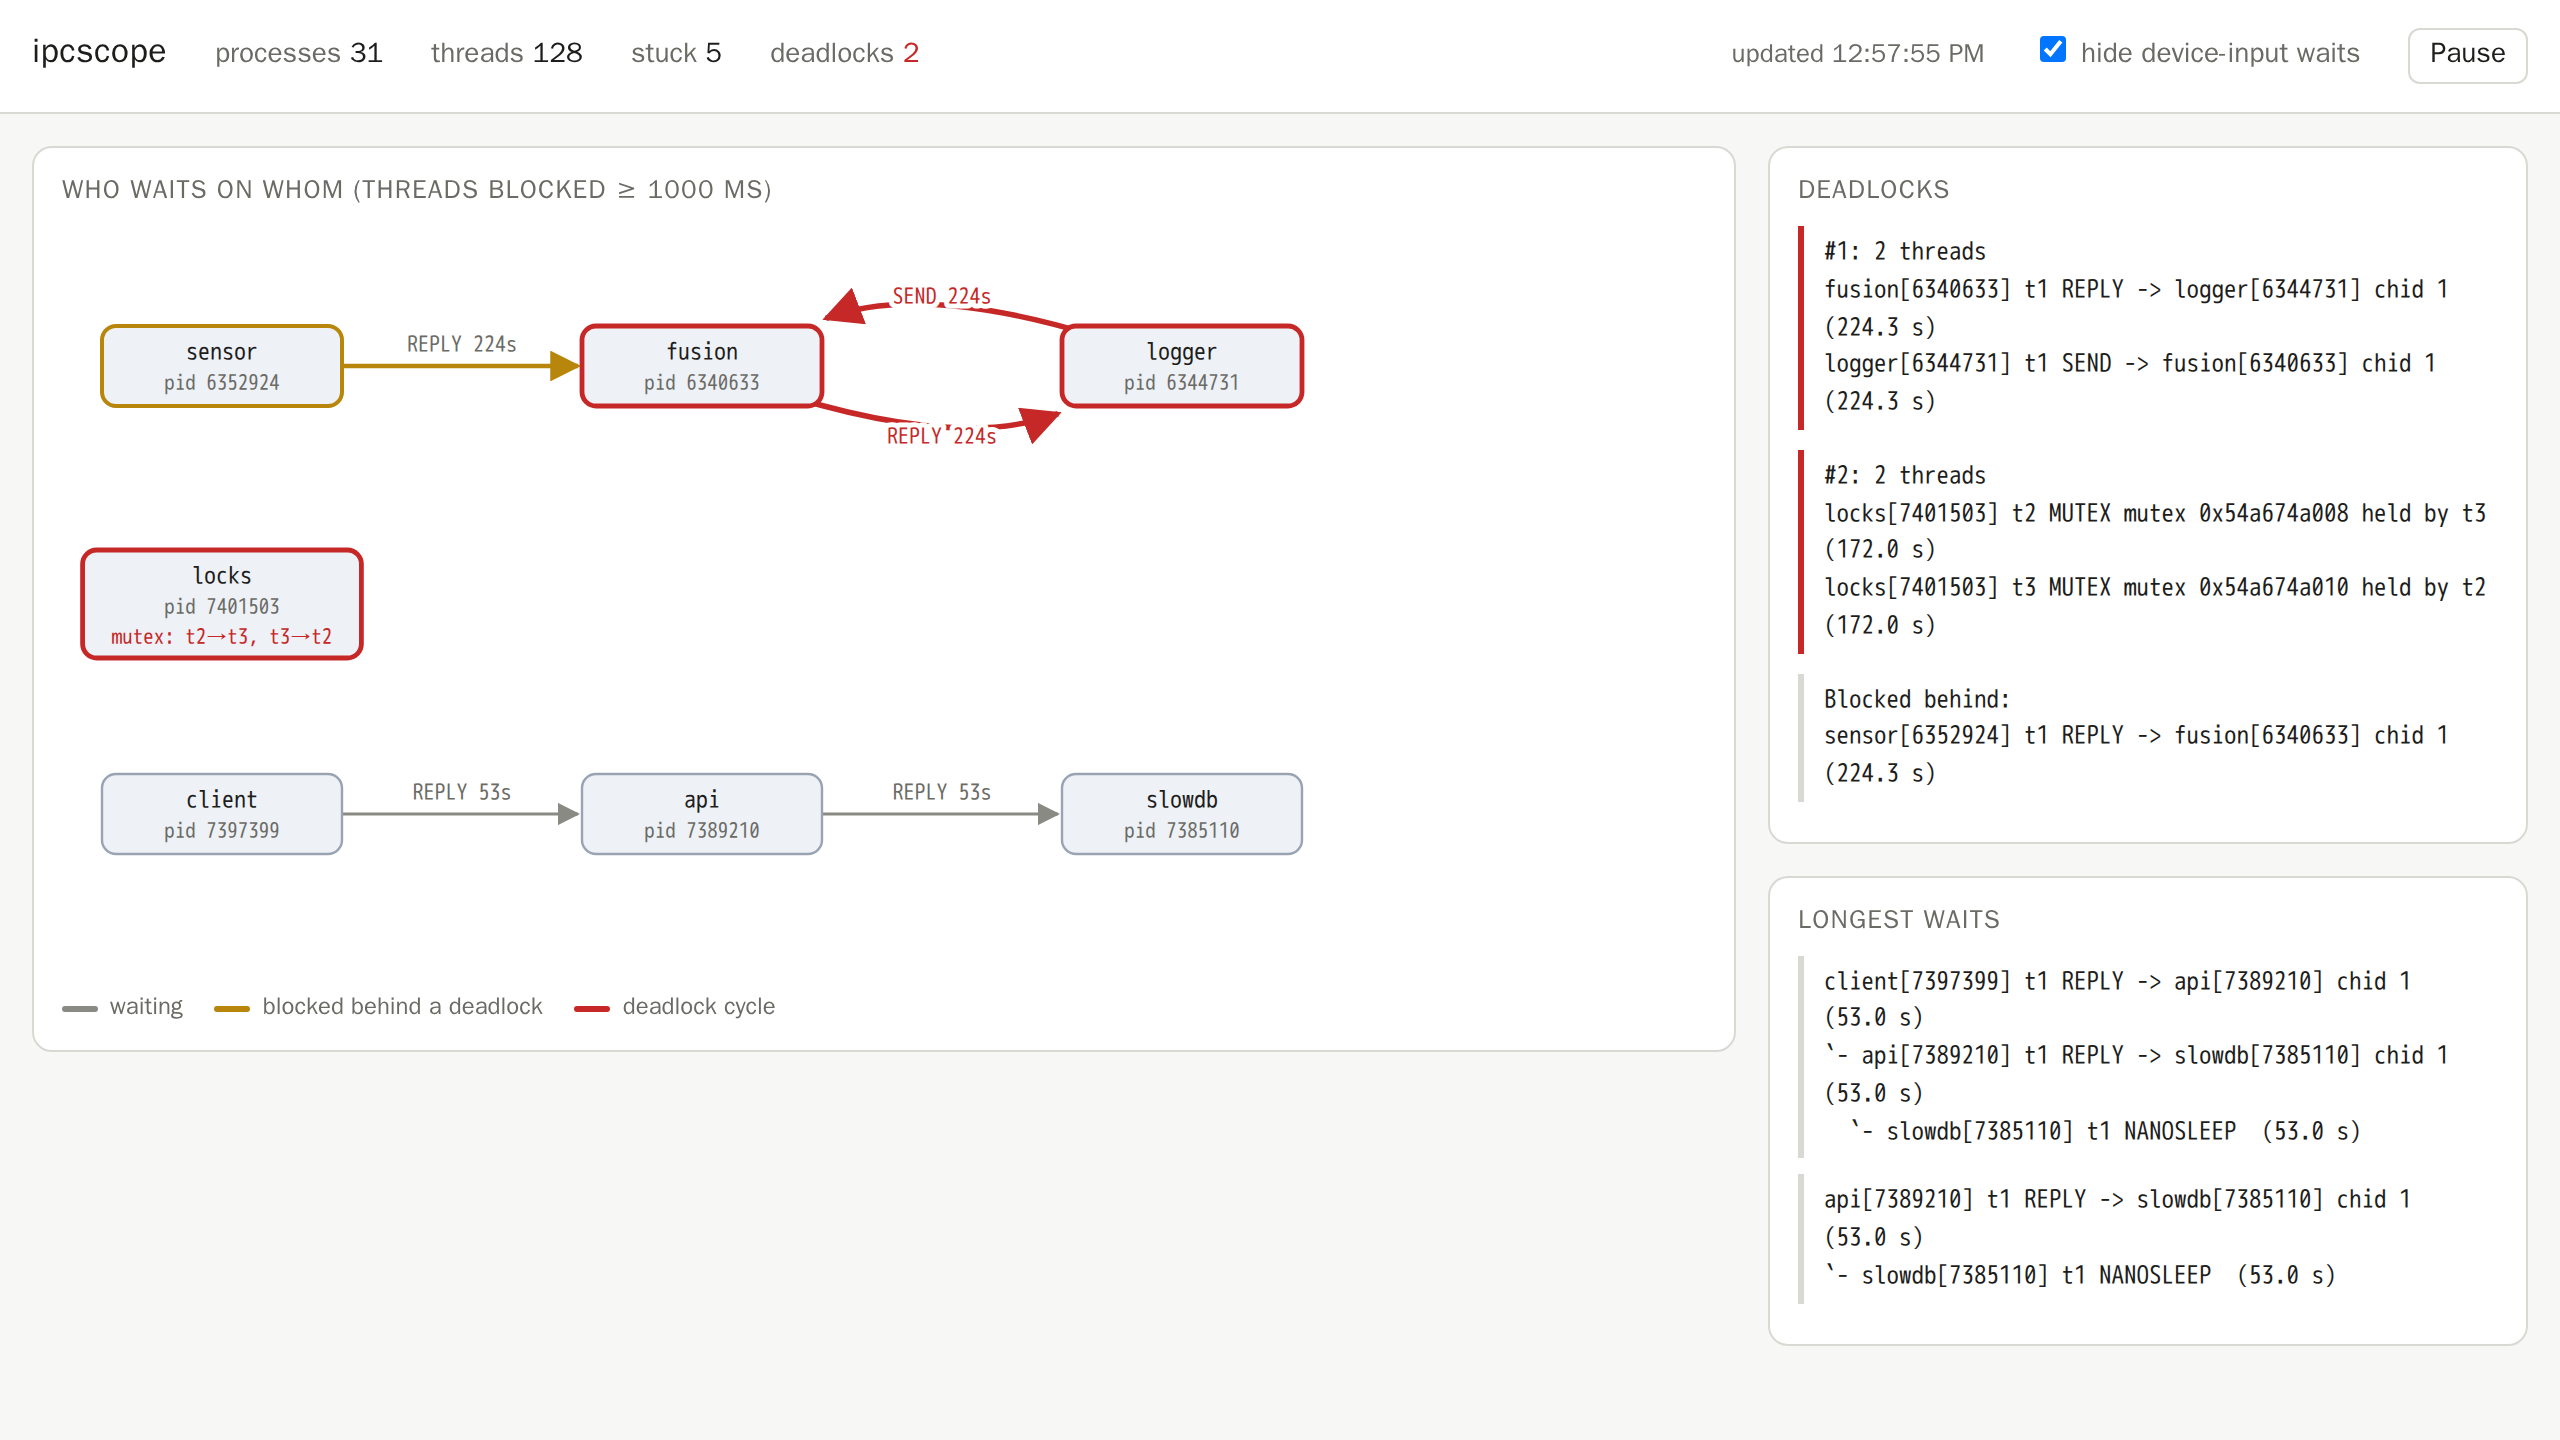
- Finds deadlocks in message passing (SEND/REPLY cycles) and in mutexes (lock-order cycles), and lists the threads stuck behind them.
- Explains long waits as a chain from the waiting client down to the thread that is actually doing, or not doing, the work: a server sleeping, an interrupt wait, a device read. It separates "slow" from "never".
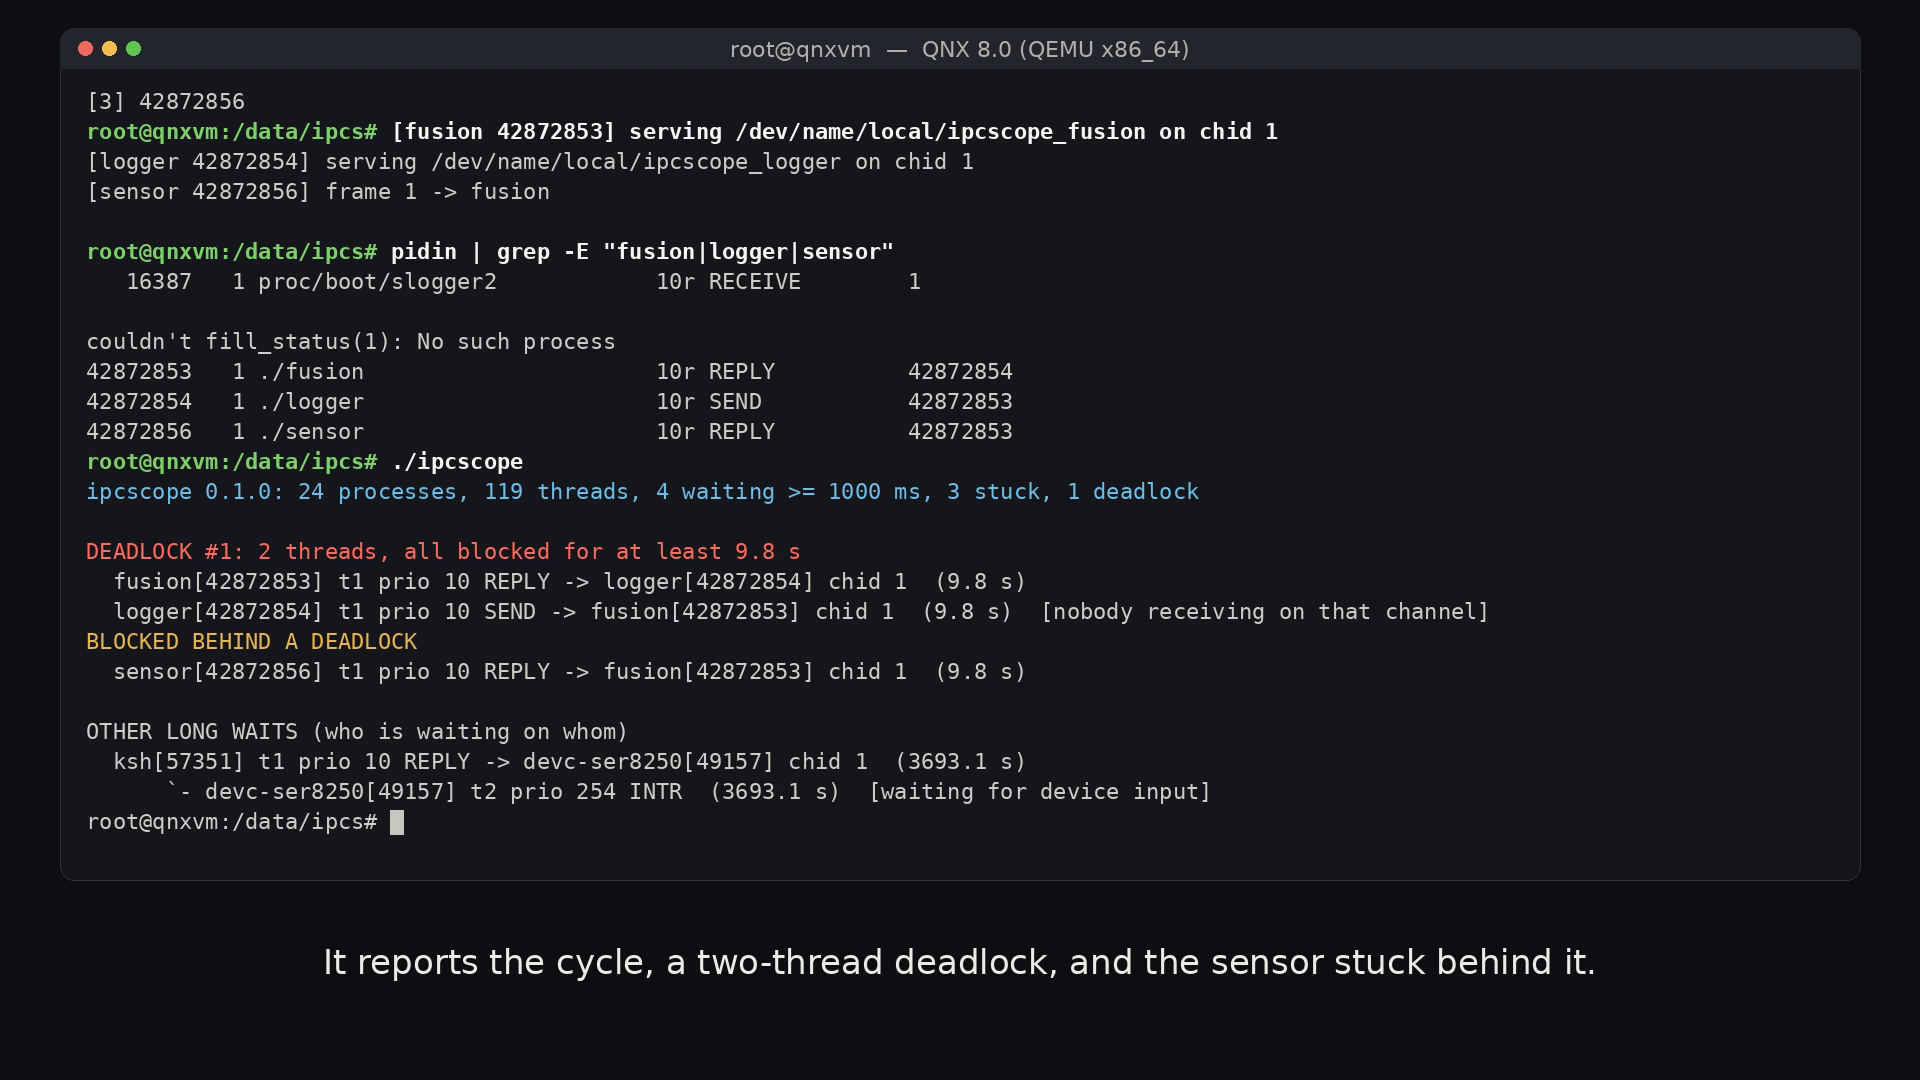
ipcscoped, a QNX resource manager, publishes the live analysis at/dev/ipcscope/{report,json,deadlocks,dot}. Any user cancatit, because the manager holds the root-only/procaccess once.- Event-driven alarms:
select()orionotify()on/dev/ipcscope/deadlocksfires when a new deadlock appears.ipcscope -Wwaits on it with no polling, and-xruns a hook with the full report. New deadlocks are also logged to slog2. - CI-ready:
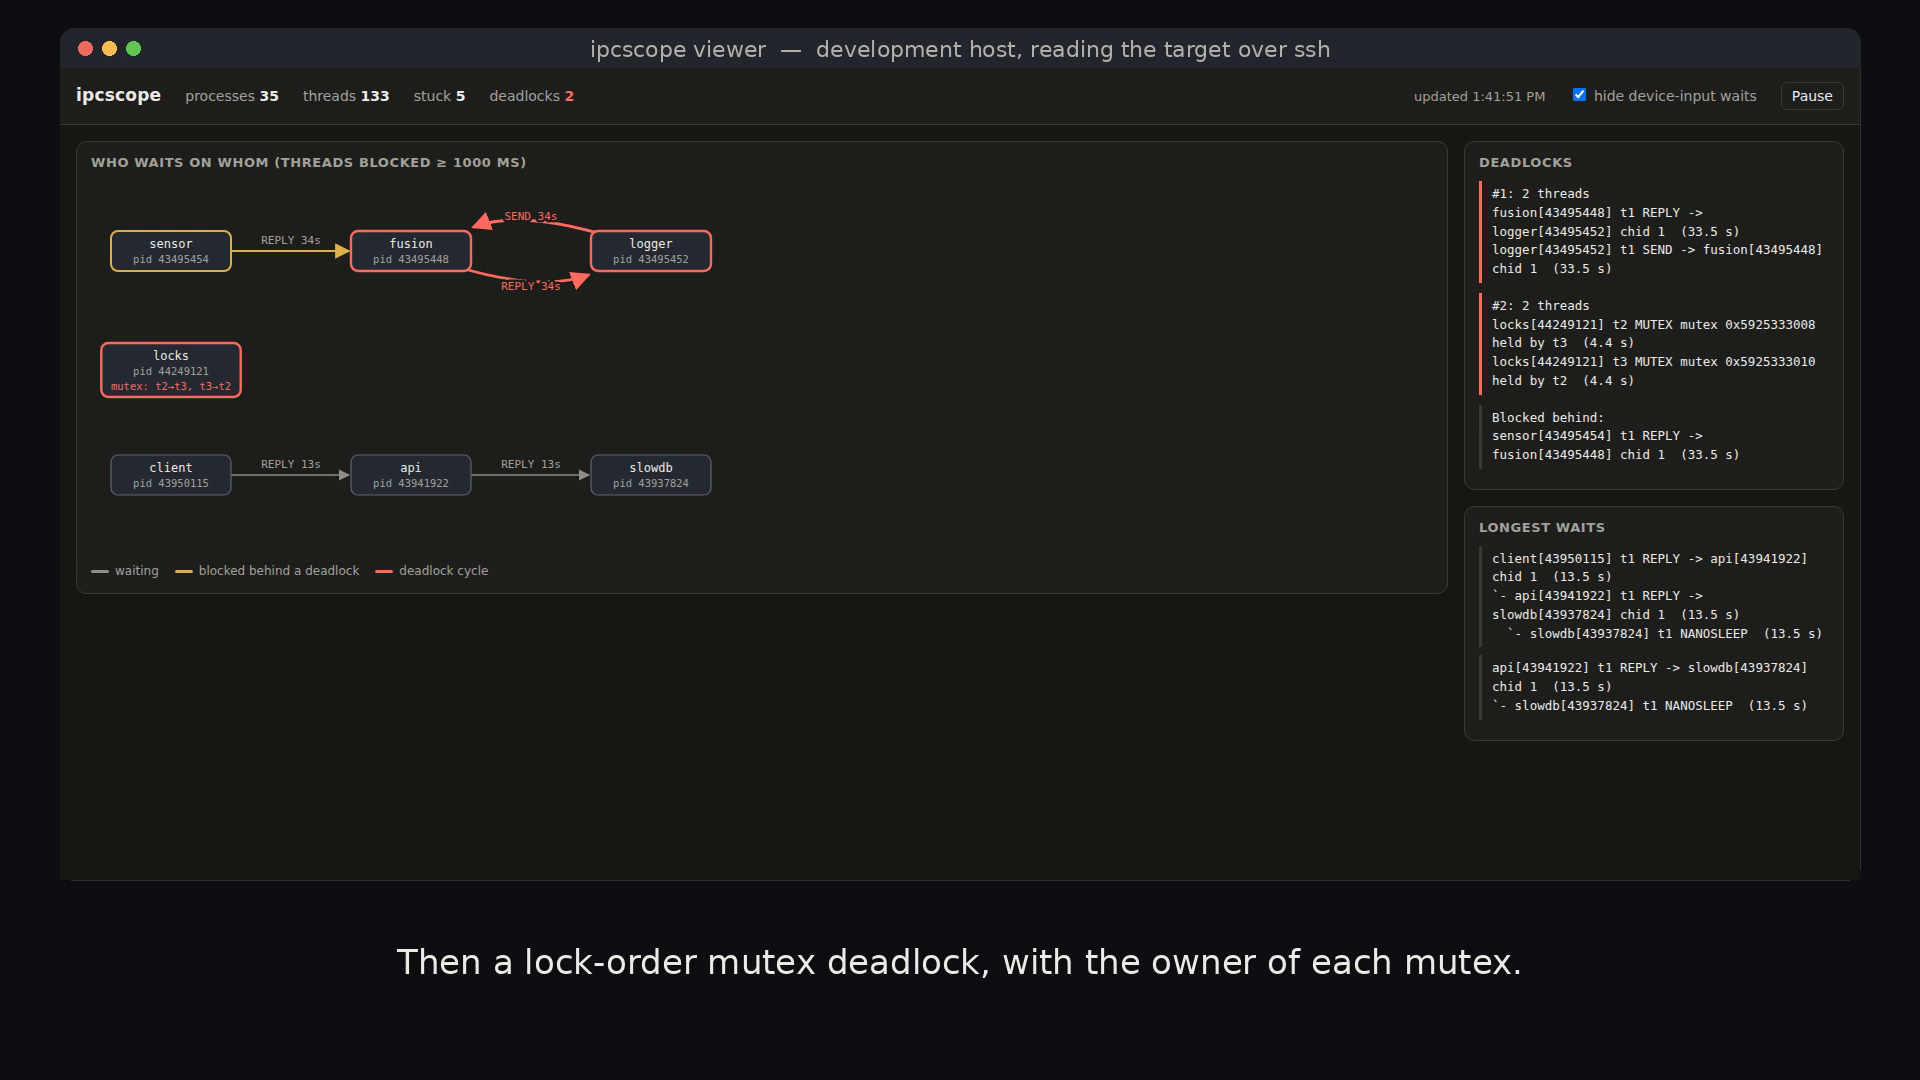
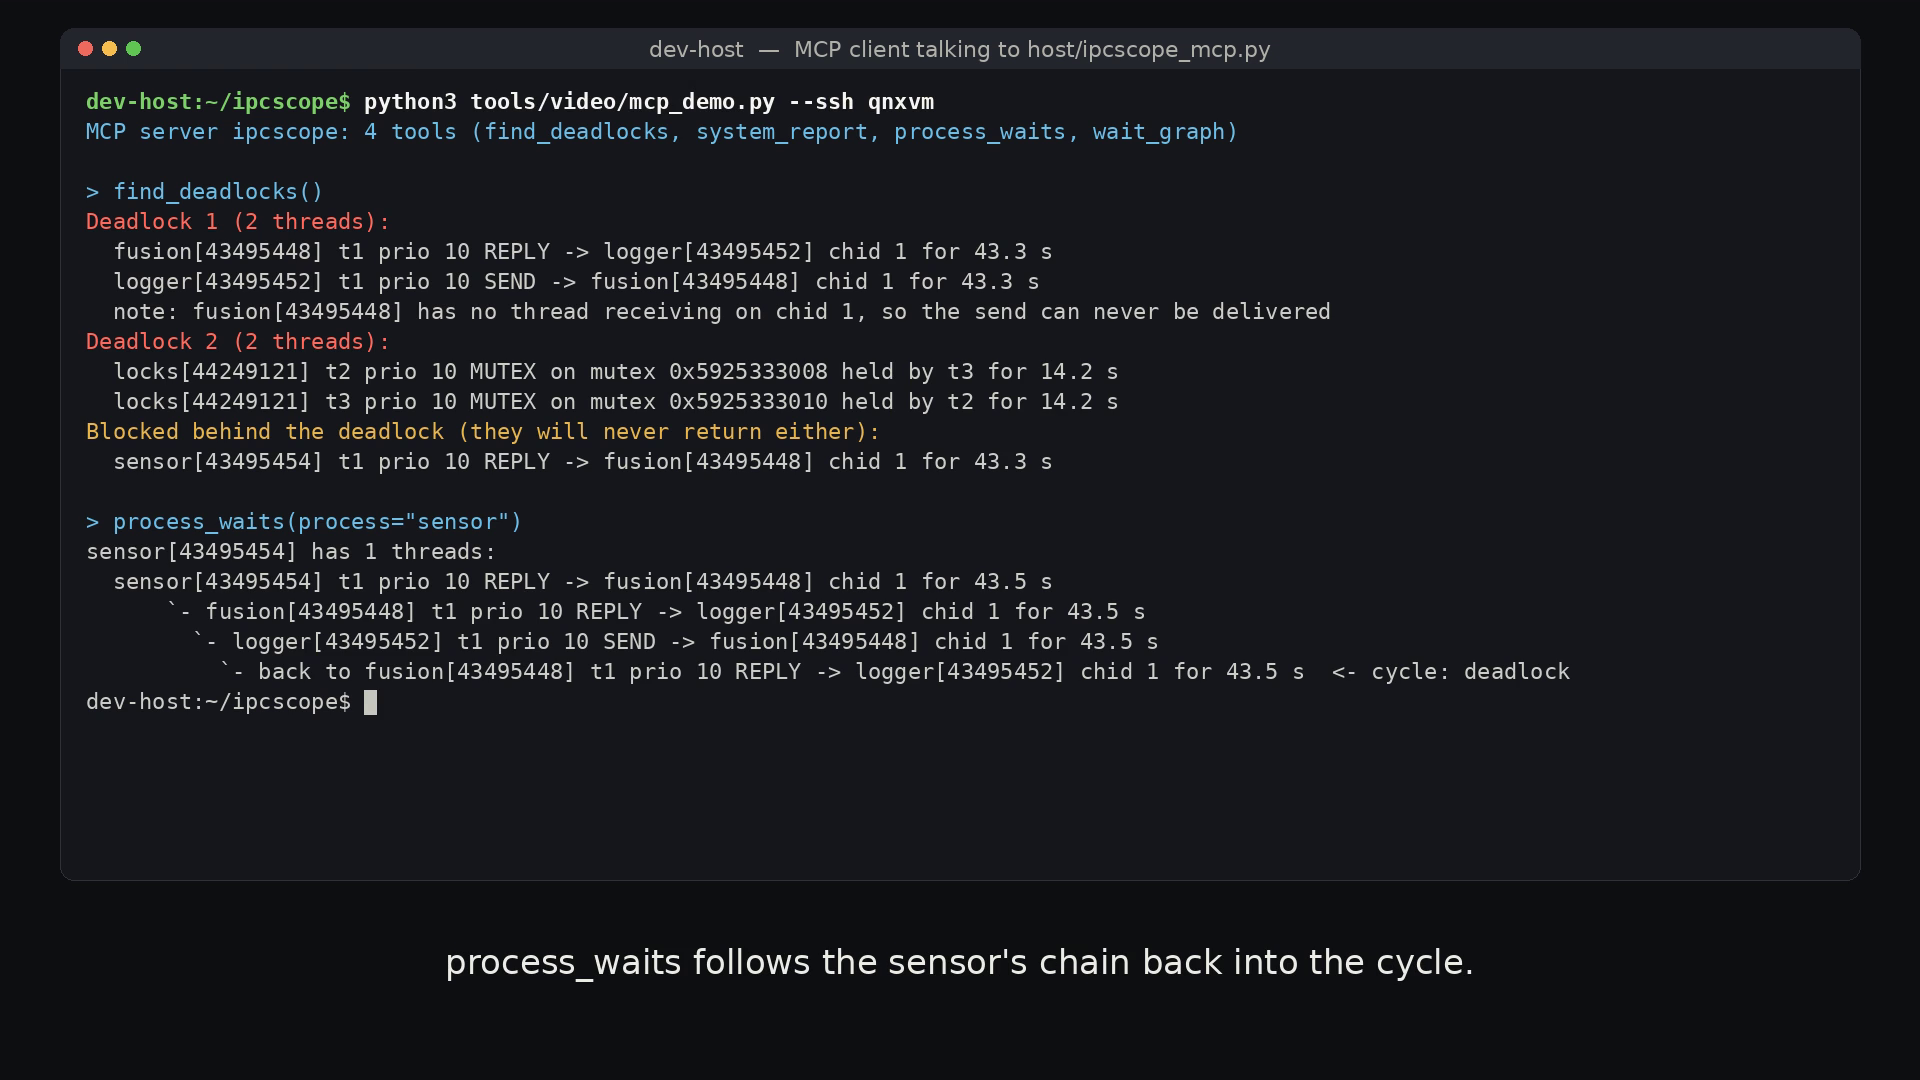
ipcscope -qexits 2 when a deadlock exists, so an integration test can fail the build. - Host side: a live browser view of the wait graph (cycles in red, blocked-behind in amber), a terminal watch over ssh, and an MCP server. An AI assistant can ask the target
find_deadlocksorprocess_waits("sensor")and get the real chain back.
How we built it
- C on QNX SDP 8.0 (qcc, GCC 12.2.0), tested on an x86_64 QNX 8.0 image from
mkqnximageunder QEMU 8.2 with KVM. It also cross-compiles for aarch64le. - Snapshot: for every process,
devctl(DCMD_PROC_TIDSTATUS)on/proc/<pid>/ctlreturns each thread's state,nsec_since_blockand its blocking target:blocked.connect.pid/chidfor SEND/REPLY;blocked.channel.chidfor RECEIVE;blocked.sync.idfor MUTEX.
- Mutex owners: we found that
blocked.sync.idpoints at the mutex's owner word. Reading that word through/proc/<pid>/asgives the owner aswaiting bit | (pid & 0x7fff) << 16 | tid, which turns mutex waits into thread-to-thread edges. - Analysis: an OR-model wait-for graph:
- A SEND edge exists only if no server thread is receiving on that channel.
- A REPLY edge points to the server threads that are not idle.
- A MUTEX edge points to the owner.
- The stuck set is a greatest fixed point: a thread that any running, ready or receiving thread could release is never reported.
- Deadlocks are the strongly connected components (Tarjan) inside the stuck set.
- Resource manager: the iofunc layer with a custom OCB that holds a per-open snapshot,
io_notifywithiofunc_notify_triggerfrom a watcher thread, and slog2 logging. - Host tools: Python. A small HTTP server with a D3 page, and an MCP server built on the official Python SDK (1.x and 2.x).
- Demos: processes that find each other with
name_attach()/name_open():- a sensor → fusion → logger pipeline with a callback deadlock;
- a slow database chain;
- a lock-order mutex deadlock.
Challenges we ran into
- Owner word encoding: the mutex owner is not a plain tid. We worked out the encoding by reading the owner word next to
pidin's output. - No false alarms: a snapshot walks
/procone process at a time, so it is not atomic. A naive cycle search reports transient waits. The stuck-set reduction and a blocked-time threshold fixed that: no false positive on the healthy pipeline in our runs. - The QEMU image: its OpenSSH needs
/usr/libexec/sshd-auth, which our mkqnximage version leaves out. Twolocal/snippetslines fix it (documented in the README). - Missing libc pieces: QNX libc has no
open_memstream, so reports render throughtmpfile()with a/dev/shmemfallback.
Accomplishments that we're proud of
- One command, three answers:
cat /dev/ipcscope/reporttells "deadlocked", "blocked behind a deadlock" and "just slow" apart, for any user. - Event-driven: an alarm that costs nothing until a deadlock happens. The waiting client sits in SIGWAITINFO, and the alarm fires about a second after the threshold.
- A codelab that goes from SEND/RECEIVE/REPLY basics to finding, fixing and regression-testing a real message-passing deadlock.
What we learned
The kernel already knows exactly who every blocked thread is waiting for. A resource manager is the natural way to share that knowledge safely, and iofunc_notify makes a file into an event source with very little code. The design rule from the codelab: never call synchronously back up a chain of senders. Push the data, or use a pulse.
What's next
- Run on Raspberry Pi 4 / aarch64 hardware.
- Track pulses and asynchronous messaging.
- Add priority-inversion hints (a high-priority client behind a low-priority server chain).
- Optional integration with a watchdog or High Availability Manager (restart on deadlock).
Links
- Repository: https://github.com/CVasilopoulos/qnx-ipcscope
- Codelab: https://github.com/CVasilopoulos/qnx-ipcscope/blob/main/docs/codelab.md
AI-assisted, human-directed.
