-
screenshot
Inspiration
I wanted to make the people behind open-source software more visible. The orchestra metaphor comes from my experience as a conductor: you notice each part most when it goes wrong.
What it does
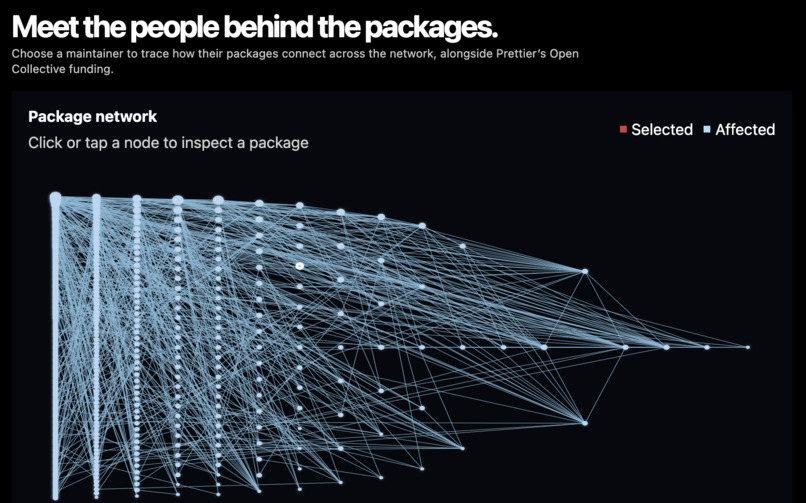
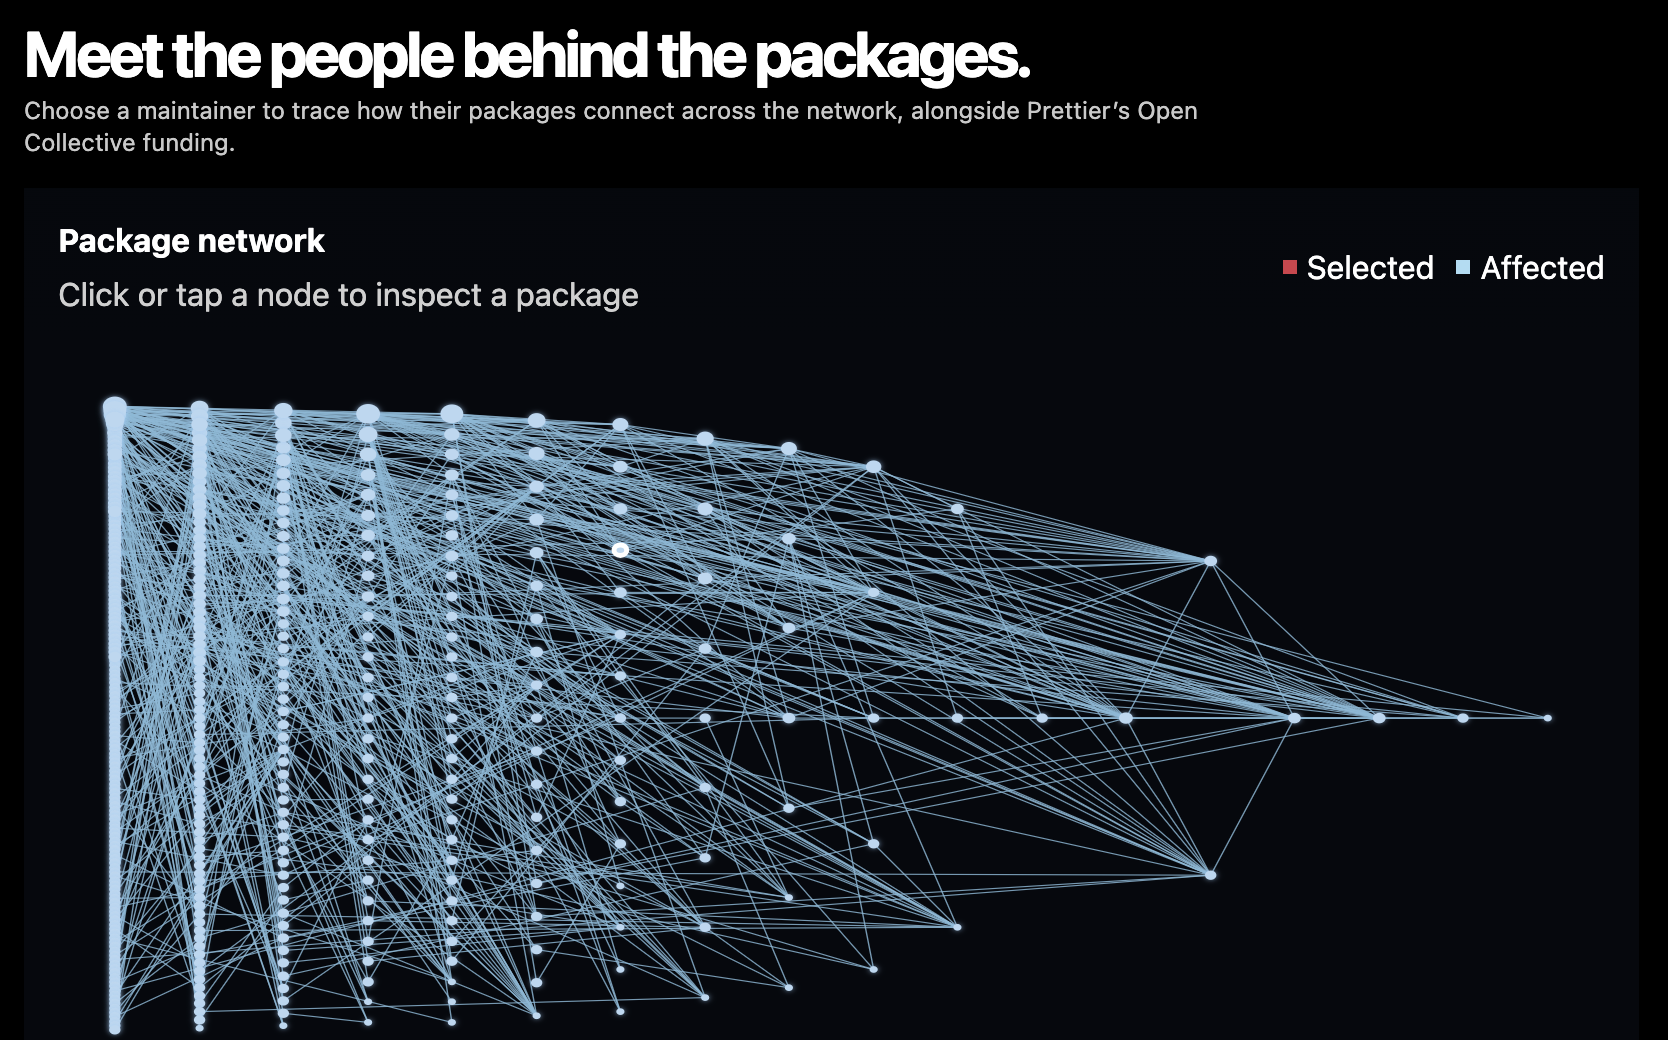
I built an interactive npm dependency map. You can select a maintainer and see a simulated cascade through the network, alongside a live weekly download count for one package.
How I built it
I used Python to serve the app and build a package graph from an npm snapshot. The app fetches download counts from npm’s public API and visualizes dependency changes.
Challenges I ran into
I had to make the graph understandable while explaining its limits: it’s a snapshot, and the cascade is a simulation, not an outage prediction.
Accomplishments I’m proud of
I turned an abstract dependency network into something people can explore and connected it to the maintainers behind the software.
What I learned
I learned to distinguish snapshot data, live metrics, and simulations—and explain what each can and can’t show.
What’s next for Invisible Hero
I want to refresh the dependency data, test the experience with new users, and explore an AI feature that explains its evidence and uncertainty.
Built With
- codex
- python
