-
-
INVISIBLE FRICTION
-
OVERVIEW
🏆 Project Title
Invisible Friction Index
💡 Inspiration
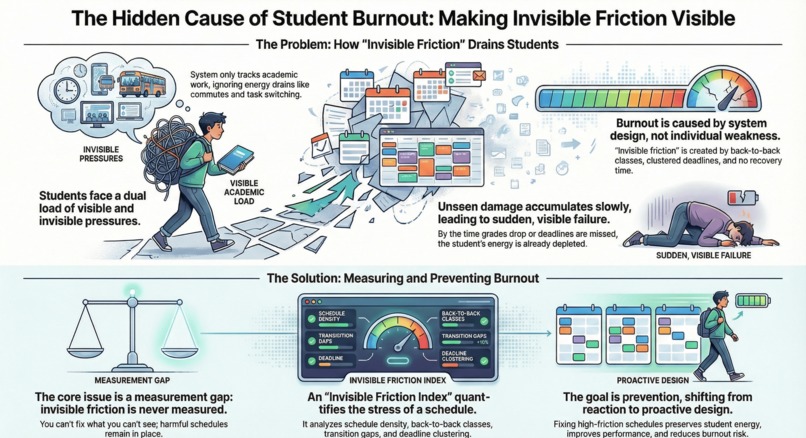
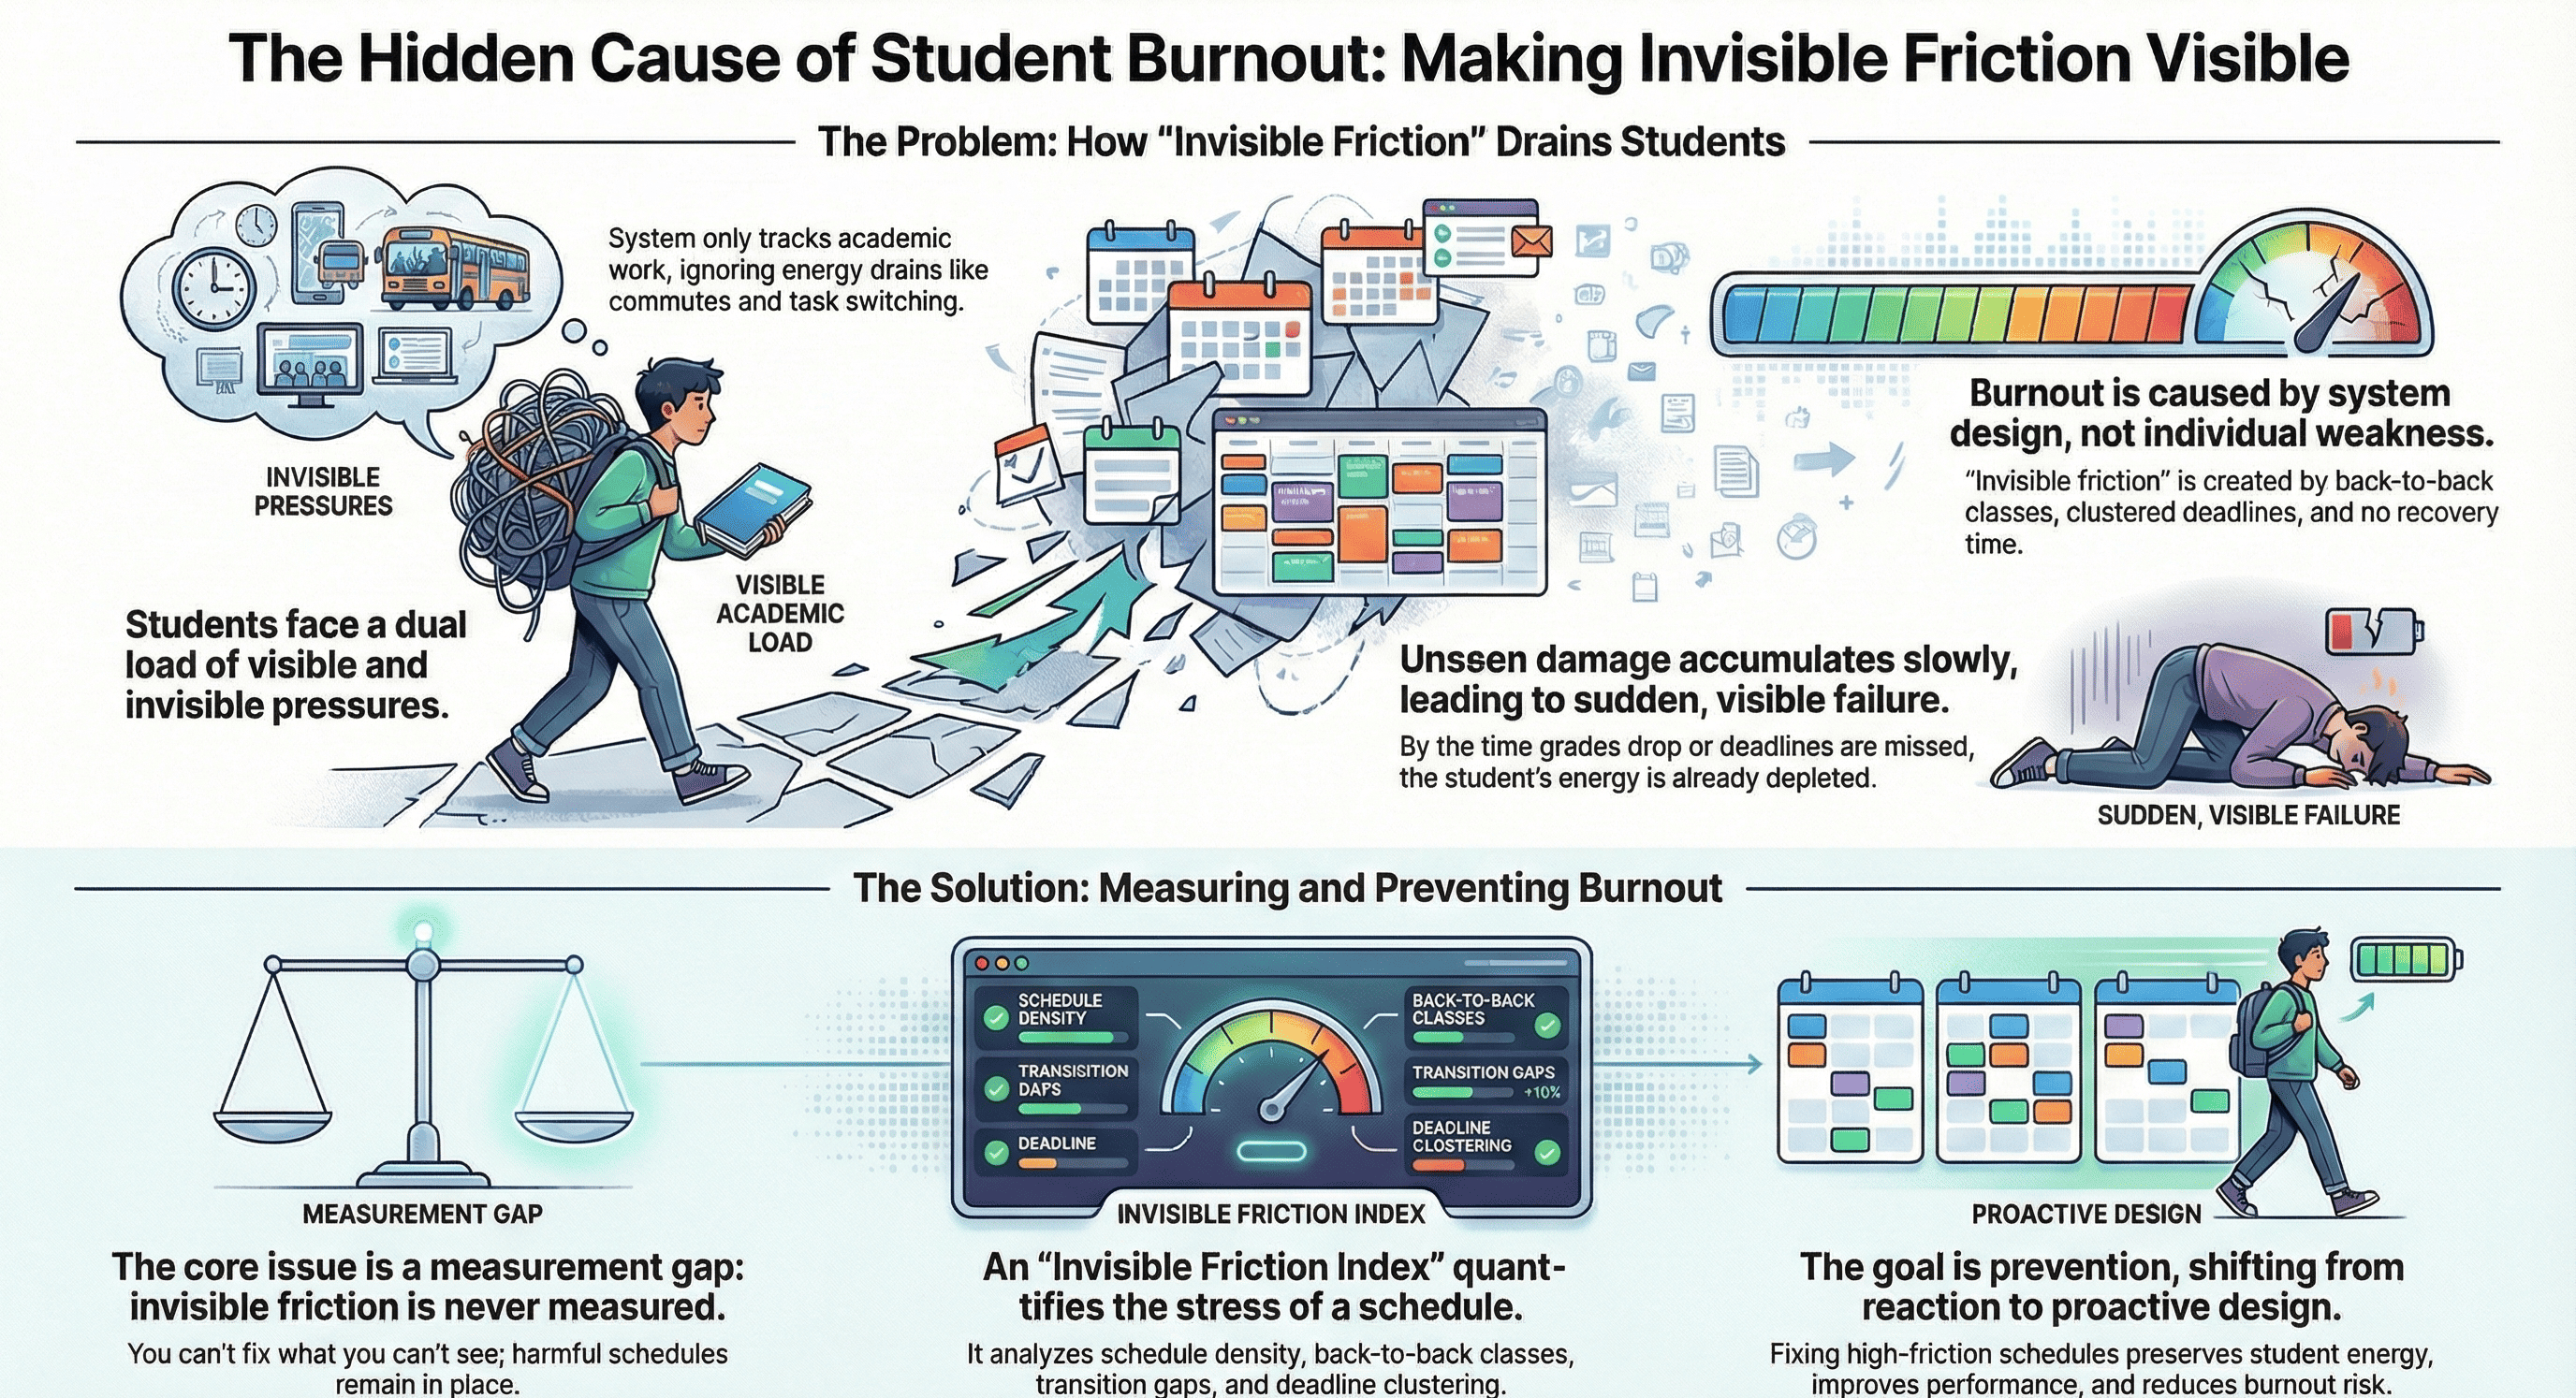
Capable students don’t fail because they lack motivation or ability — they fail because academic systems silently overload them.
Most educational analytics focus on students: predicting who is “at risk,” monitoring behavior, or recommending counseling after performance drops. That framing is flawed. It treats burnout as an individual weakness instead of a design failure.
We were inspired to flip the lens.
Instead of asking “Which student is failing?”, we ask: “Which academic designs are unsafe?”
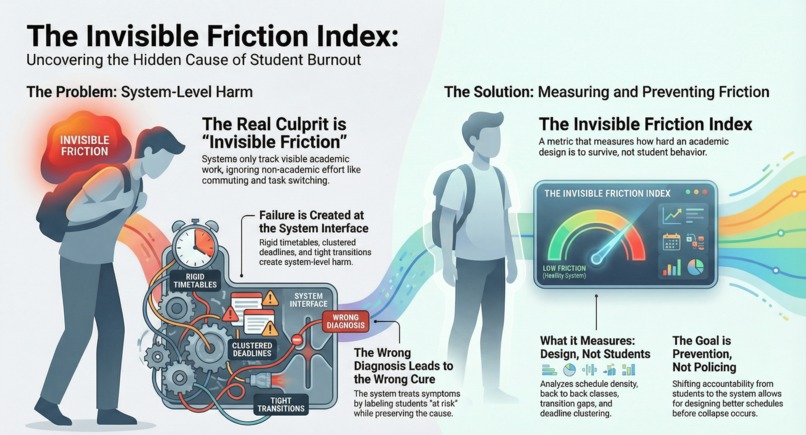
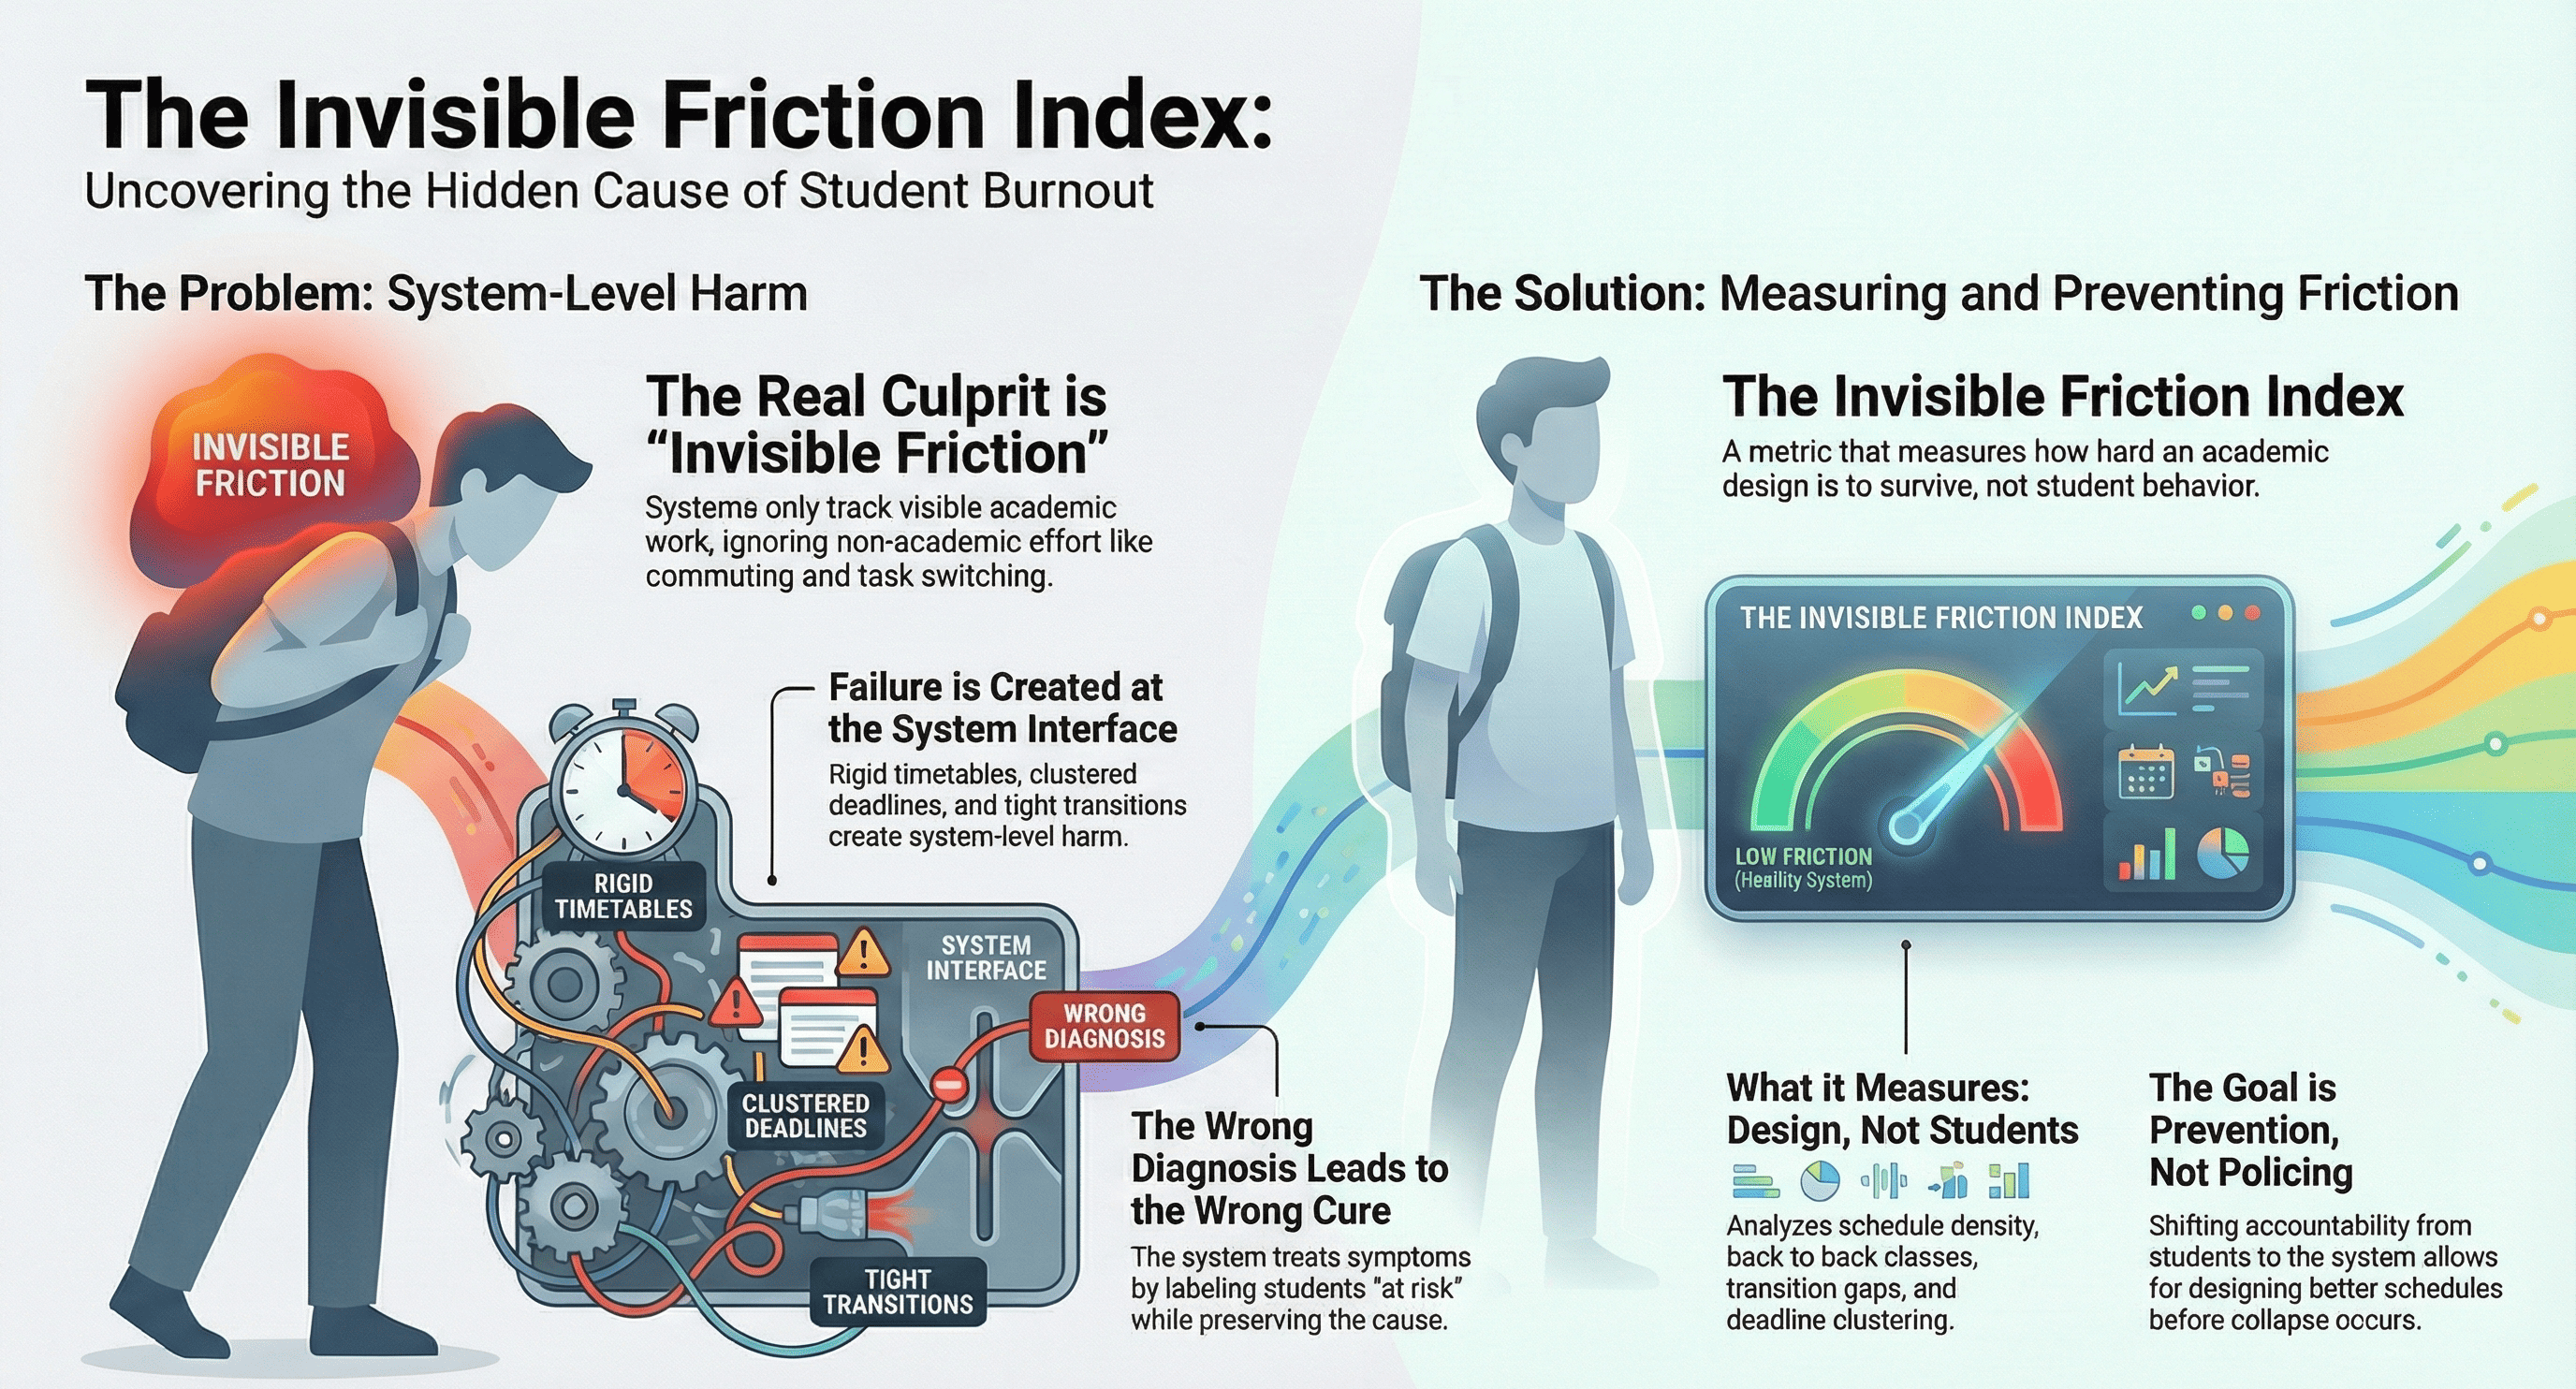
The Invisible Friction Index was built to expose the hidden, unmeasured workload pressure created by timetable density, rigid scheduling, and clustered demands — long before burnout becomes visible.
🚨 Problem
Academic systems impose invisible friction on students:
Back-to-back classes with no recovery
Compressed daily schedules
Clustered deadlines
Rigid early + late scheduling
This friction:
Is not graded
Is not tracked
Is not measured
Yet it steadily drains energy, reduces learning quality, and increases failure risk.
Current systems respond after collapse — with labels, monitoring, or counseling — while leaving the underlying design unchanged.
There is no standard way to measure design-level academic friction.
🛠️ What It Does
The Invisible Friction Index is a system-level analytics tool that:
Quantifies academic design friction from schedule and workload proxies
Aggregates risk at the system level, not the individual level
Flags unsafe academic designs before burnout occurs
Suggests concrete design fixes, not student interventions
Instead of predicting “bad students,” it identifies bad designs.
⚙️ How It Works
Data Input Uses a public student performance dataset (Kaggle / UCI) as a proxy environment.
Friction Feature Engineering We engineer timetable-like design signals:
Schedule density
Back-to-back intensity
Deadline clustering
Temporal rigidity
Invisible Friction Index These features are normalized and combined into a single friction score representing how difficult a schedule is to survive — independent of student intent.
Risk Band Mapping Friction scores are mapped into:
🟢 Survivable
🟡 Warning
🔴 Unsafe
Validation (Ablation Study) We compare:
A baseline model (individual covariates only)
The same model plus the friction index
The model with friction consistently performs better, showing that design-level stress carries independent predictive signal.
Interactive Demo A Streamlit dashboard visualizes:
System-level friction distribution
High-risk design patterns
Automatic design fix suggestions
📊 Results
Average friction index clearly distinguishes survivable vs unsafe conditions
~60% of entries fall into Warning or Unsafe bands
Adding the friction index improves predictive performance over baseline models
Key insight: Even with a dataset not designed for scheduling analysis, academic design friction still emerges as a measurable risk signal.
🧠 Why This Is Different
Most education ML projects:
Monitor students
Predict failure after damage occurs
Reinforce blame on individuals
Invisible Friction Index instead:
Models the system, not the student
Measures untracked design harm
Enables preventive redesign, not reactive intervention
Avoids surveillance, mental health inference, or labeling
This is design forensics, not student profiling.
🔐 Ethics & Responsibility
What this model does:
Measures system-imposed academic friction
Identifies unsafe design patterns
What this model does NOT do:
No mental health diagnosis
No behavioral surveillance
No student labeling or grading decisions
Intended users:
Timetable designers
Academic planners
Institutional policy teams
The goal is safer academic design, not individual monitoring.
🧰 Tech Stack
Python
Pandas, NumPy — data processing
Scikit-learn — modeling & ablation
Streamlit — interactive dashboard
🚀 Future Scope
Apply to real institutional timetable data
Before/after design comparisons
Simulation of design changes
Deployment as a planning-time safety check
🏁 Final Note
Burnout is not a personal failure. It is often a design failure.
The Invisible Friction Index makes that failure visible — early enough to fix it.

Log in or sign up for Devpost to join the conversation.