Inspiration
We found it difficult to read the market. Keeping up with the news, connecting events, and understanding what’s happening takes a lot of time—and it’s nearly impossible to follow everything. So we imagined Investor OS: a platform that answers our market questions, addresses our concerns, and gets to know us so it can tailor its analysis to our investor profile.
What it does
Investor OS turns market research into an interactive investigation. It helps you:
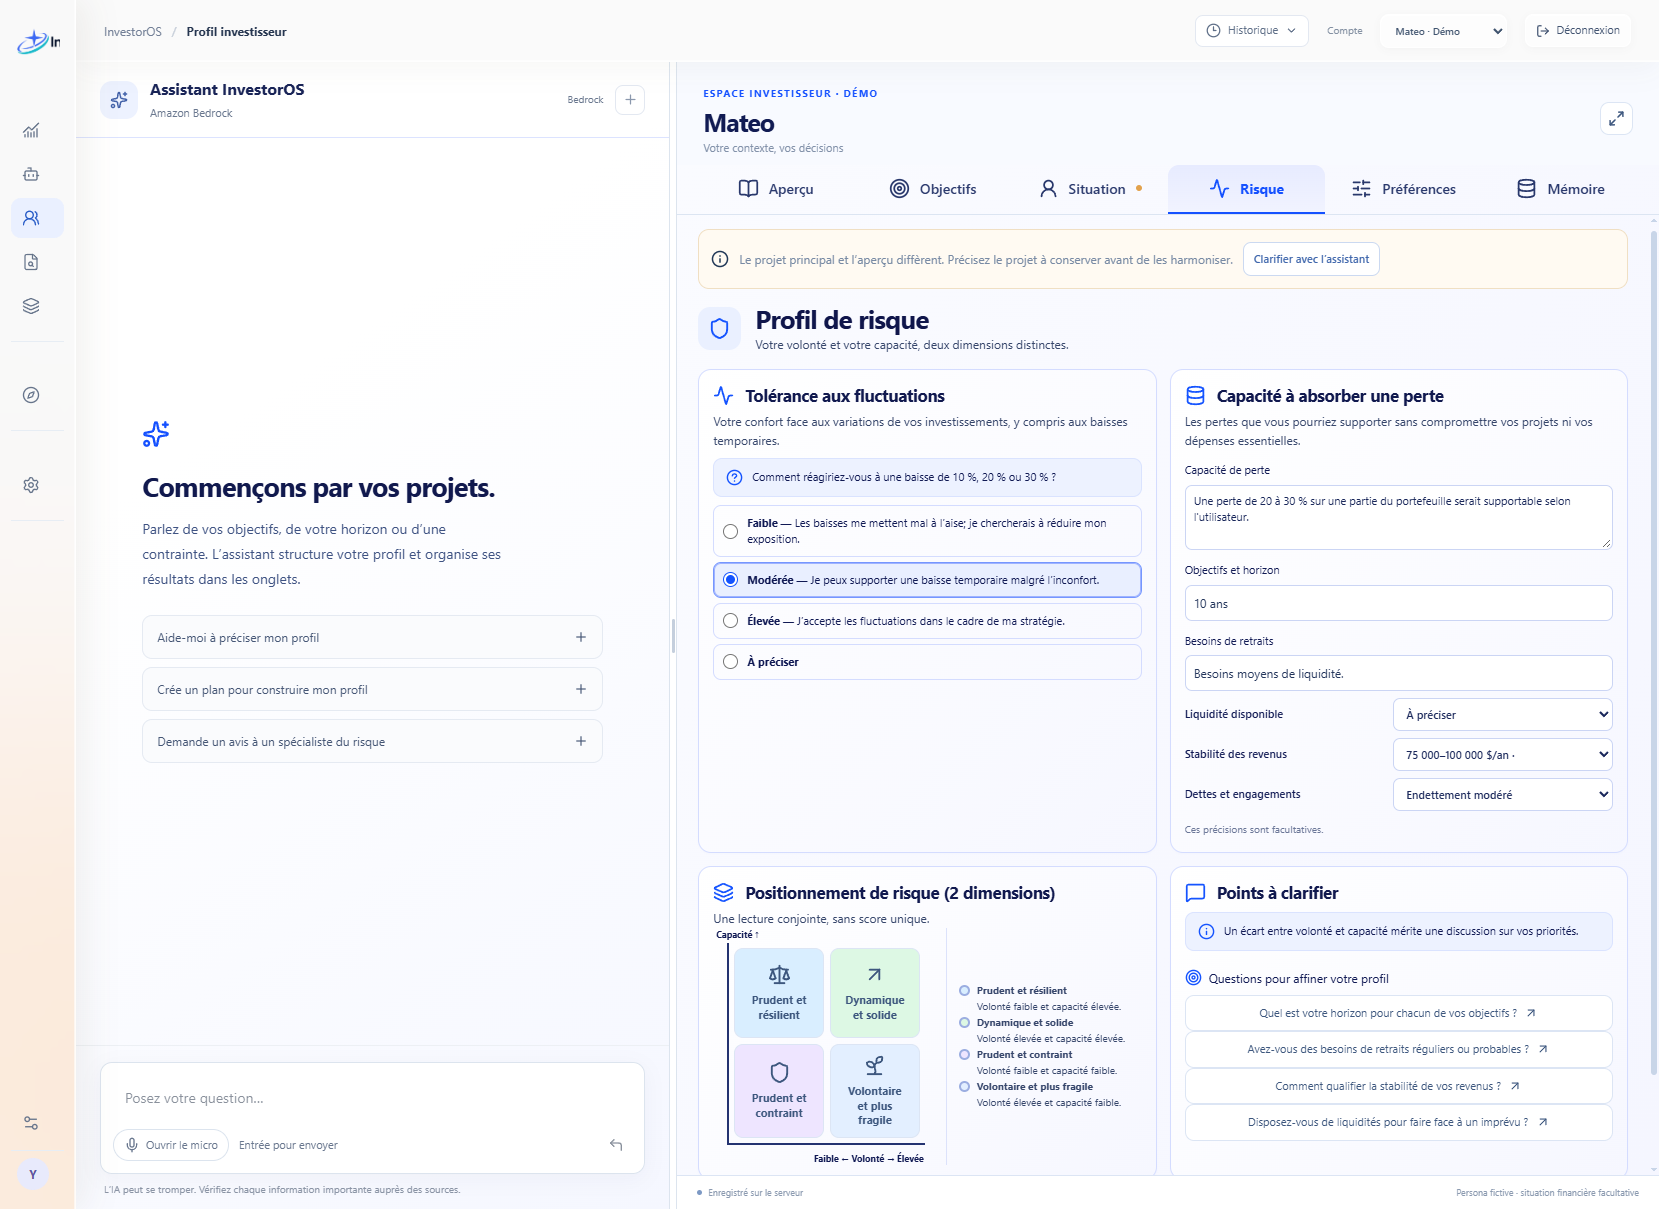
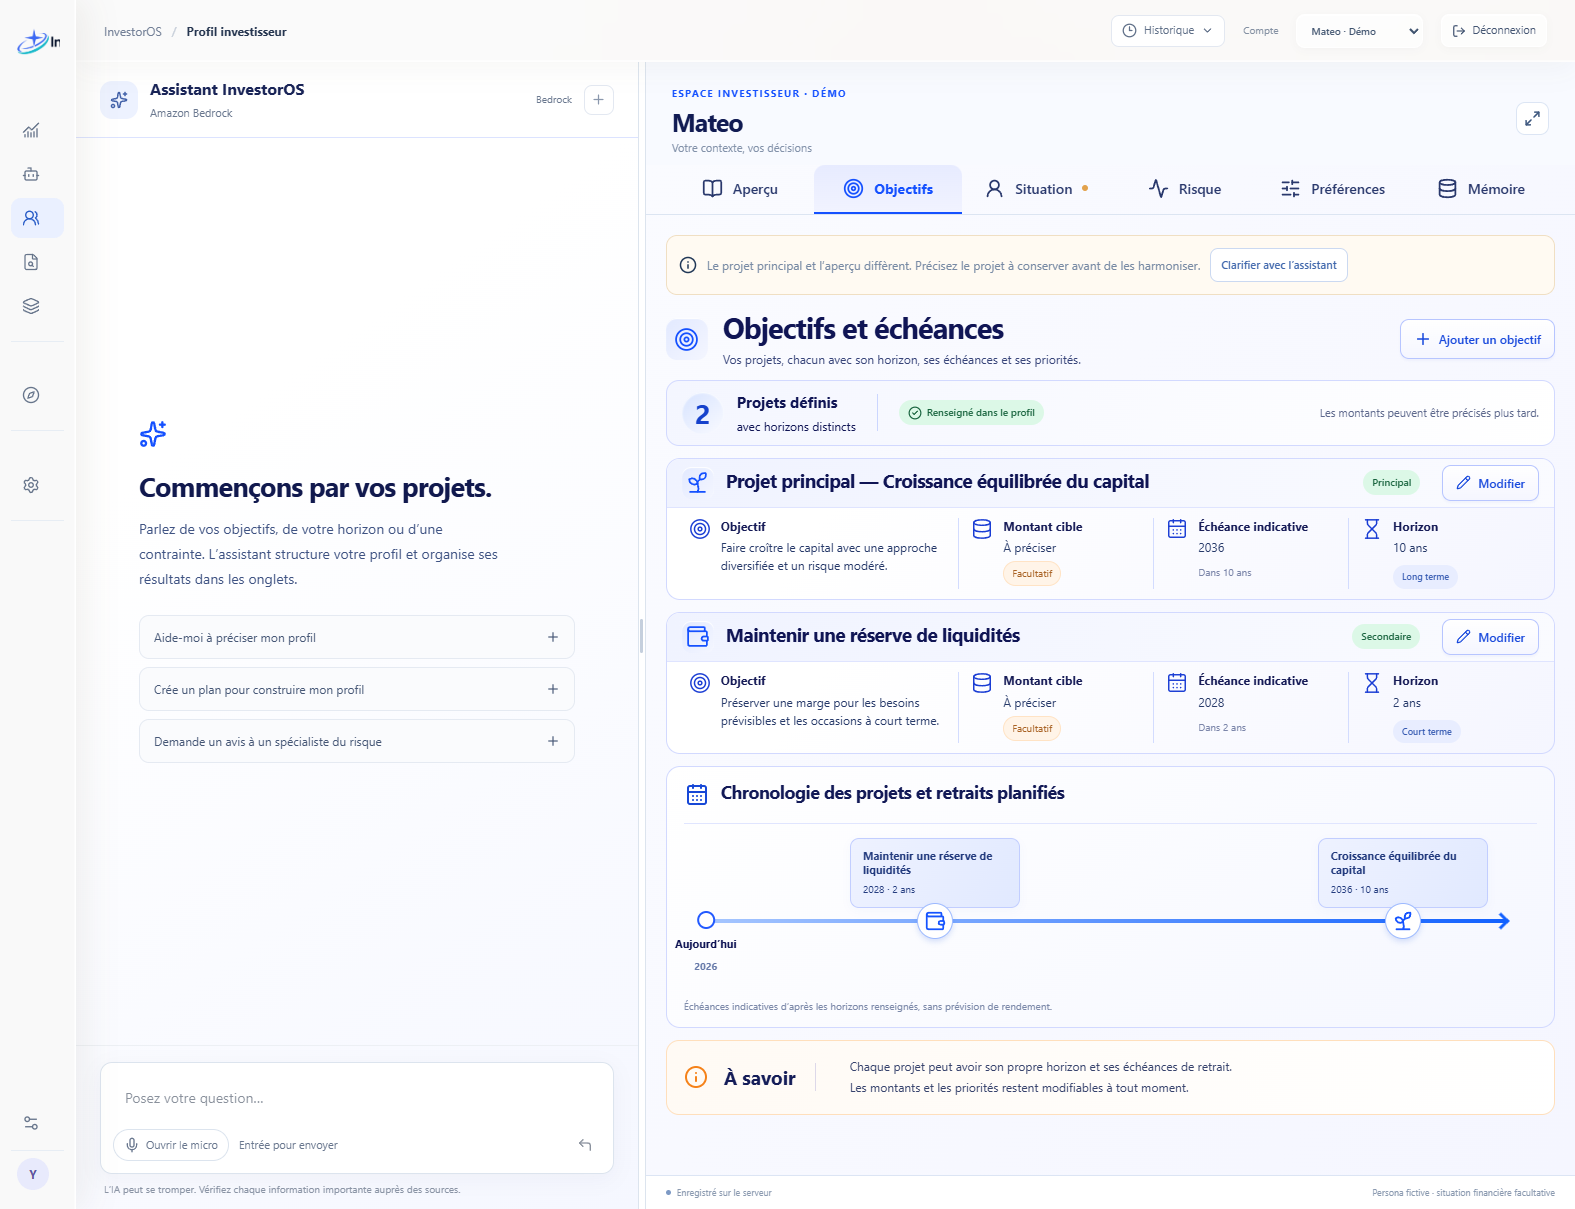
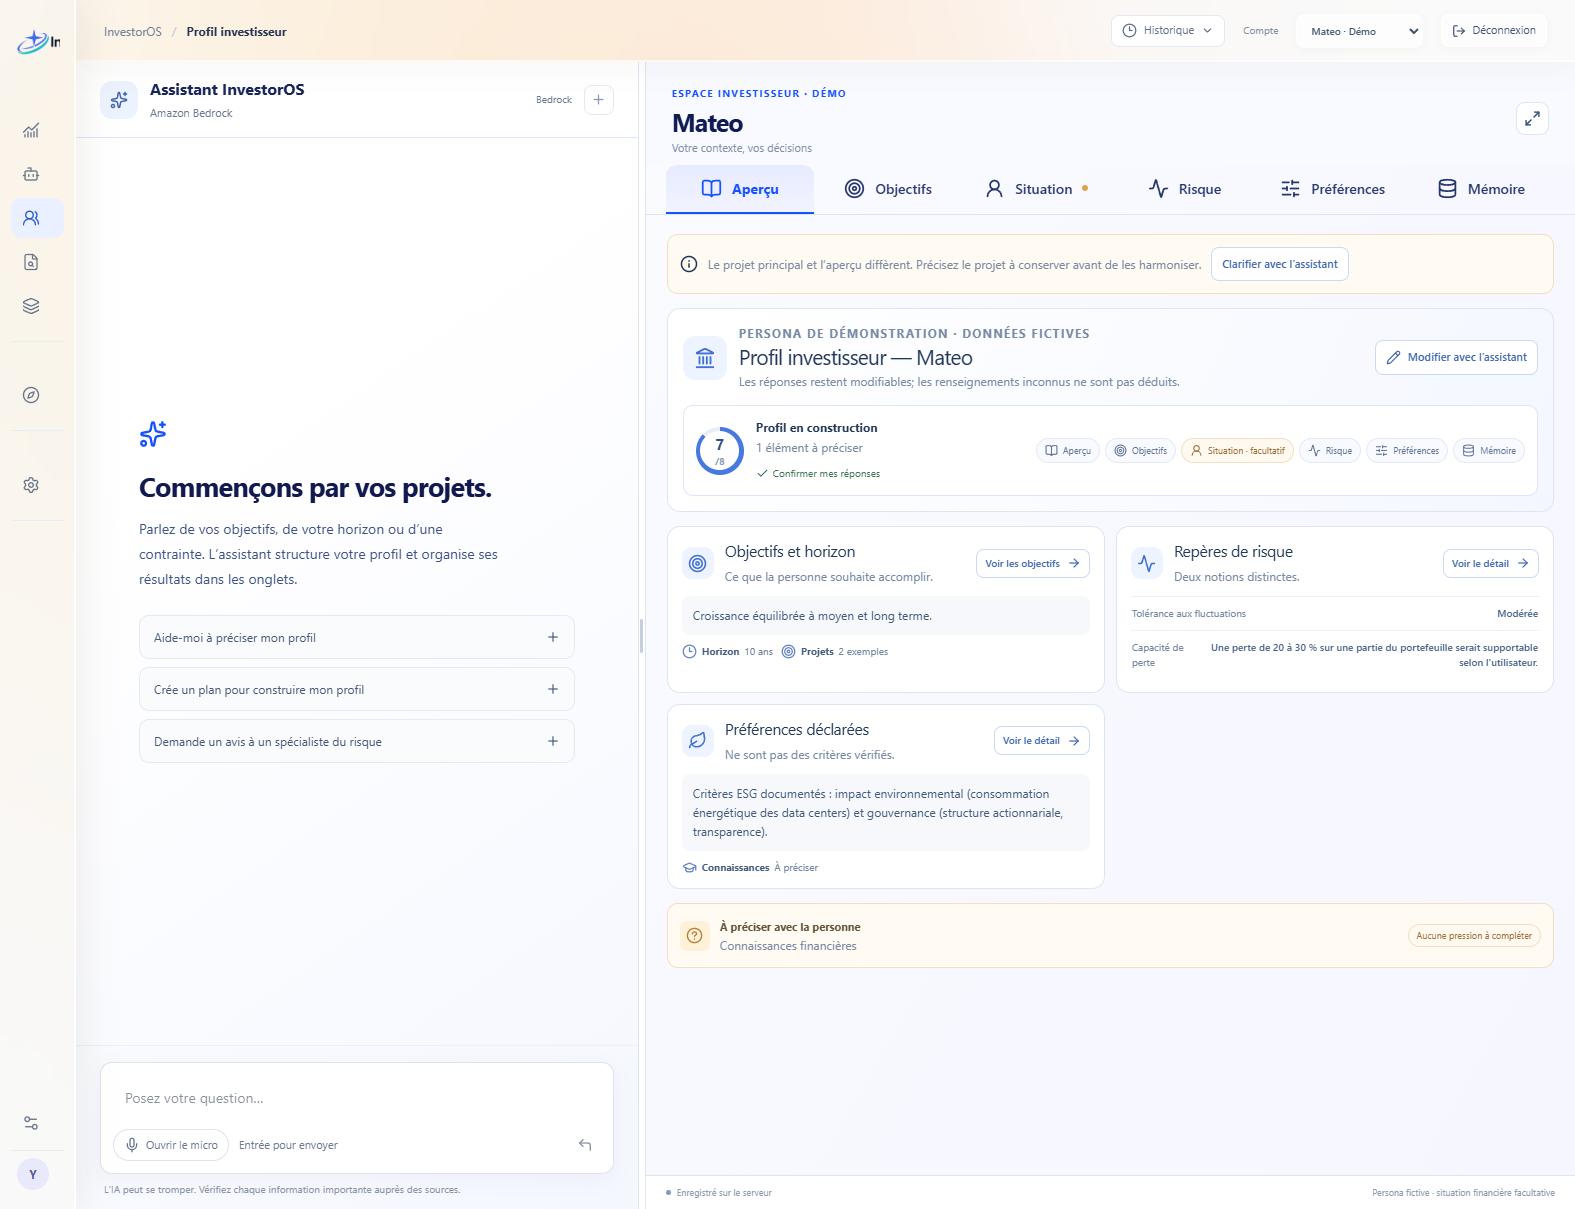
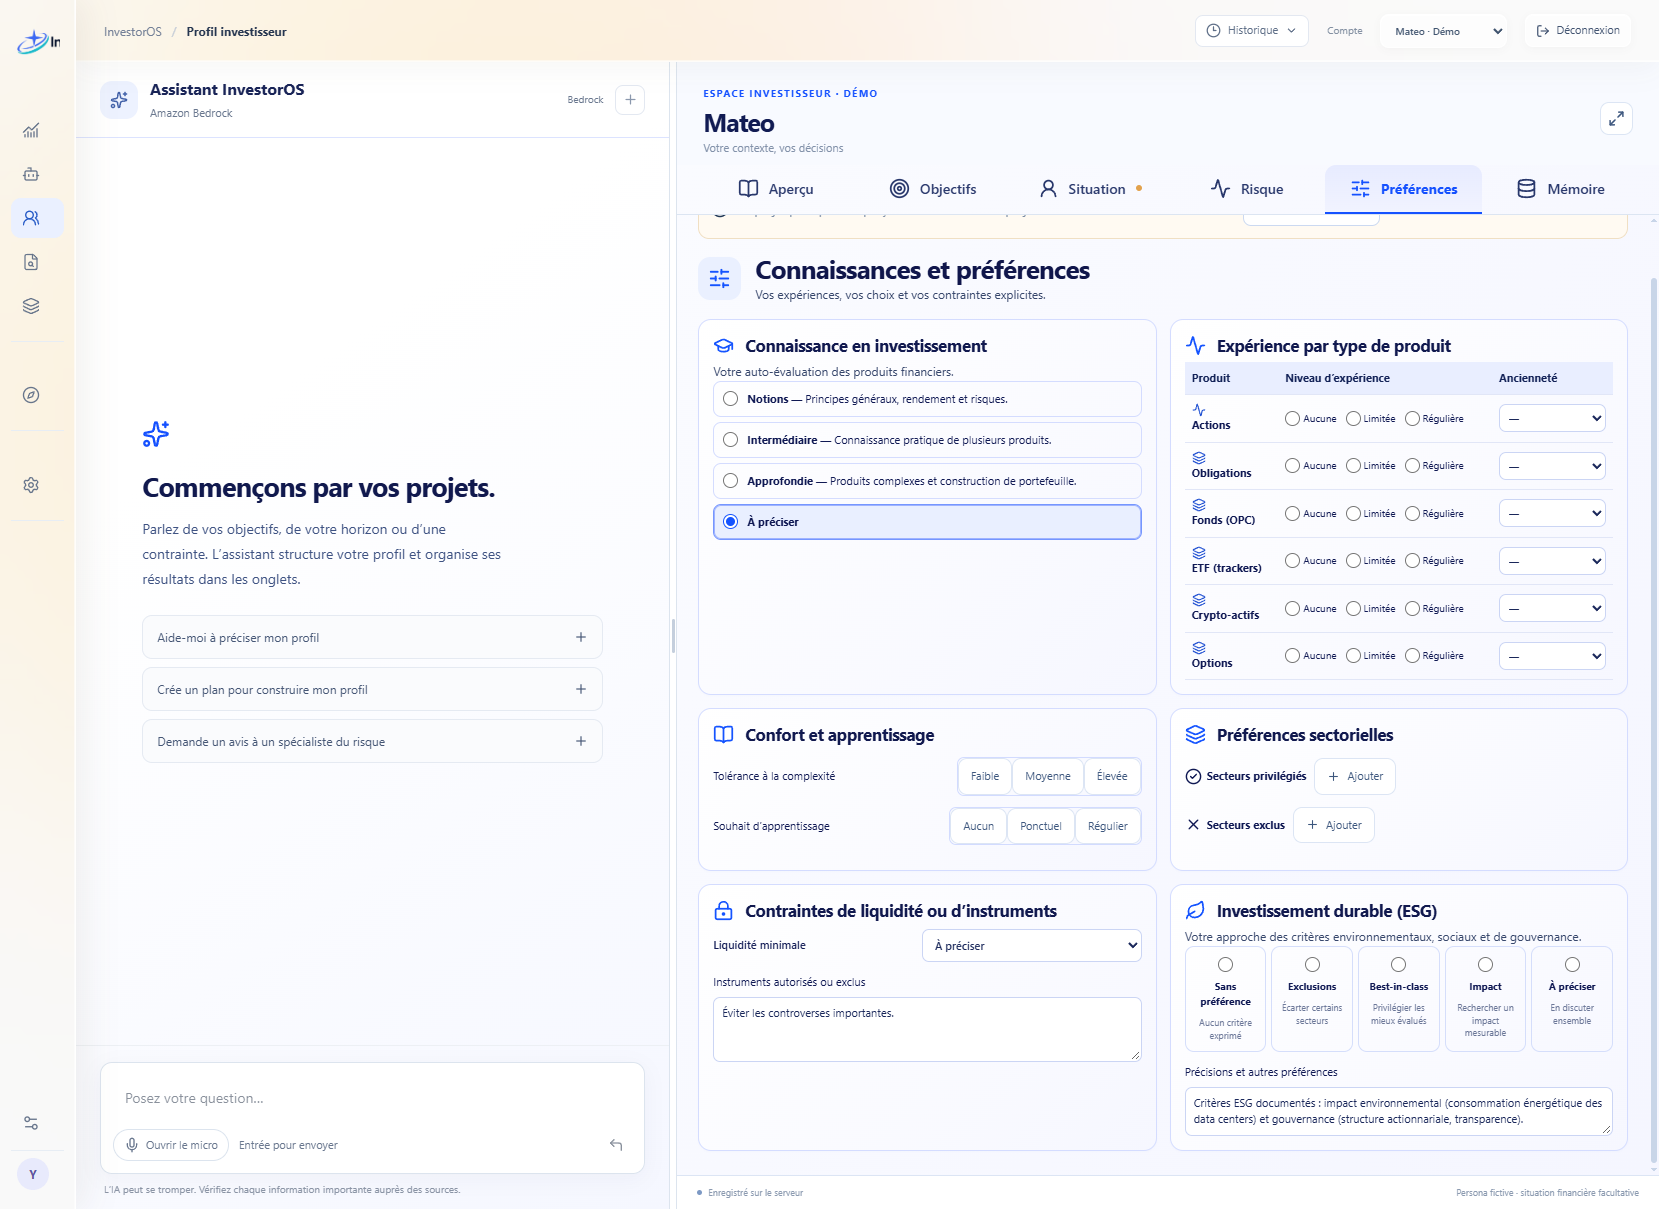
- Build and refine your investor profile by exploring your goals, time horizon, risk tolerance, experience, preferences, and concerns.
- Understand your investing habits by surfacing tensions between your goals, risk tolerance, and investment horizon.
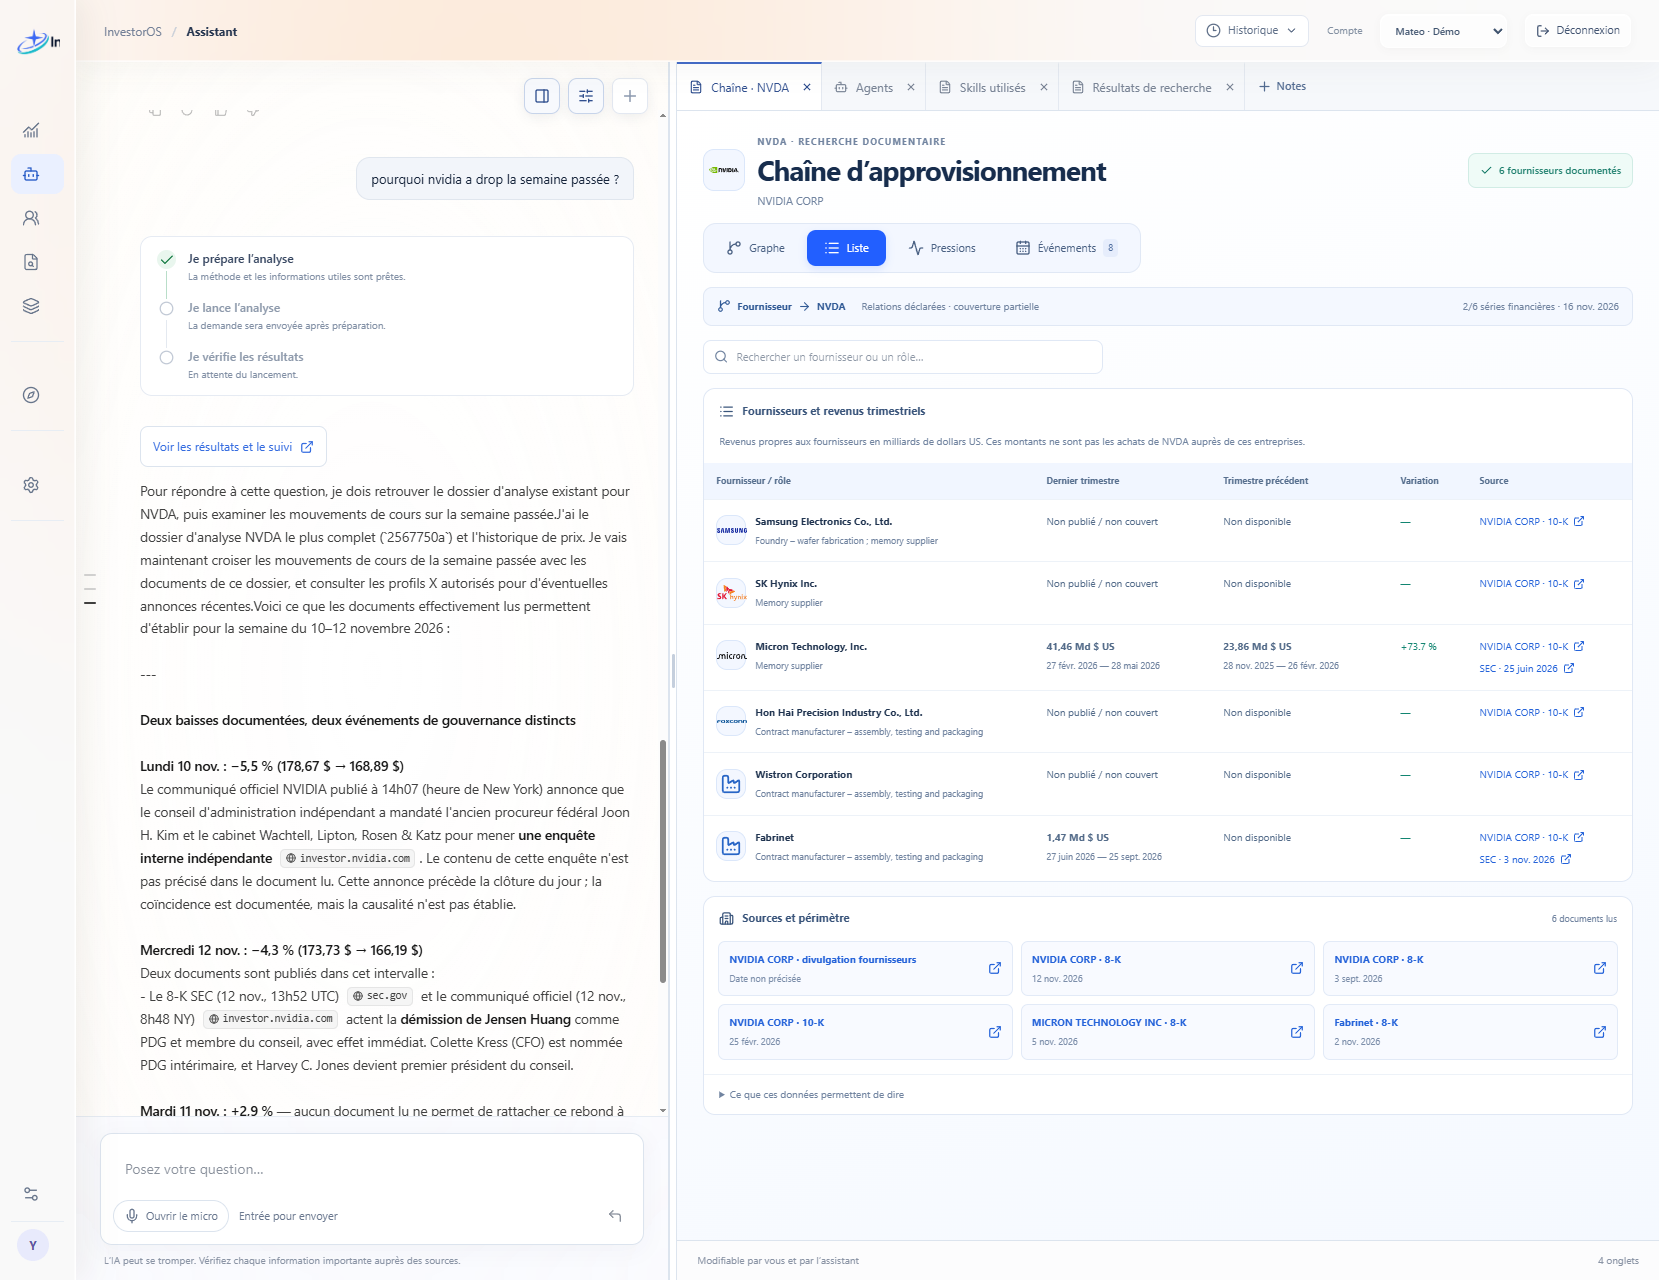
- Get answers to your questions and concerns through focused case studies tailored to what matters to you, so you can dive deep into the market.
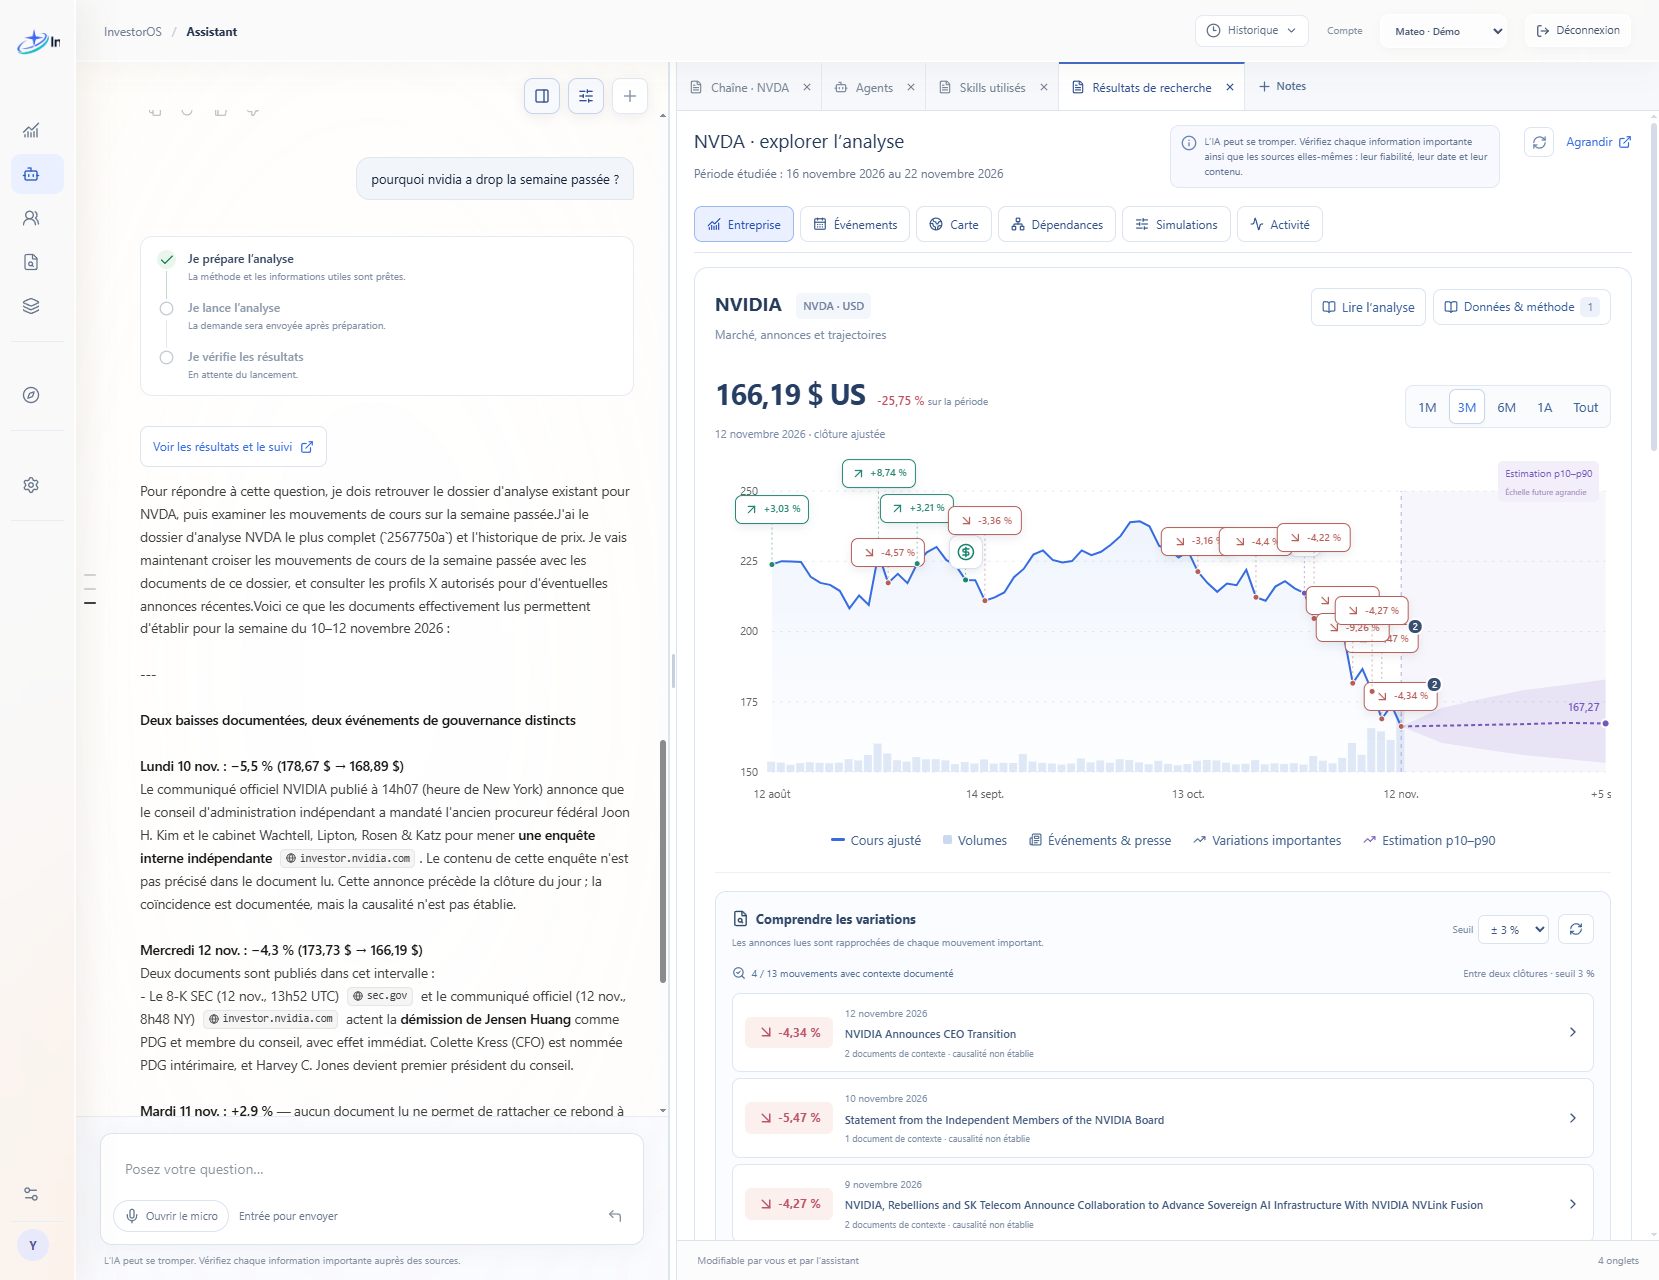
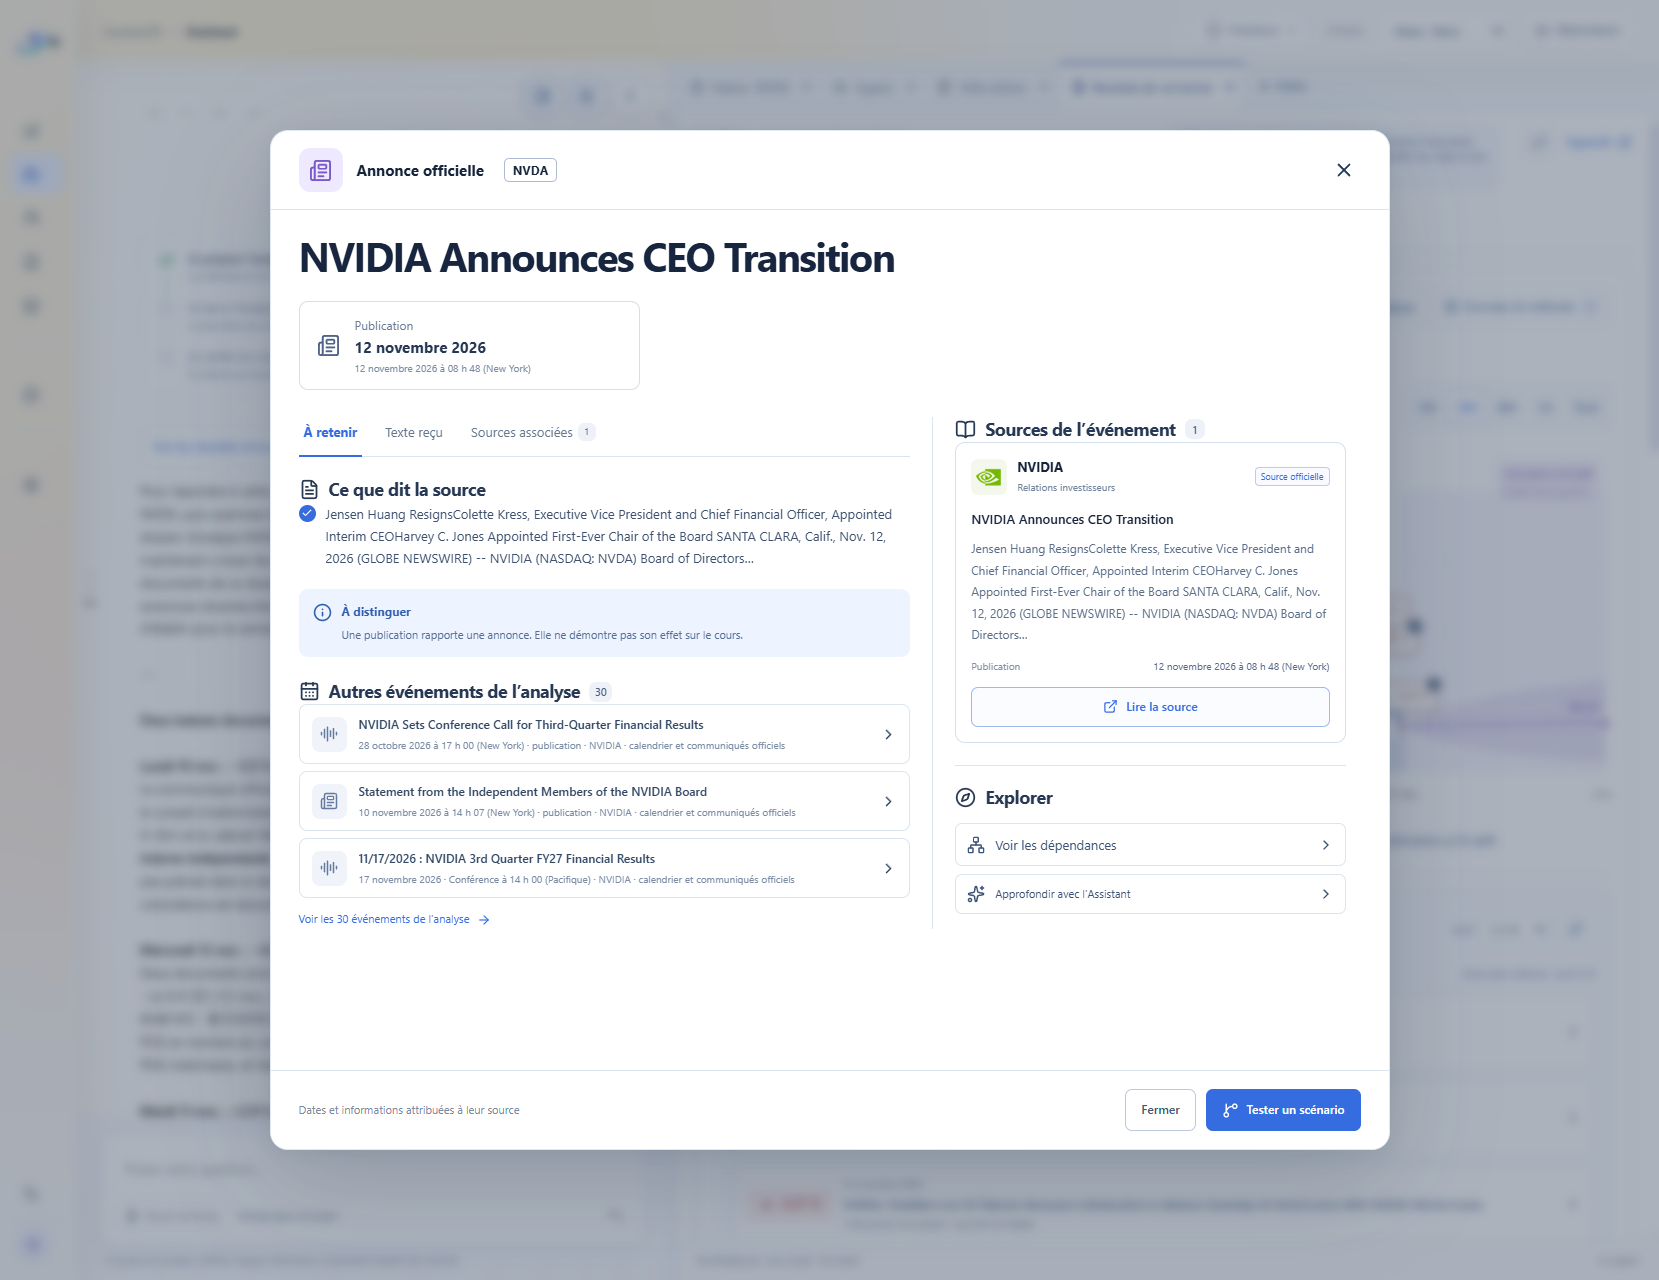
- Visualize market events on a chart and explore hypotheses about what may have driven each change—for example, comparing a price movement with a major announcement.
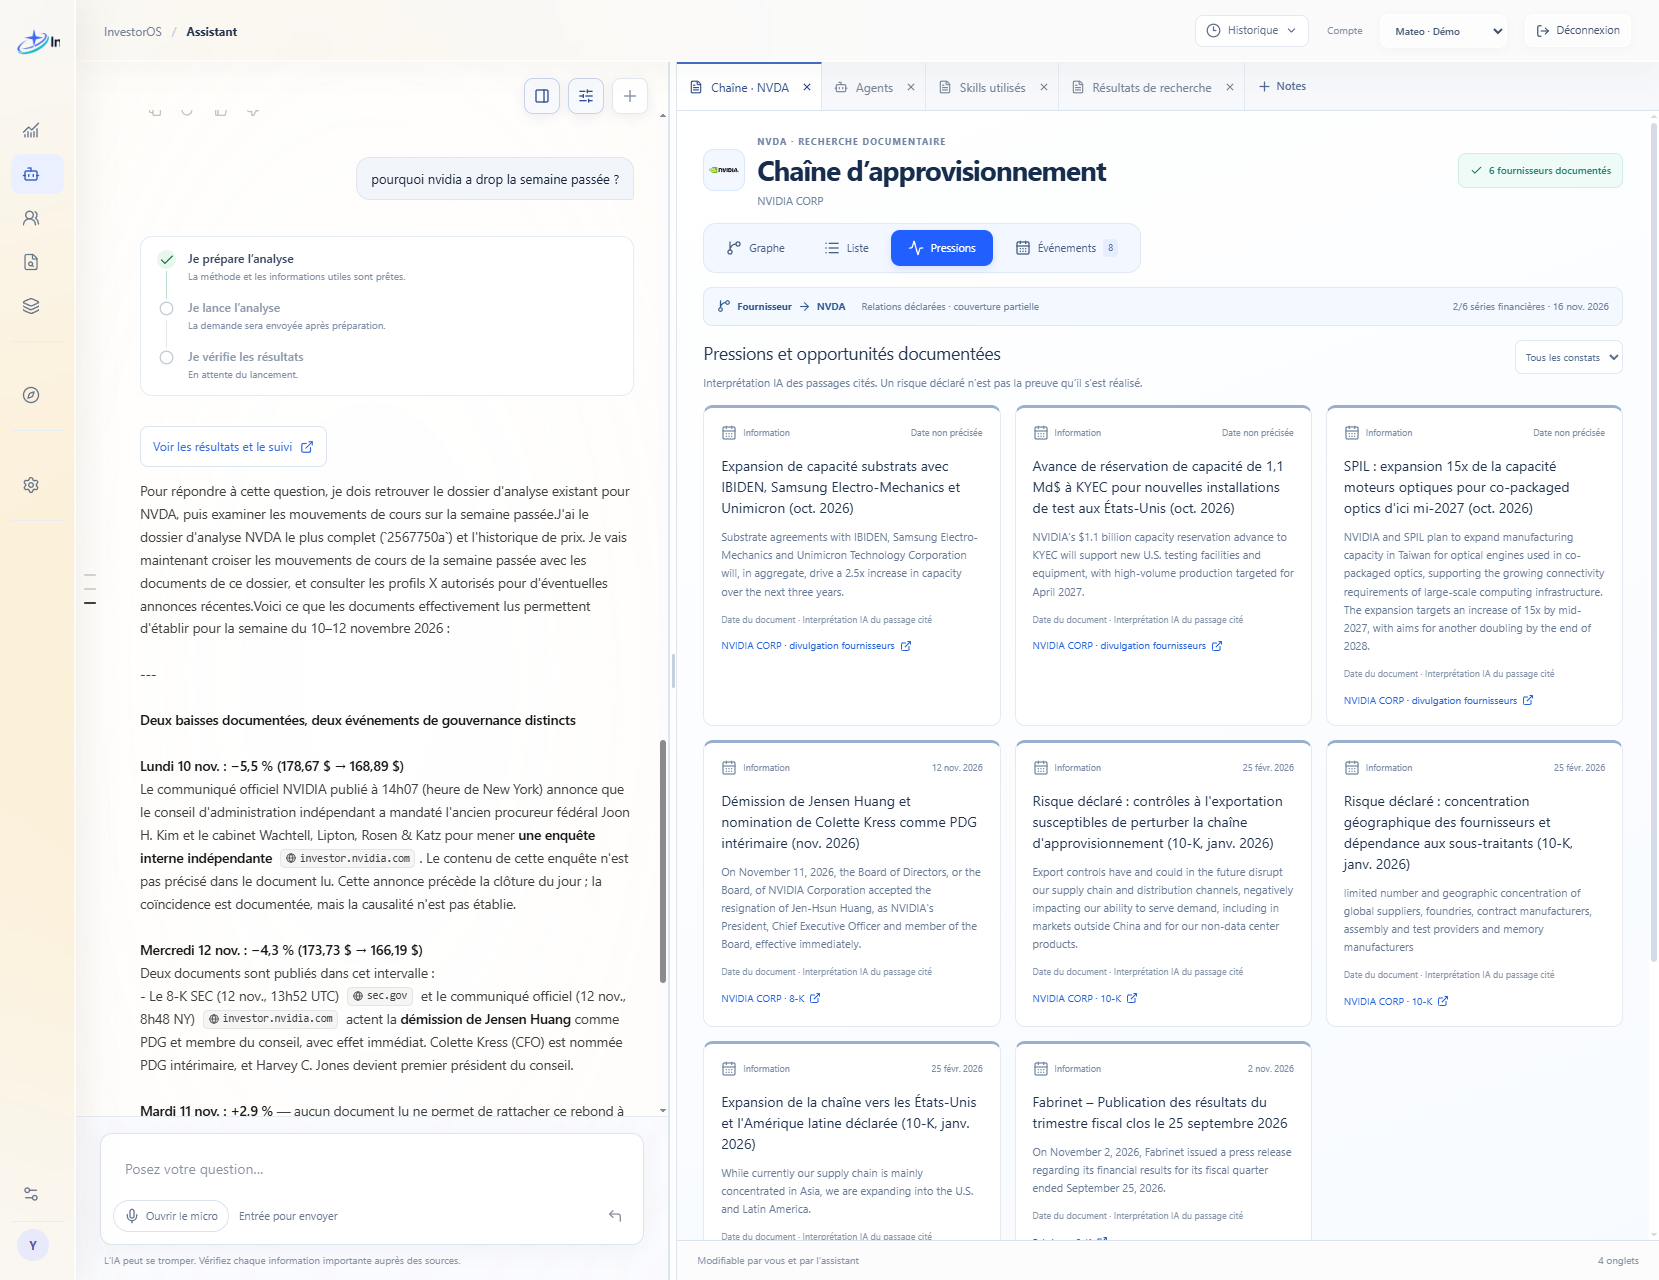
- Track economic, regulatory, and geopolitical pressures and explore how they may ripple through companies and supply chains.
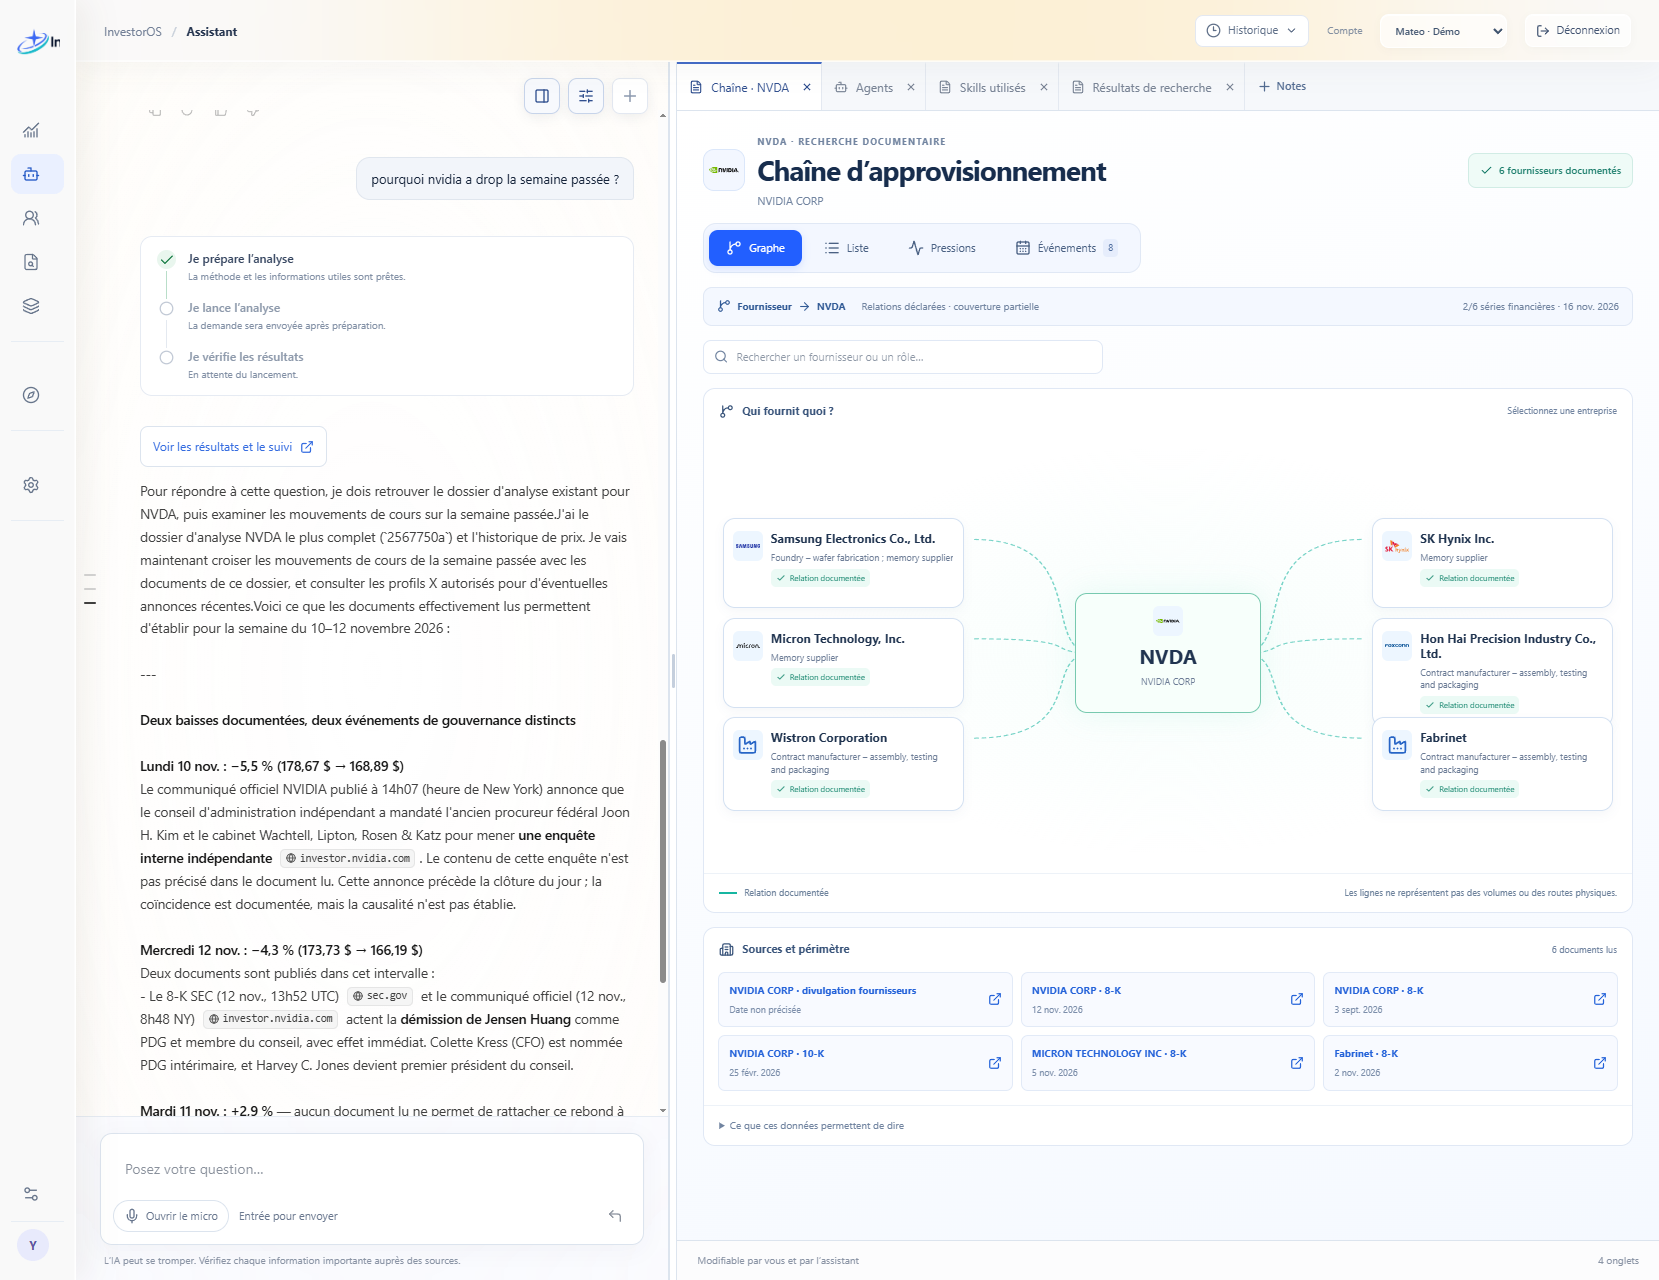
- Visualize supply chain connections to explore dependencies and potential areas of risk—for example, how disruption at one supplier could affect connected companies.
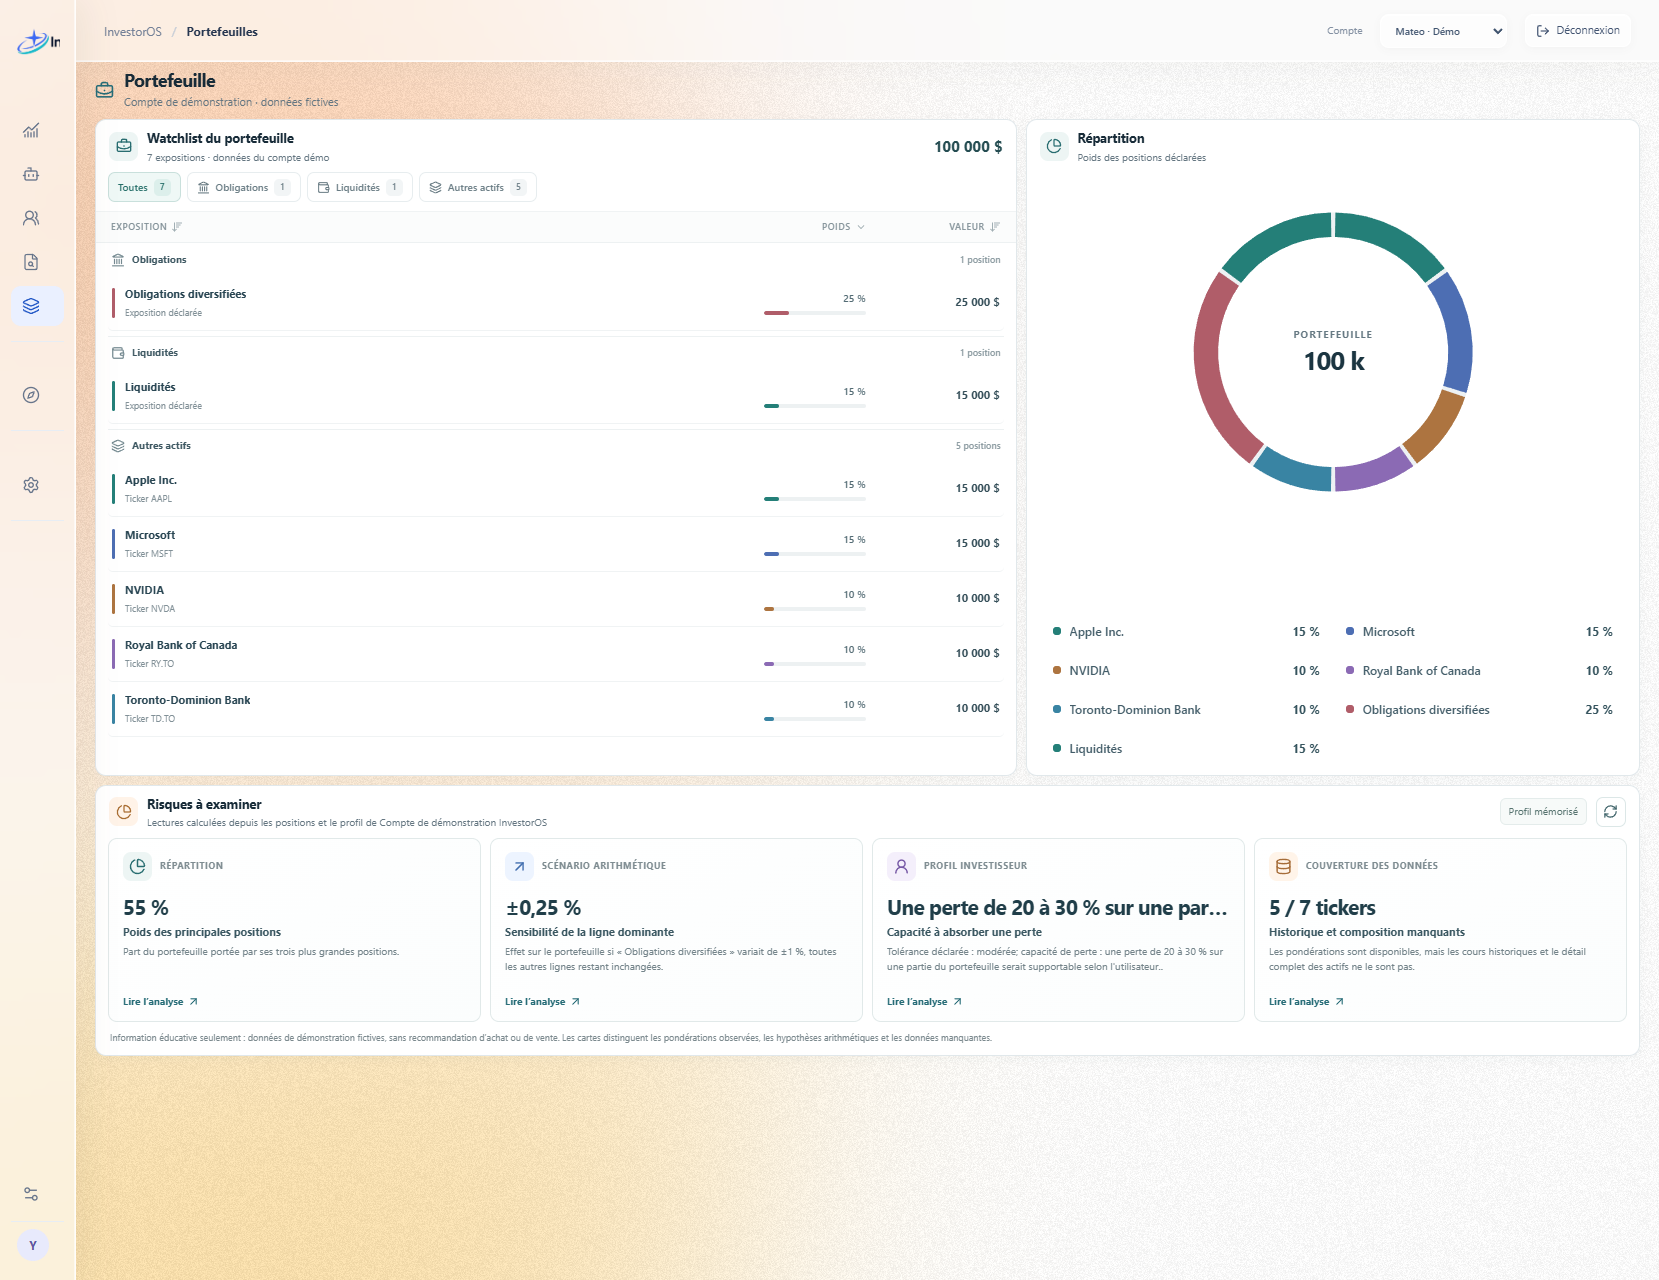
- Connect market movements to your portfolio and investor profile to explore why a development may matter to you.
- Explore “what if?” scenarios and inspect the sources, assumptions, and limitations behind each analysis.
Investor OS helps you connect the dots between events, market pressures, companies, and portfolios—not just keep up with headlines.
How we built it
- React, TypeScript, and Vite power the workspace: investor profiles, market charts, event studies, portfolio analysis, supply chain views, and scenarios.
- Python and FastAPI connect the interface to the research, profile, portfolio, and simulation systems.
- Amazon Bedrock powers the AI assistant and research agents. Agents plan investigations, use specialized tools, gather evidence, and build focused case studies.
- Amazon Bedrock Guardrails help protect AI conversations. Their filters can be tested and managed through the admin console.
- Amazon Bedrock AgentCore Browser lets research workers inspect authorized public web pages and provides a fallback when a structured source integration is unavailable.
- Step Functions, Lambda, SQS, and DynamoDB coordinate multi-step and asynchronous research and chat jobs, track progress, and handle retries and failed jobs.
- API Anything on ECS Fargate turns source discovery into reusable integrations: an agent can inspect a source with a browser, document how to access it, and create an API operation for future research agents. This avoids repeating browser discovery and is designed to reduce token use by up to 90% and make research at least 5× faster.
- Amazon Bedrock Knowledge Bases and S3 support document search and retrieval-augmented generation (RAG).
- Our research sources include SEC filings and company data, Yahoo Finance, Bank of Canada and FRED data, public X posts through the official oEmbed interface, and configured news and regulatory sources.
- Cognito and API Gateway handle authentication and API routing; CloudFront and S3 deliver the web app.
- Amazon Transcribe has a custom French-Canadian financial vocabulary prepared for voice recognition. The current app microphone uses browser speech recognition.
- CloudWatch provides logs and alarms, and Terraform defines the AWS infrastructure. ## Challenges we ran into
- Making sense of fragmented information: Market signals are spread across financial data, news, regulations, and social media. Connecting them without treating correlation as causation took careful source selection and validation.
- Teaching agents to reuse research: A browser can explore a source, but repeating that discovery for every question is slow and costly. We built API Anything to turn source discovery into reusable operations, with validation and browser fallback.
- Keeping AI grounded: We had to make sources, assumptions, and uncertainty visible, and distinguish evidence from hypotheses and simulations.
- Connecting analysis to each investor: Understanding someone’s goals, risk tolerance, and concerns—and reflecting them in market research—required more than a generic chatbot.
- Building a complex AWS system: Coordinating agents, background jobs, data storage, authentication, and AI services while keeping the experience responsive was a major integration challenge.
Accomplishments that we're proud of
- Research that can grow with the question: Agents explore authorized sources, learn how to retrieve their data, and create reusable API integrations for future investigations.
- A research team orchestrated around each question: Agents plan investigations, select relevant sources, and coordinate specialized research tasks using AWS.
- Interactive market exploration: Users can explore events on charts, investigate hypotheses, and navigate company, portfolio, and supply chain connections.
- Agent-driven visual storytelling: Agents can select and assemble useful interactive views to present their findings.
- A complete AWS agentic pipeline: Bedrock, Step Functions, Lambda, SQS, DynamoDB, ECS Fargate, and an internal load balancer work together to power research.
- Evidence alongside insights: Sources, assumptions, and limitations help users inspect how findings were reached.
- The impact of all these optimizations together: A research process that used to take around 30 minutes can now take about 2 minutes.
What we learned
- Personalization starts with listening: Understanding an investor’s goals, concerns, and risk tolerance changes which market signals matter.
- Agents need tools and coordination: A useful agentic system depends on specialized roles, reliable APIs, and clear orchestration—not just a powerful model.
- Source discovery can become reusable infrastructure: Teaching the system how to access a source once can make future research faster and more consistent.
- Visuals make complex connections easier to explore: Interactive charts and supply chain views help people investigate relationships that are hard to spot in headlines alone.
- Trust comes from showing the work: Sources, assumptions, and uncertainty should be visible alongside AI-generated analysis.
What's next for Investor OS
- Make agent-built visualizations more flexible, letting each investigation create the interactive charts and views that best explain its findings.
- Strengthen evaluation and guardrails to measure research quality, source reliability, and agent performance as the platform grows.
Built With
- amazon-api-gateway
- amazon-bedrock
- amazon-bedrock-agentcore-browser
- amazon-bedrock-guardrails
- amazon-bedrock-knowledge-bases
- amazon-cloudfront
- amazon-cloudwatch
- amazon-cognito
- amazon-dynamodb
- amazon-ecr
- amazon-ecs
- amazon-sqs
- amazon-transcribe
- amazon-web-services
- api-anything
- aws-fargate
- aws-lambda
- aws-step-functions
- fastapi
- python
- react
- terraform
- typescript
- vite
