-
-
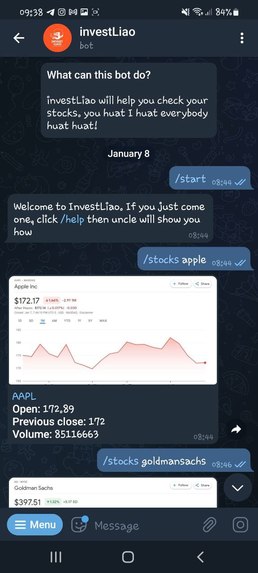
start & stocks command
-

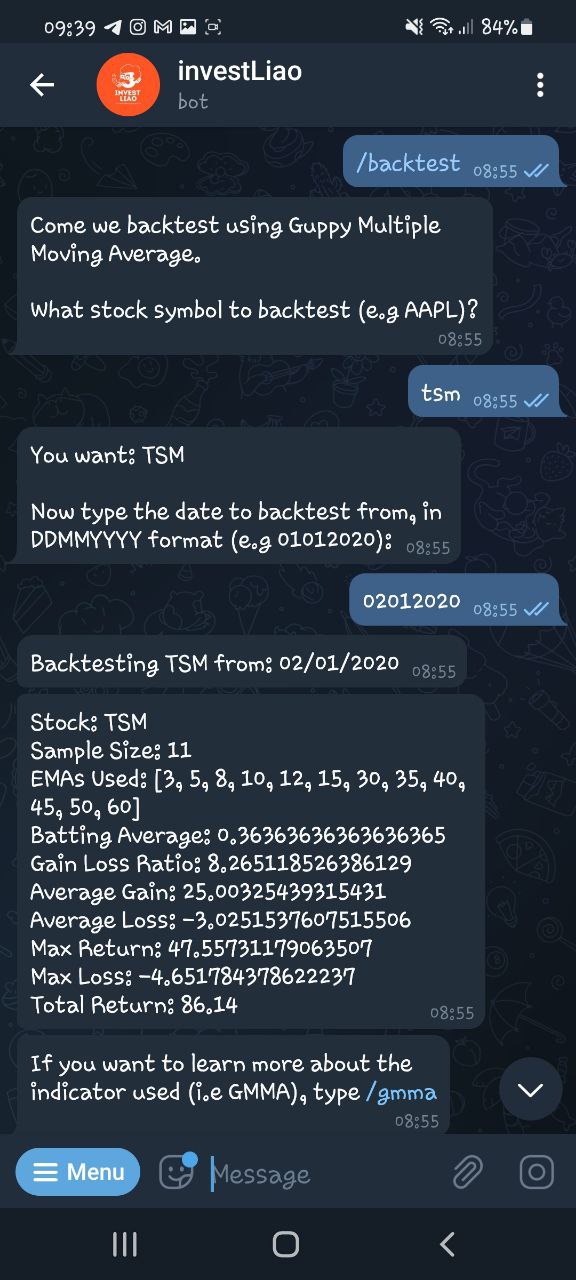
backtesting command
-
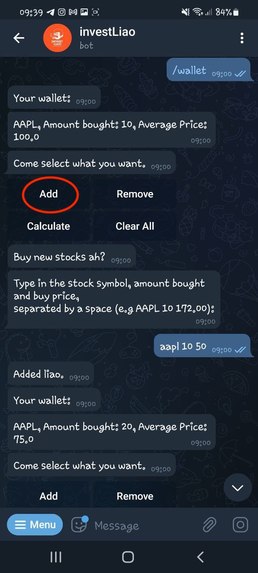
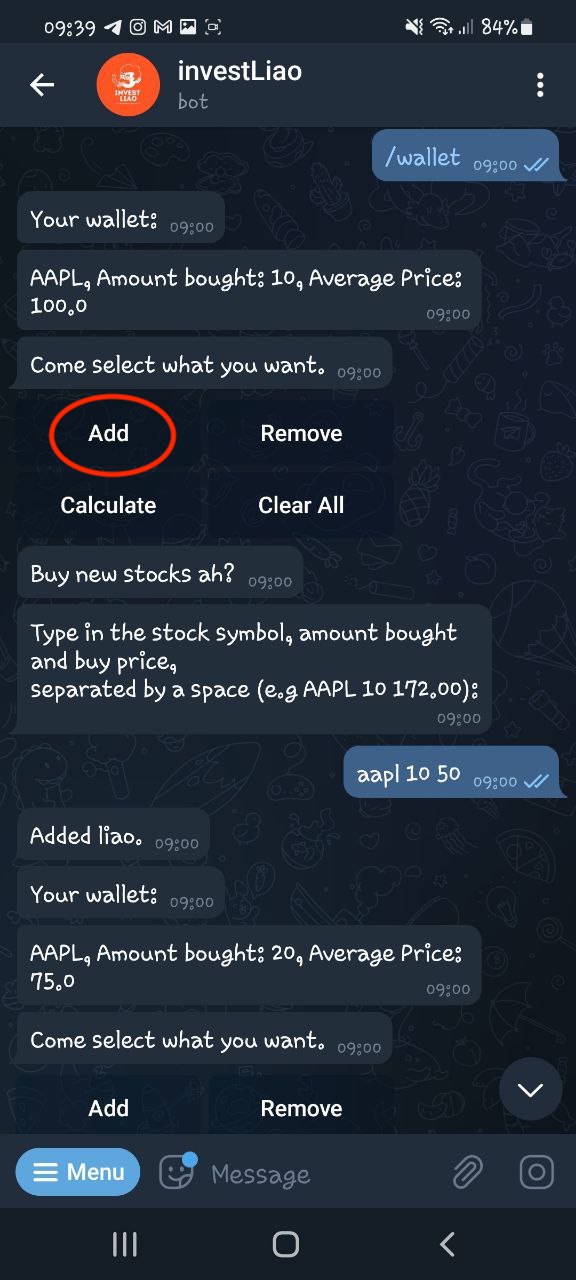
wallet > add command (Adjust quantity and average traded price)
-

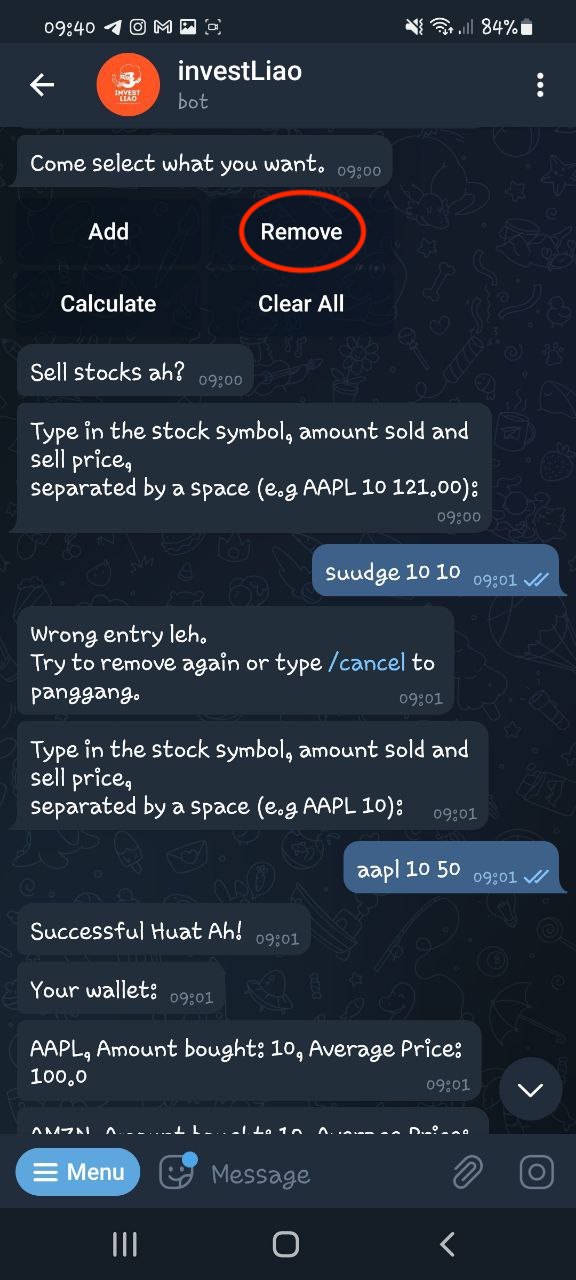
wallet > remove command (Adjust quantity and average traded price)
-
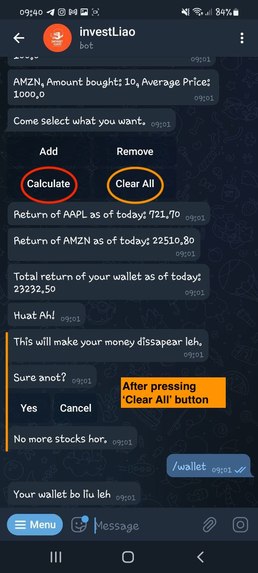
wallet > 1) calculate (Display today's return for indiv stocks and the entire portfolio) 2) Clear all (Clear wallet) commands
-

our logo!


Inspiration
To retrieve essential information of our stock positions, view live market data or conduct technical analysis, we need to navigate through different tabs, applications and websites. As computing students, we have no time for that.
Motivated by our laziness desire to streamline this process, we decided to create investLiao, a one-stop Telegram Bot that provides various commands to:
- Track user's open positions and average traded price.
- Display real-time stock market data and charts from Yahoo Finance.
- Backtest using Guppy Multiple Moving Average (GMMA).
What investLiao can do
Investment Tracker
The bot tracks users' stock positions, in 3 fields:
- Stock Symbol
- Amount bought
- Buy Price
in our /wallet command.
Through our functions:
/add, users are able to add new investments made./remove, users are able to remove desired amount of any existing stock positions./calculate, users are able view to their unrealised profit and loss./check, users are able to check their existing stock positions.
Stock Searching and Charting
Through our command:
/stocks, users are able to obtain real-time stock market data and charts.
We obtained real-time stock market data from yfinance.
Charting is done using the Selenium library, which visits Google Finance and automatically keys in the name of the input stock. A cropped screenshot is then taken and displayed to the user. The data from the site is also used to retrieve other ticker information from the yfinance library.
Backtesting
Through our command:
/backtest, users are able to backtest with Guppy Multiple Moving Average (GMMA).
GMMA is a technical indicator that identifies changing trends, breakouts, and trading opportunities in the price of an asset by combining two groups of moving averages (MA) with different time periods. It provides an objective method to know when to get in and when to get out of a trade.
After you input the stock symbol, and the date to backtest from, the bot will output :
- Stock
- Sample Size
- EMAs Used
- Batting Average
- Gain Loss Ratio
- Average Gain
- Average Loss
- Max Return
- Max Loss
- Total Return
... as of todays date.
How we built it
- investLiao was built using Python 3.8, with
python-telegram-bot Library.
Challenges we ran into
- Figuring out a way to capture and display stock graphs. Our initial plan was to fetch the data from
yfinanceand plot the graphs usingpandasandseaborn. However, we find that the stock graphs online look much better and leveraged onSelenium libraryto achieve this (More details found above). - Understanding and utilising the relevant classes and methods in
python-telegram-bot. - Overcoming sleepiness and working under time constraints.
Accomplishments that we're proud of
- Creating a Telegram Bot from scratch
- Working as a cohesive team
- Having fun!
What we learned
- Perseverance
- Teamwork
What's next for investLiao
- To include more strategies and technical indicators to backtest with, beyond the existing one (i.e GMMA).
Built With
- python
- python-telegram-bot

Log in or sign up for Devpost to join the conversation.