-
-
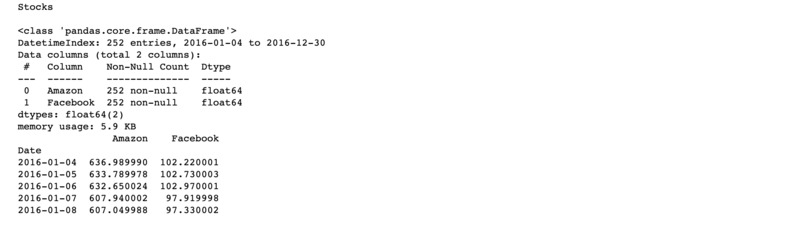
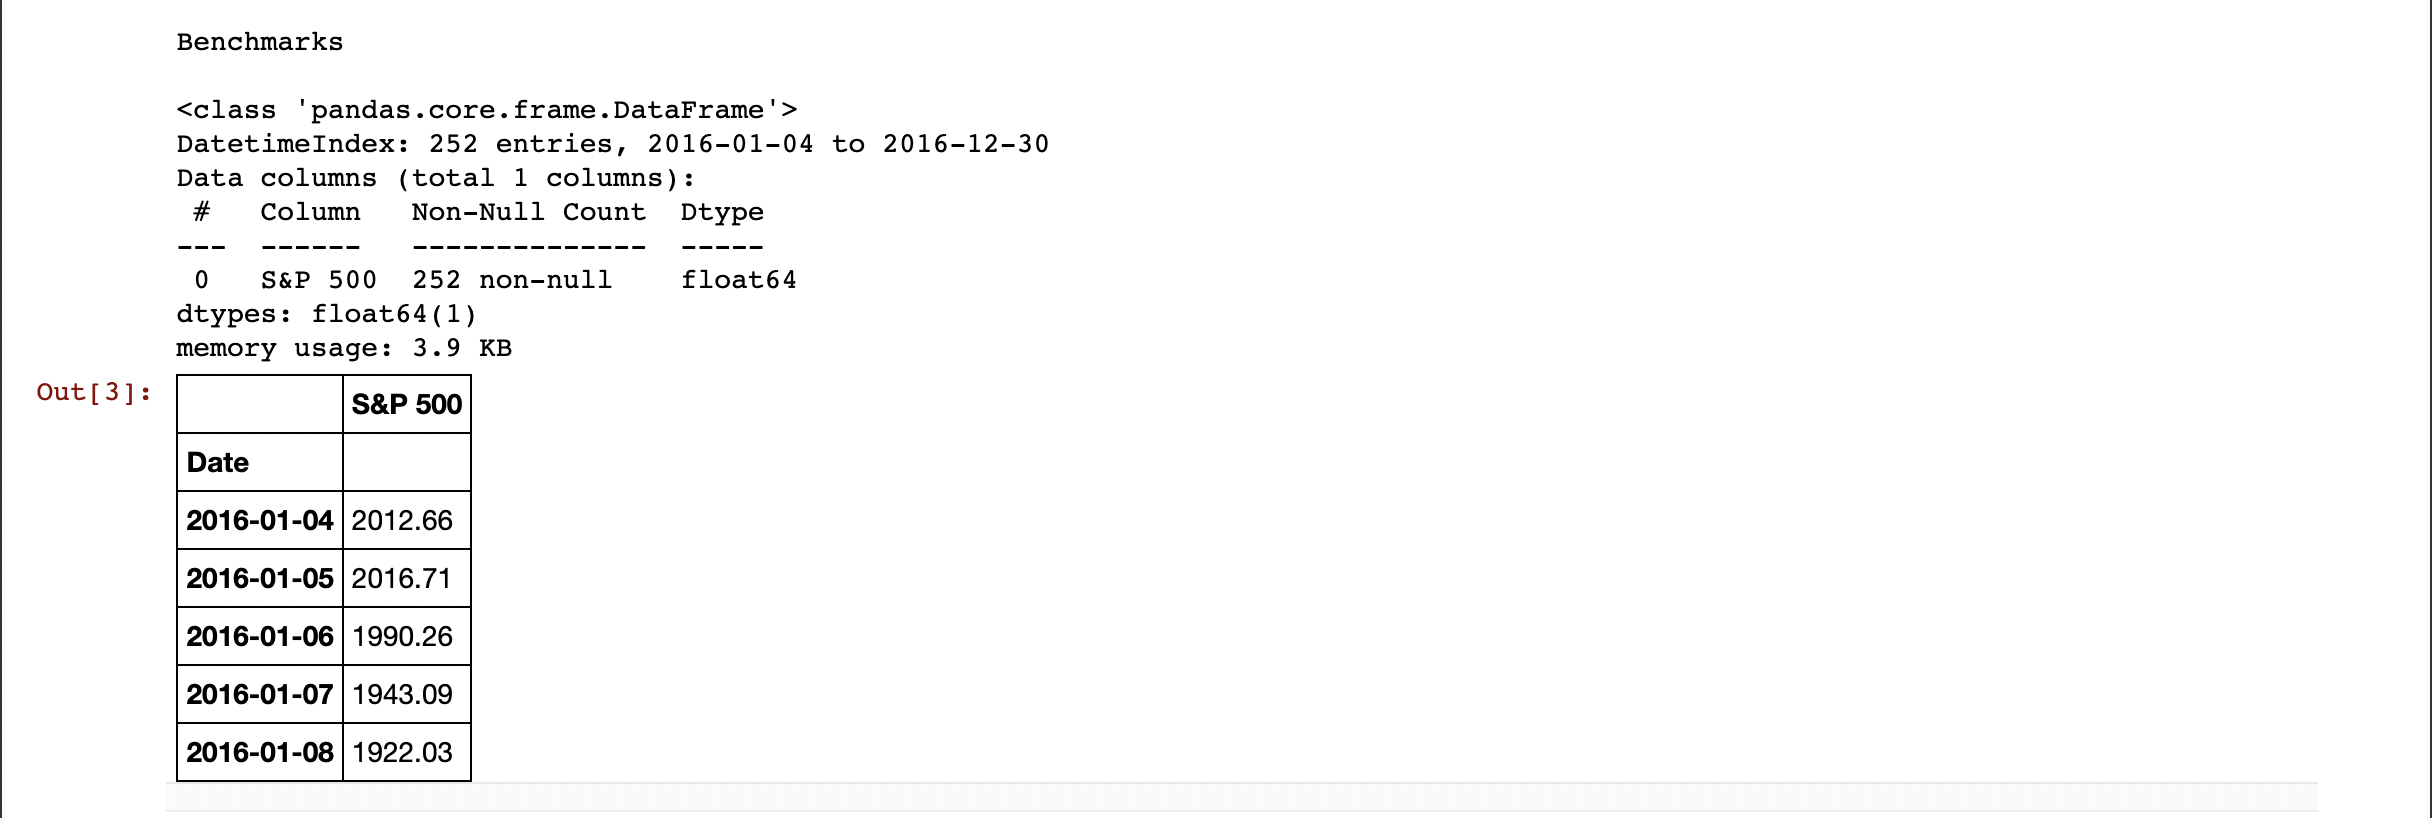
Stock data
-
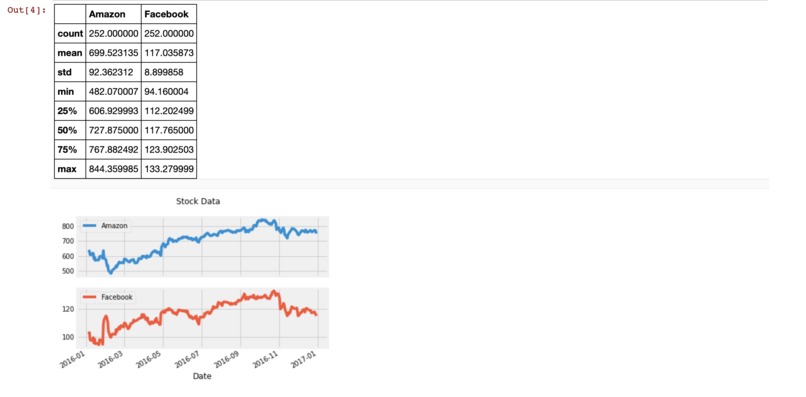
Visualise Stock
-
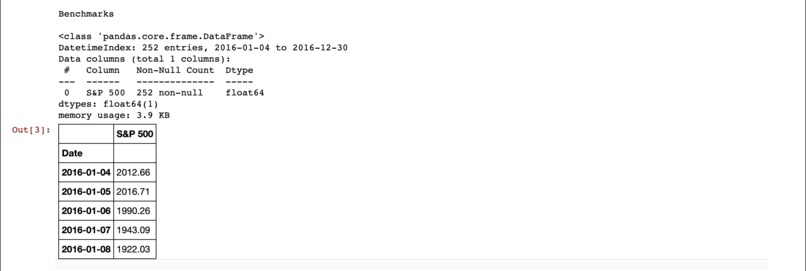
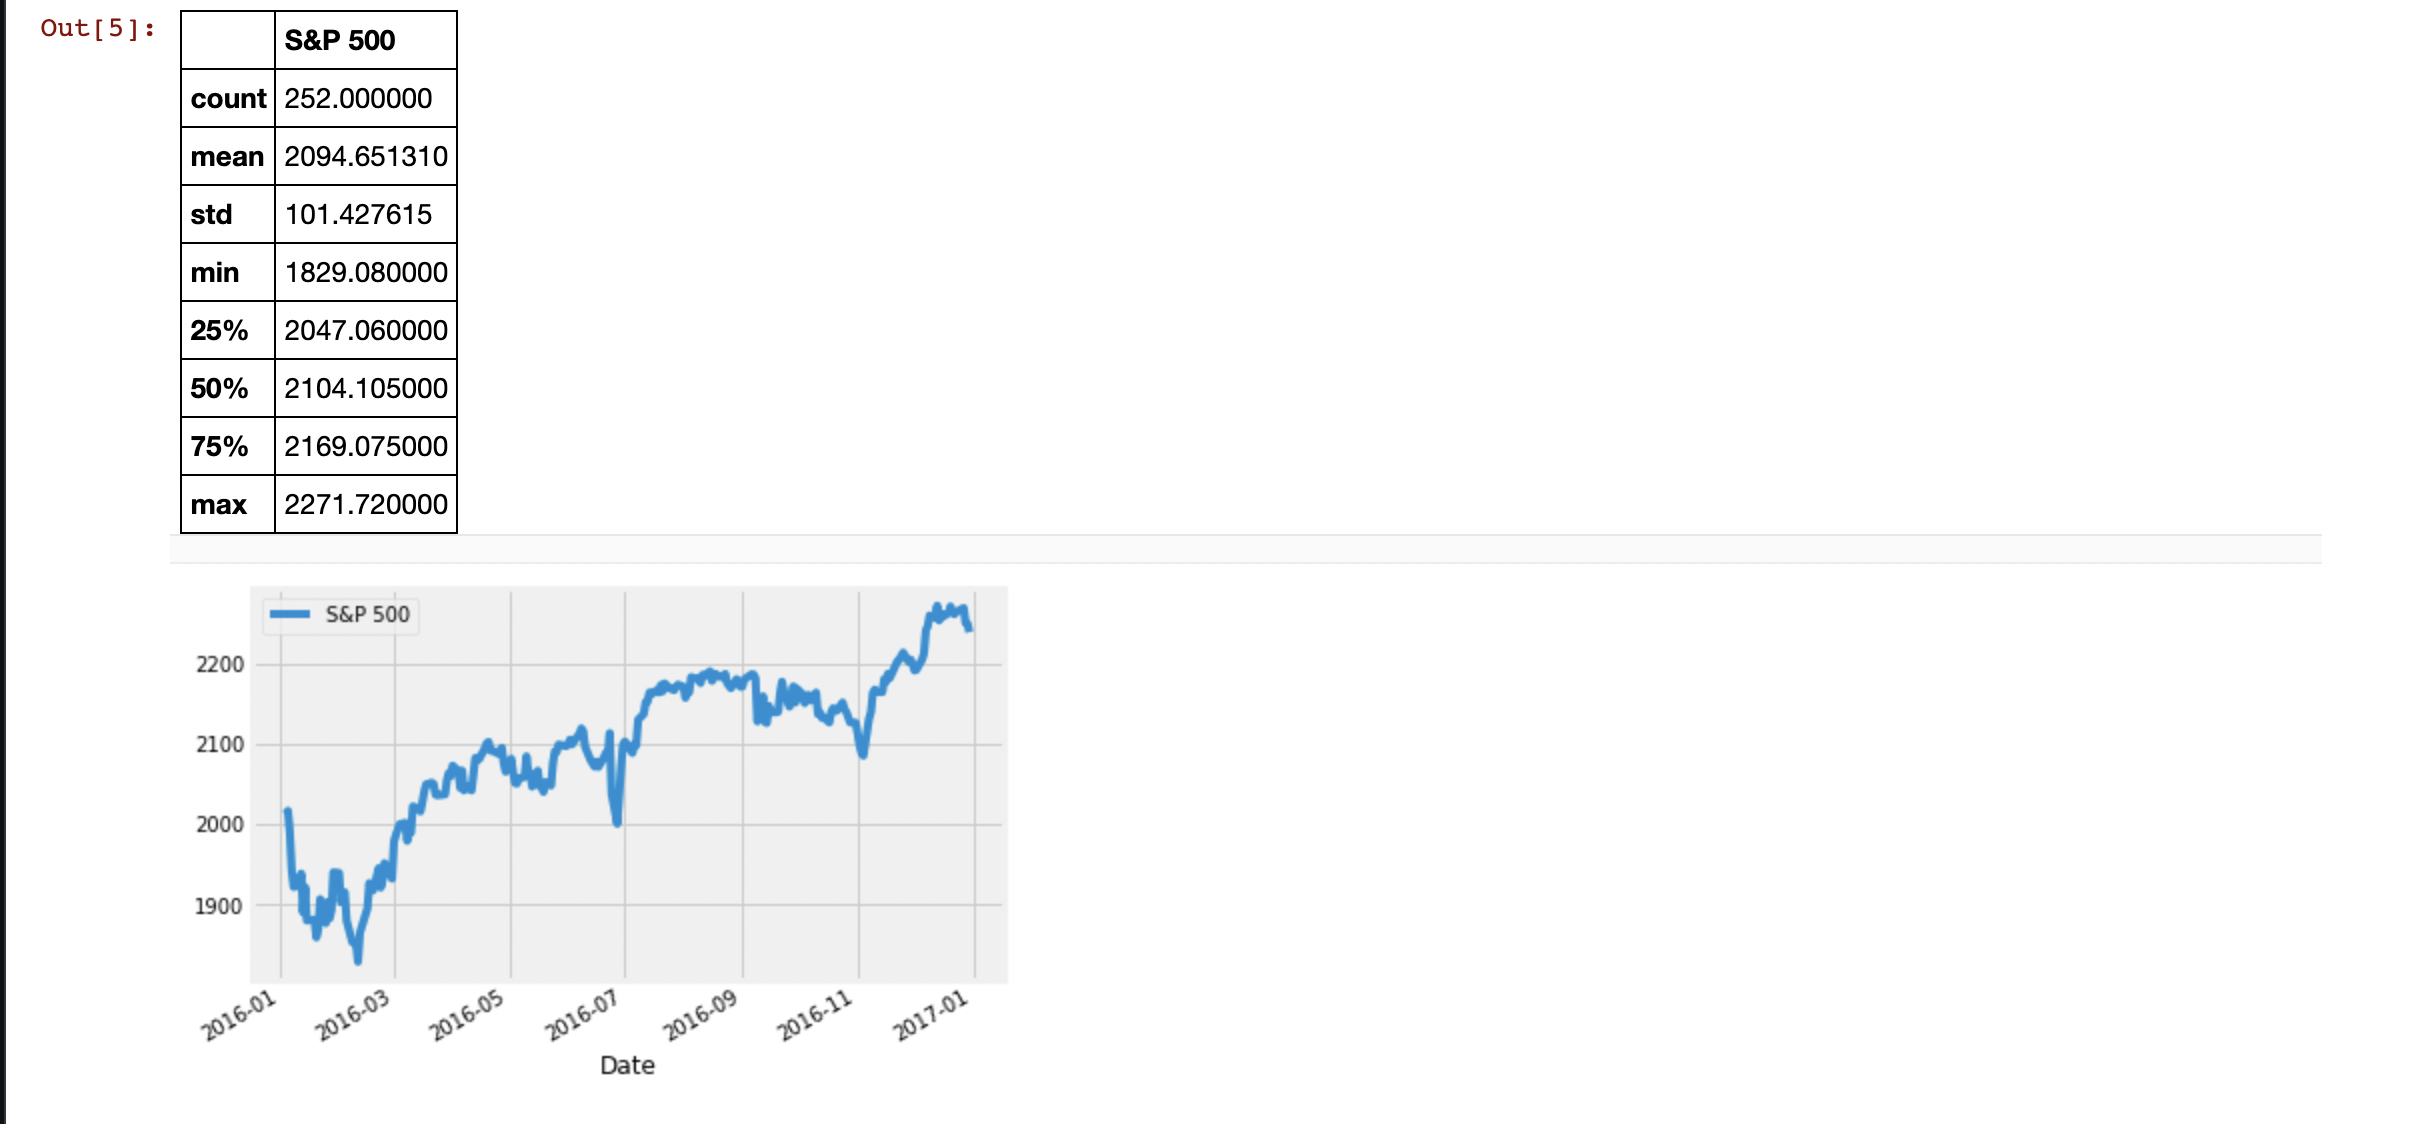
Benchmark data
-
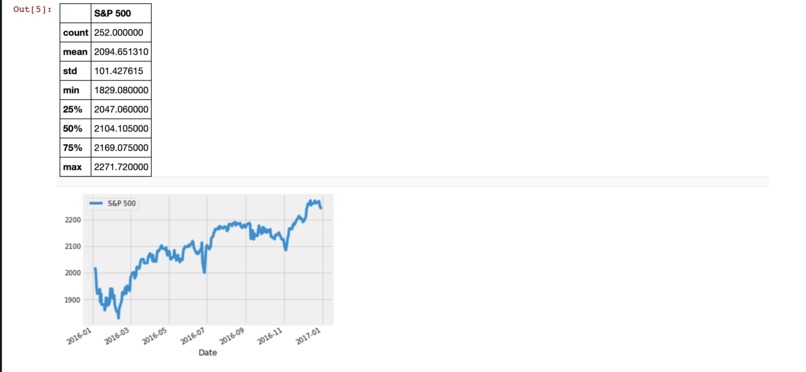
Visualise Benchmark data
-
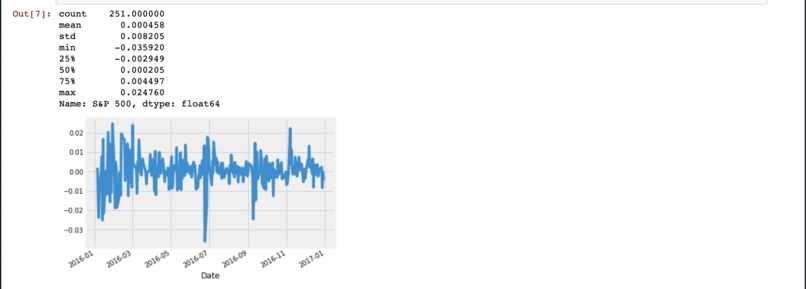
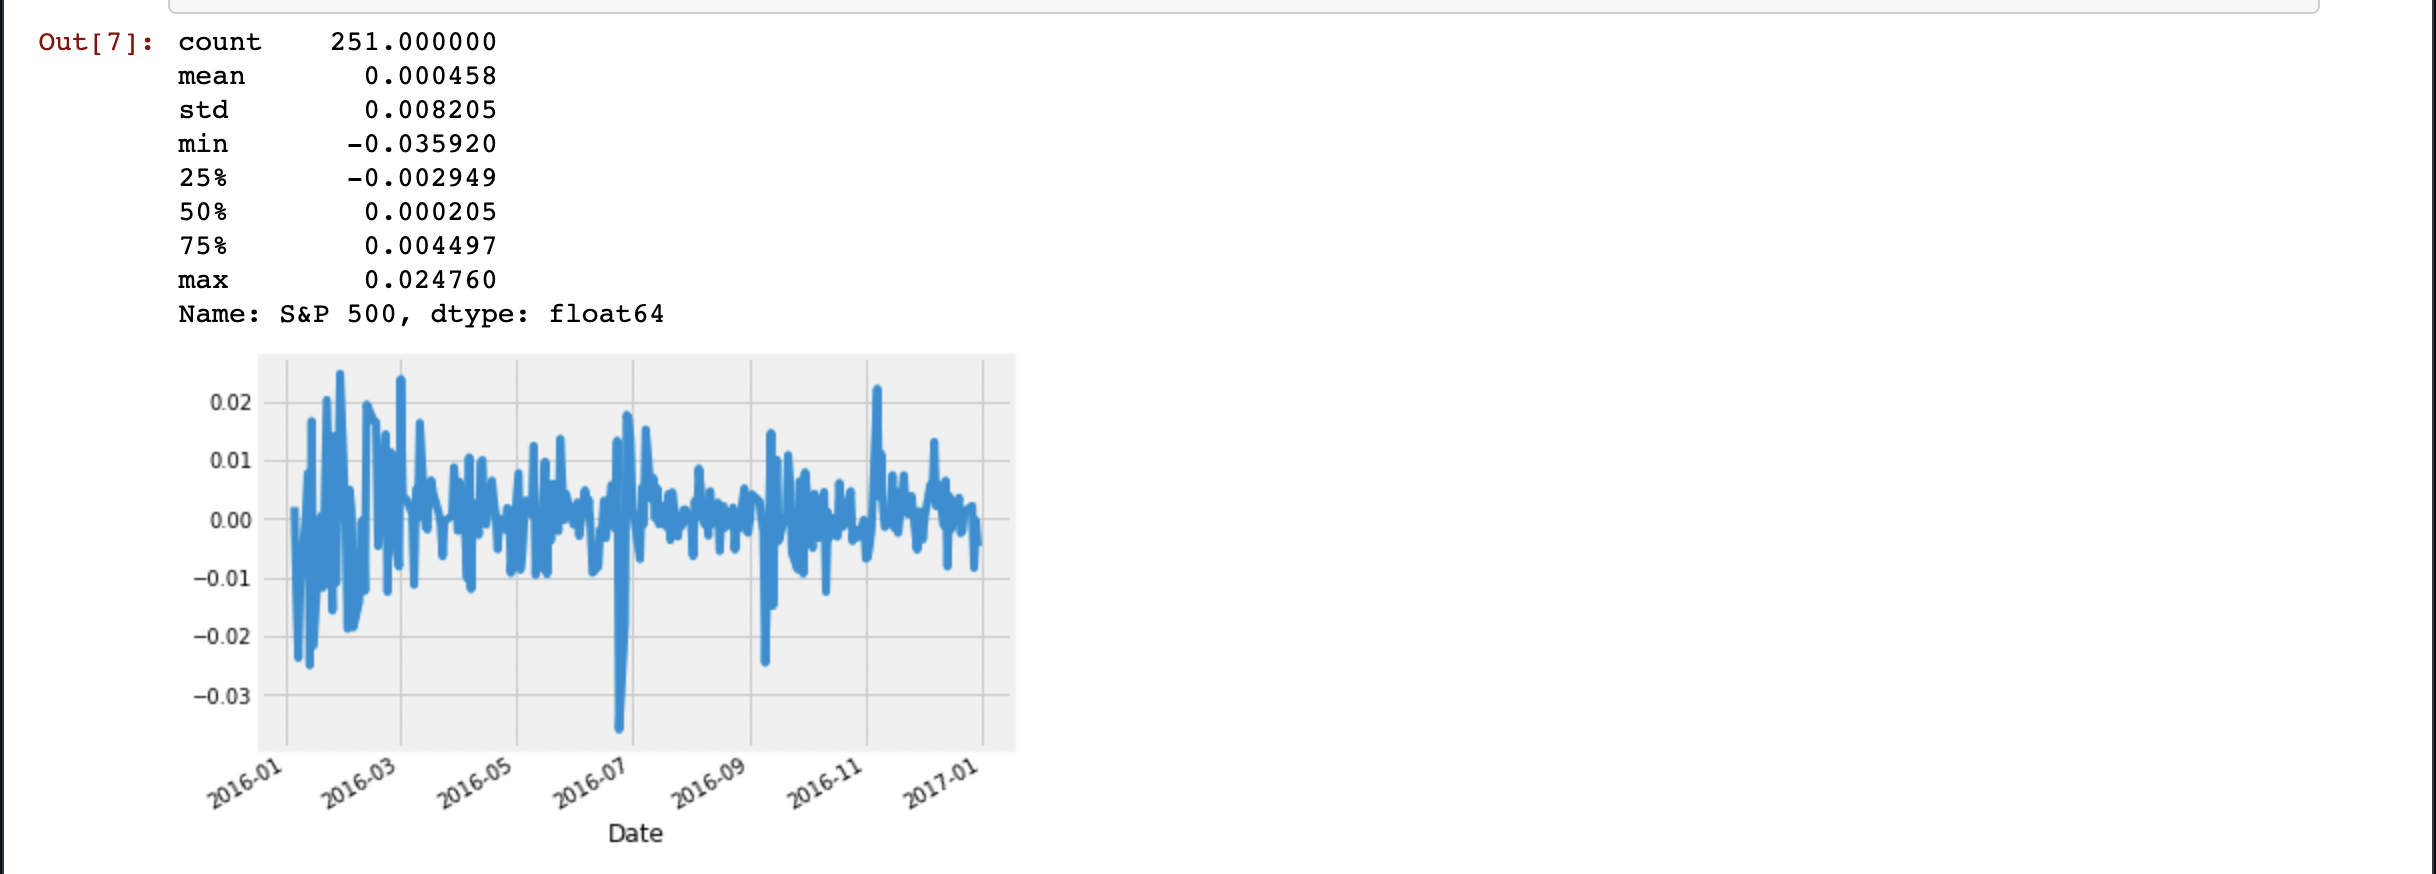
Daily Benchmark Change
-
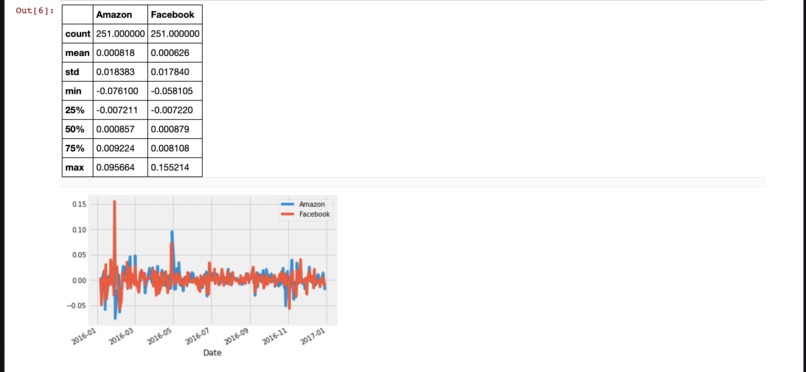
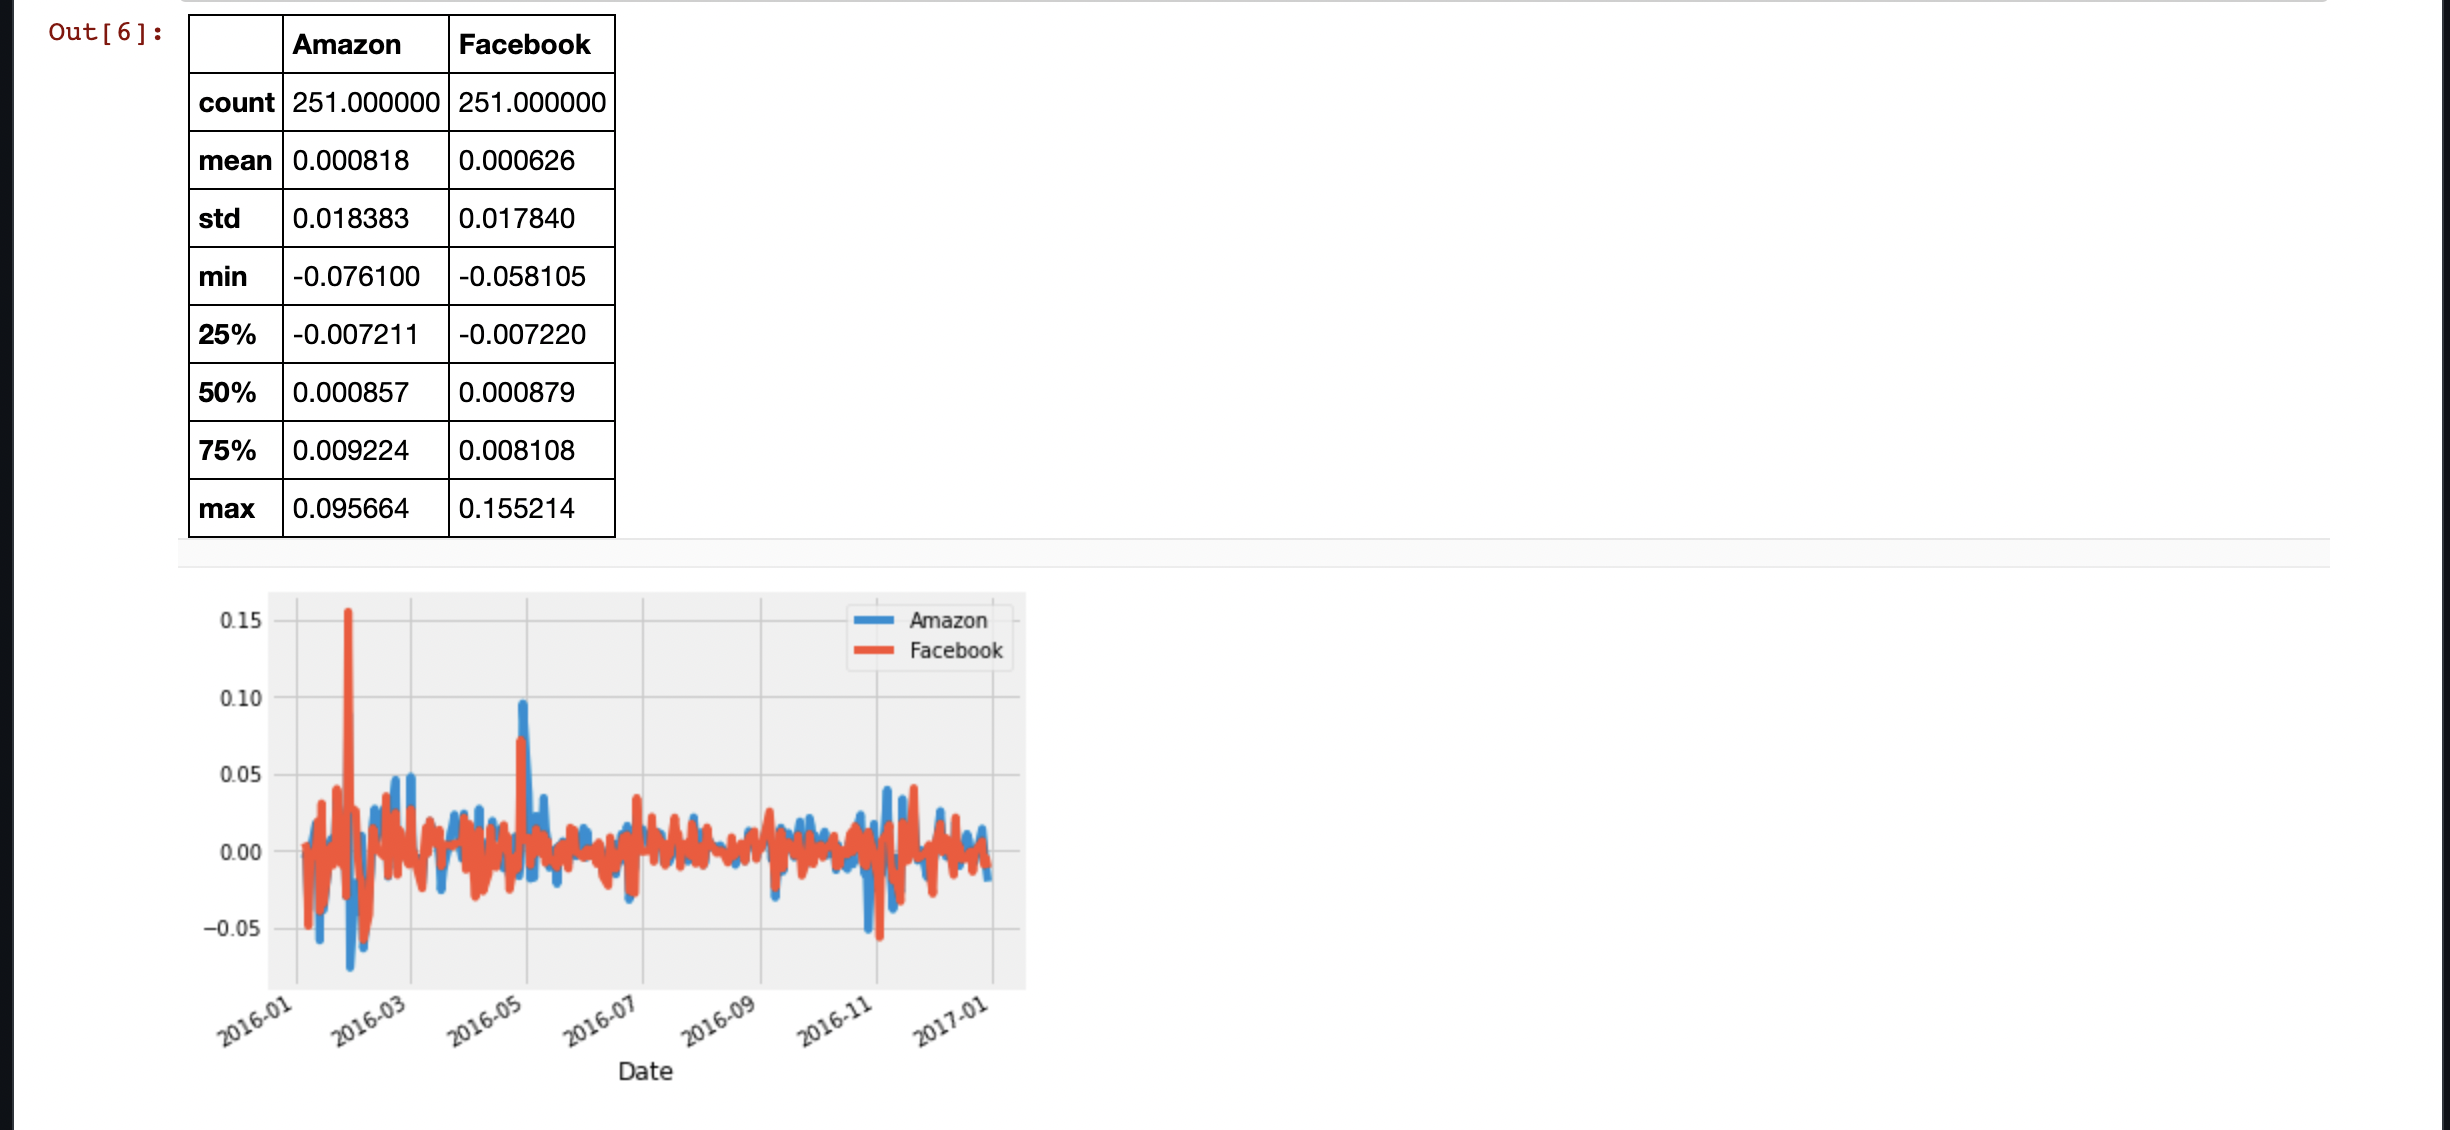
Daily Stock Change
-
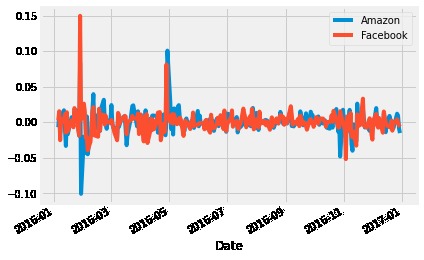
Excess Return Plot
-
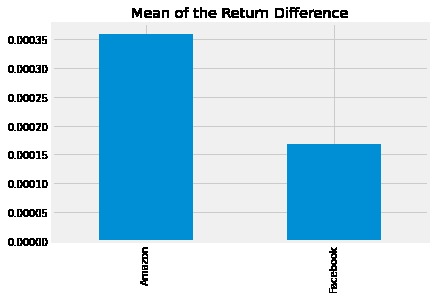
Mean Plot
-
Standard Deviation Plot
-
Sharpe Ratio Plot
Inspiration
The investment would make sense if we expected it to bring back more money than it costs. But returns are only one side of the story because it is dangerous - there can be a variety of outcomes. How does one compare different investments that can bring the same results on average, but show different levels of risk?
What it does
William Sharpe is our man.
He introduced the reward-to-variability ratio in 1966 that soon came to be called the Sharpe Ratio.
It compares the expected return on two investment opportunities and calculates the additional return for each risk unit an investor can receive by choosing one over the other. In particular, it looks at the difference in the return on the two investments and compares the difference between the average deviation (as a risk level) of that difference. Sharpe's high rating means that the reward will be higher than the given risk amount. It is common to compare a certain period of time with a measure that represents the entire investment category.
The Sharpe rate is generally calculated for the portfolio and uses the risk-free interest rate as a measure. We will simplify our model and use stocks instead of portfolios. We will also use the stock index as a benchmark rather than a risk-free interest rate because both are readily available on daily frequencies and do not need to be involved in changing interest rates from annual to daily. Just remember that we will do the same calculation of portfolio returns and your risk-free rate of choice, e.g, the 3-month Treasury Bill Rate.
So let’s visualize and see for ourselves about Sharpe’s rating by counting down the shares of two tech giants Facebook and Amazon. As a benchmark, we will use the S&P 500 which measures the performance of 500 major US stocks. When we use the stock index instead of a risk level, the result is called Information Ratio and is used to mark a return on active portfolio management because it tells you how much to reimburse a given unit risk to your fund manager in terms of just putting your money in a low-cost fund.
How we built it
The Sharpe Ratio uses the difference in returns between the two investment opportunities under consideration.
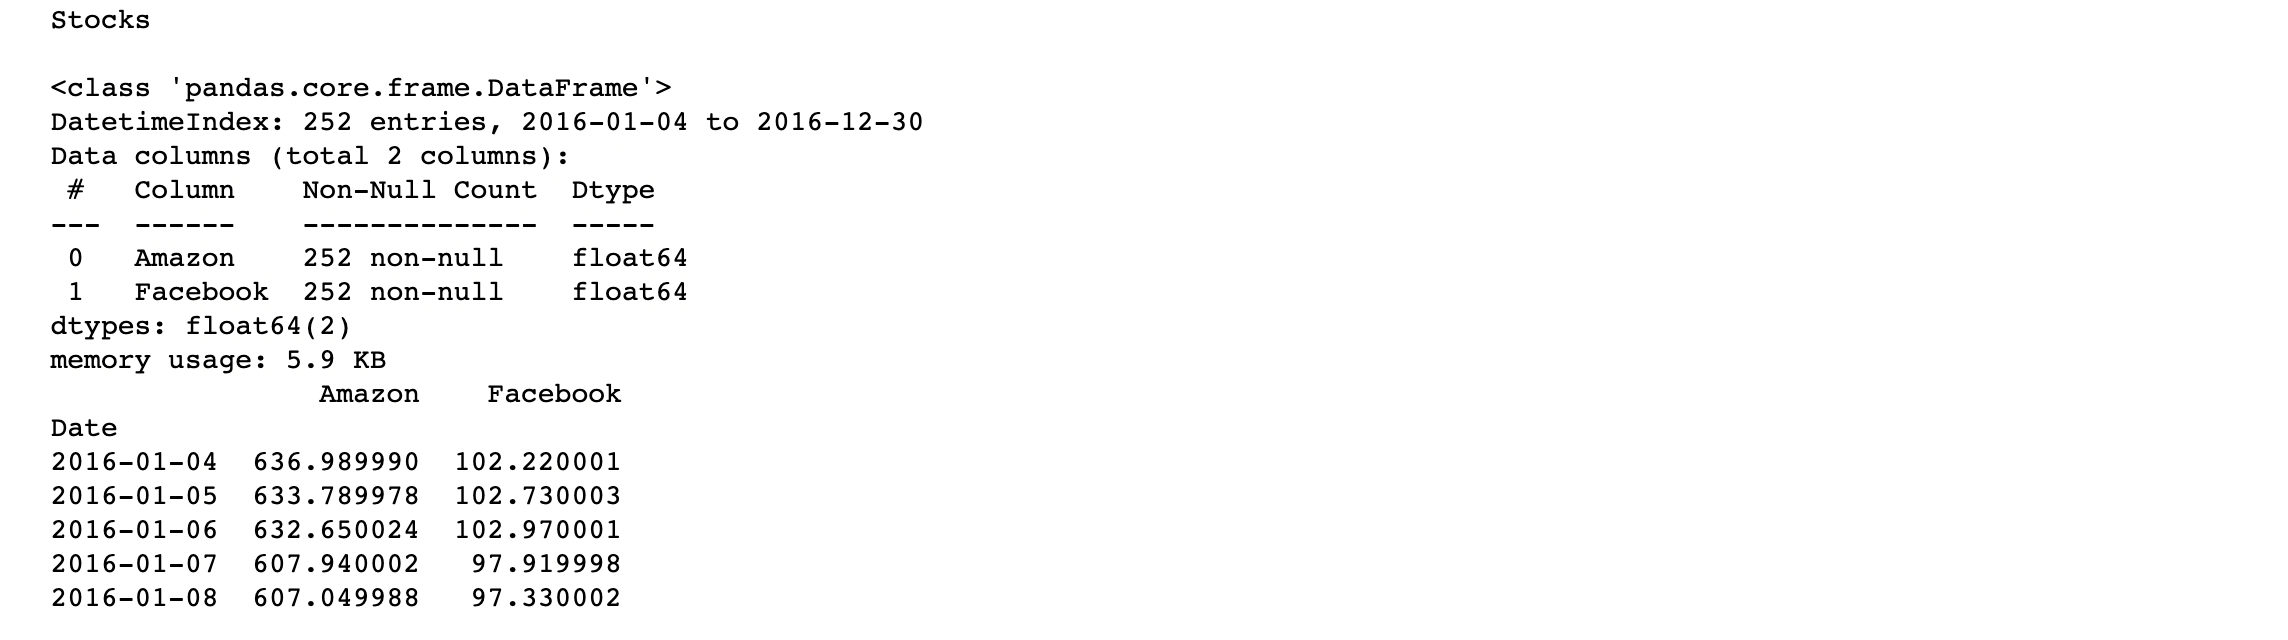
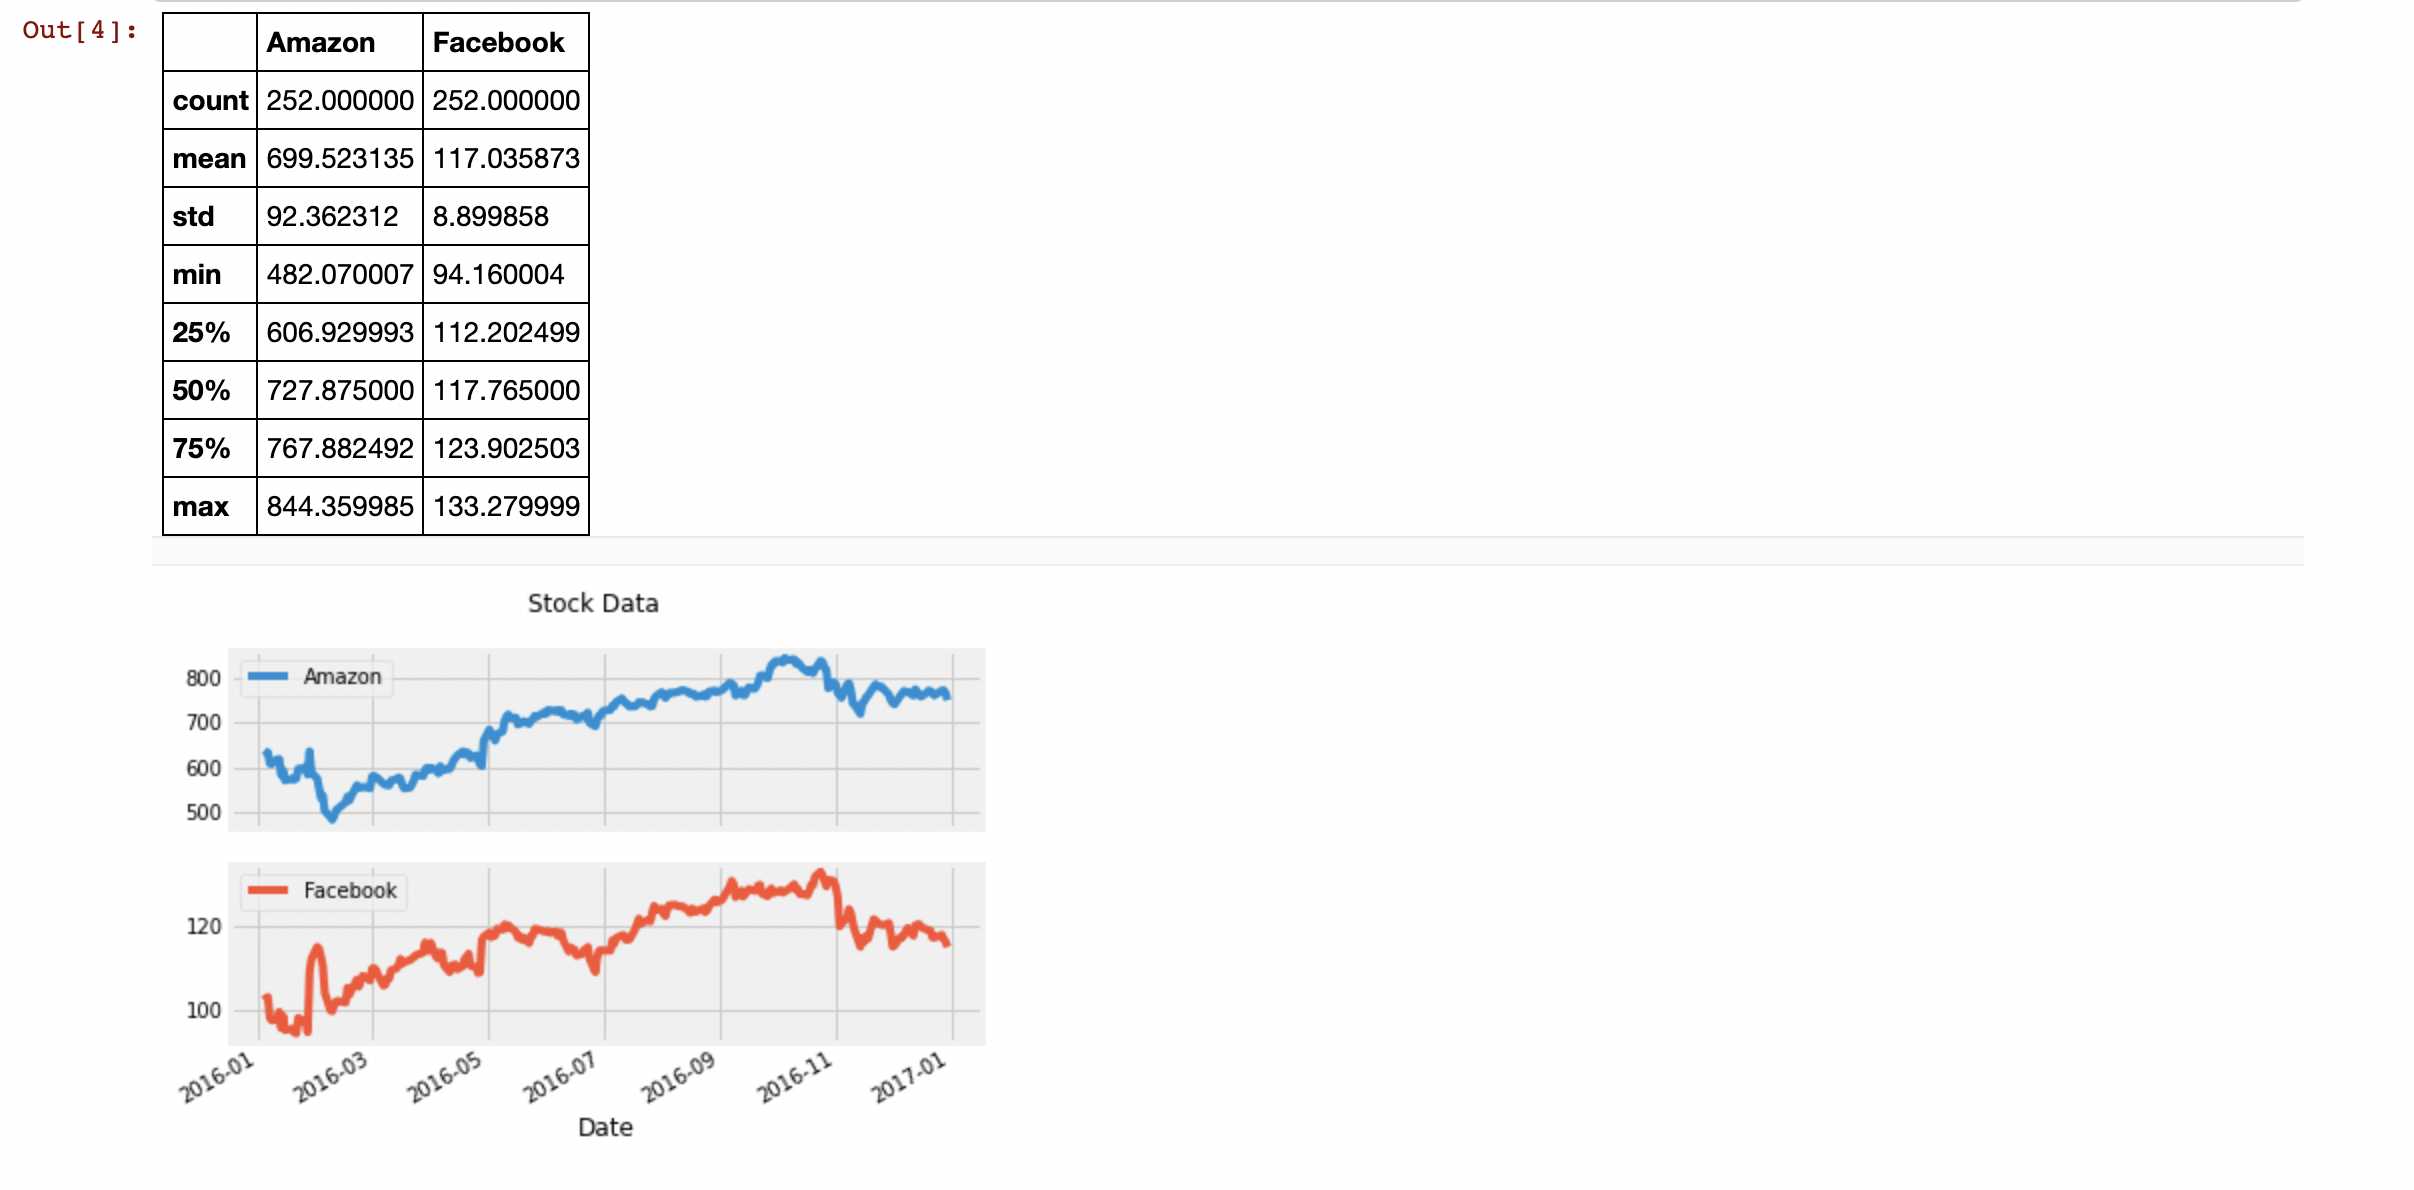
However, our data show the historical value of each investment, not the return. To calculate the return, we need to calculate the percentage change in value from one day to the next. We'll also take a look at the summary statistics because these will become our inputs as we calculate the Sharpe Ratio.
For the S&P 500 data, calculating daily returns works just the same way.
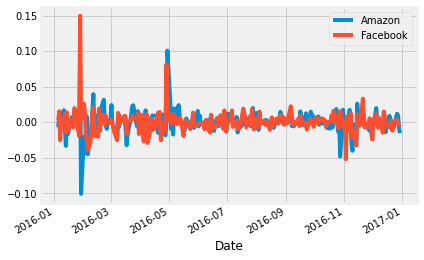
We need to calculate the relative performance of stocks compared to the S&P 500 benchmark. This is calculated as the difference in returns between stock_returns and sp_returns for each day.
Now we can finally start computing the Sharpe Ratio.
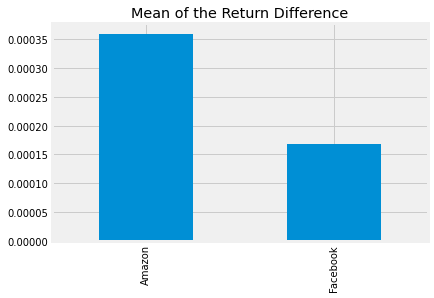
First, we need to calculate the average of the excess_returns. This tells us how much more or less the investment yields per day as compared to the benchmark.
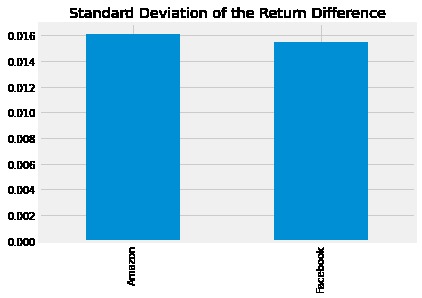
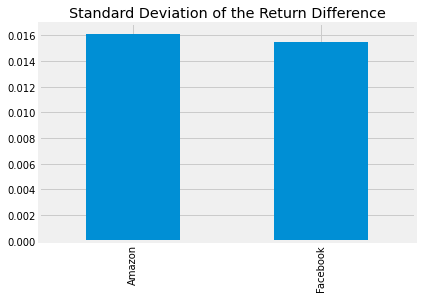
Next, we calculate the standard deviation of the excess_returns. This shows us the amount of risk investment in the stocks implies as compared to an investment in the S&P 500.
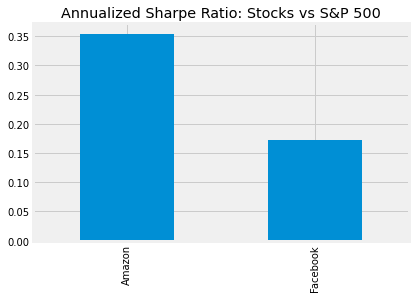
Now we just need to compute the ratio of avg_excess_returns and sd_excess_returns.
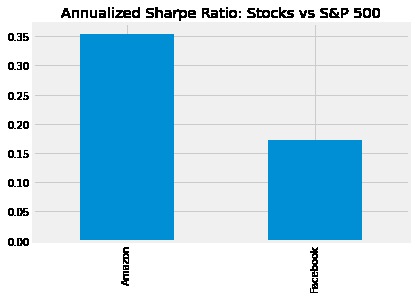
The result is now finally the Sharpe ratio and indicates how much more (or less) return the investment opportunity under consideration yields per unit of risk.
The Sharpe Ratio is often annualized by multiplying it by the square root of the number of periods. We have used daily data as input, so we'll use the square root of the number of trading days (5 days, 52 weeks, minus a few holidays): √252
Conclusion
Given the two ratios of Sharpe, what investment should we go to? In 2016, Amazon had twice the Sharpe ratio than Facebook. This means that investing in Amazon has doubled compared to the S&P 500 for each risk unit an investor would have imagined. In other words, in terms of risk-adjusted terms, investing in Amazon would have been more attractive.
This difference was largely driven by differences in returns rather than risks between Amazon and Facebook. The risk of choosing Amazon over FB (as measured by standard deviations) was only slightly higher so that Amazon’s higher Sharpe rate kept it high due to Amazon’s high average daily return. When faced with other investment options that offer a variety of returns and risks, the Sharpe Ratio assists in decision-making by adjusting the return on the risk difference and allows the investor to compare investment opportunities on equal terms, i.e., apples-on-apples basis.
Challenges we ran into
The Sharpe Ratio uses the difference in returns between the two investment opportunities considered. However, our data reflect the historical value of each investment, not the return. To calculate the return, we need to calculate the percentage change in value from one day to the next. We will also look at the summary statistics as this will be our input as we calculate the Sharpe Ratio.
Accomplishments that we're proud of
This being the first project I have in the field of data and analytics, everything that I did with the project was an achievement.
What we learned
Playing around with data, sharpe ratio for finances, and sticking around with the idea even when you think it might not work out
What's next for Investise
Hmm, well I intend to build this with a website with cool data feeding and visualizing type features. Basically generalizing it. Right now, this is just a prototype.
Built With
- collab
- machine-learning
- matplotlib
- numpy
- pandas
- python

Log in or sign up for Devpost to join the conversation.