-
-
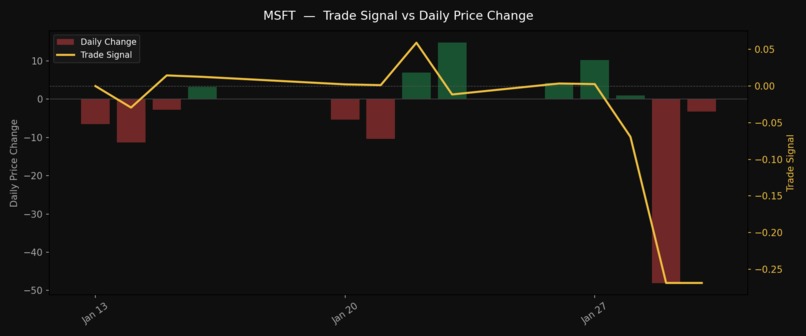
MSFT data analysis
-
Trump data analysis

Investigating Sentimental and Physical Analysis of Stocks
Authors: O. Nowatschek, M. Rivaldi, F. Chatzichristofi, C. Perera
Short Project Description
This project treats financial markets as physical systems with an algorithm split into two parts to help investors make more accurate and informed decisions. One part is an entropy volatility detector inspired by published econophysics papers and innovated to better account for time decays and short-term versus long-term trends. The other part is a sentiment bot powered by an NLP, which scrapes data of popular financial magazines and Reddit to understand market sentiment. We have included our own formulas in the bot to make it more powerful than others that have been previously developed. The entropy volatility detector says when a price movement is likely to occur, and the sentiment bot says which direction it will likely occur in. Together they are a powerful predictive tool and output a number from -1 to 1 based on where the model thinks the price will go.
Detailed Project Description
Problem and Impact
The Problem: Traditional financial theories (like the Black–Scholes model) assume that stock price moves follow a standard normal, or log normal, distribution. However, because traders interact, panic, and herd together, their collective psychology creates positive feedback loops. This social pressure forces prices into fat tails, a mathematical term meaning that extreme events (market crashes or massive breakouts) happen far more frequently than standard models predict.
The Impact: Our system identifies the specific transition point where a calm market begins to show signs of instability. By detecting these early thermodynamic shifts before they appear in the price, the model warns of an upcoming move. This allows you to enter a position with high conviction before the majority of the market reacts to the trend.
Innovation and Technical Execution
The core innovation of this project is modeling the stock market as a thermodynamic system while using advanced NLP to act as the pressure of the system. We map physical variables directly to financial metrics: Market Temperature (Kinetic Energy) is derived from Parkinson Volatility, System Disorder (Information State) is derived from Tsallis Entropy, and External Market Pressure is derived from Financial Sentiment.
Tsallis Entropy ($S_q$): A Magnifying Glass for Fat-Tailed Risk
Traditional Shannon entropy:
[ S = -\sum p \ln p ]
suppresses the signals of rare events, as ( x \ln x \to 0 ) when ( x \to 0 ). To accurately model the fat tails of market crashes, we utilize Tsallis entropy, a formula designed for complex, interacting systems. We set the entropic index to ( q=0.5 ), yielding:
[ S_q = \frac{1}{q-1} \left( 1 - \sum_{i=1}^{N} p_i^{q} \right) ]
Because our probabilities ( p_i ) are decimals between 0 and 1, the square root applied by ( q=0.5 ) acts as a mathematical magnifying glass. While Shannon entropy minimizes a 1% tail-risk ( (0.01) ), our Tsallis model amplifies it tenfold:
[ \sqrt{0.01} = 0.1 ]
making subtle thermodynamic instabilities visible before a crash happens.
Time-Weighted Distribution and the 30/60/120 Multi-Scale Split
Market disorder manifests at different speeds. Micro-shocks disrupt the short term, while macro-trends define the long term. To capture this, we do not rely on a single timeframe. Instead, we calculate the Tsallis entropy across 30, 60, and 120 days and average.
By blending ( S_q^{(30)} ), ( S_q^{(60)} ), and ( S_q^{(120)} ), the model becomes immune to short-term noise while remaining highly responsive to immediate phase transitions.
Furthermore, within these windows, we apply an exponential decay factor ( \lambda ) to our probability bins. This ensures the system heavily prioritizes recent market behavior over older data. We mathematically prove that this time-weighted approach remains a valid probability space.
Proof.
Let our bins be ( x_1, \ldots, x_N ) for ( T ) time intervals. We define the normalization constant:
[ C := \sum_{t=1}^{T} e^{-\lambda t} ]
We define the probability of a return falling into bin ( x_i ) using the indicator function ( \mathbf{1}_{x_i} ). Summing across all bins yields:
[ \sum_{i=1}^{N} p(x_i) = \frac{1}{C} \sum_{i=1}^{N} \left( \sum_{t=1}^{T} e^{-\lambda t} \mathbf{1}{x_i} \right) = \frac{1}{C} \sum{t=1}^{T} e^{-\lambda t} \left( \sum_{i=1}^{N} \mathbf{1}_{x_i} \right) ]
Because an event must fall into exactly one bin:
[ \sum_{i=1}^{N} \mathbf{1}_{x_i} = 1 ]
Therefore:
[ \sum_{i=1}^{N} p(x_i) = \frac{1}{C} \sum_{t=1}^{T} e^{-\lambda t} = \frac{C}{C} = 1 ]
Finally, to provide a bounded score, ( S_q ) is normalized by the maximum possible disorder:
[ S_{q,\max} = \frac{N^{1-q} - 1}{1-q} ]
Parkinson Volatility (Kinetic Energy)
Closing prices can overlook large fluctuations in between price samples. We can take into account these hidden changes using the Parkinson range, which includes the ratio between the daily high and daily low:
[ \sigma_P = \sqrt{\frac{1}{4n \ln 2} \sum_{i=1}^{n} \left( \ln \frac{H_i}{L_i} \right)^2} ]
This is blended with our multi-scale Tsallis entropy (at a 70/30 split) to create our unified magnitude score ( V_{\text{score}} \in [0,1] ).
The Sentiment Bot: Deep NLP and Heuristic Weighting
The qualitative engine of our pipeline is a highly optimized sentiment bot that extracts data from two primary domains: retail crowd-psychology (Reddit: r/wallstreetbets, r/investing) and institutional news (Finnhub API). Because standard NLP models misunderstand financial jargon, we utilize FinBERT (ProsusAI/finbert), a transformer-based model fine-tuned on financial language.
To prevent the bot from treating all news equally, the raw outputs are processed through a custom weighting pipeline.
It is important to note that these functions are estimates and that to properly find the coefficient and/or functions we desire, we would need to use machine learning.
- Base sentiment score: Let ( i = 1, \dots, N ) denote a mention of our asset on a certain day. We use an NLP (natural language processor) to analyze this mention and return a value between -1 and 1. We then sum these values and find the mean to get our "sentiment" for that day:
[ S_{\text{daily}} = \frac{1}{N} \sum_{i=1}^{N} (L_i) ]
- Hype multiplier: Let ( N_t ) denote the difference in the number of mentions our asset received in time interval ( t ). Then we define a "hype" function to be:
[ \text{Hype}t = \exp(N_t - N{\max}) ]
- Recency decay: For financial sources, we choose our recency function to be:
[ \text{Recency}t = 1 - \tanh \left( \frac{t{\text{days}}}{3} \right) ]
and for non-financial sources, such as Reddit, we chose:
[ \text{Recency}t = e^{\frac{-t{\text{days}}}{2}} ]
- Outreach: We do not want to weight the importance of a source that reaches 10 people the same as one which reaches ( 10^6 ) people. Therefore, we created an outreach function defined as follows. For every day ( i ), the outreach for Reddit is:
[ o_i = \frac{k^{0.25} \log(k)}{M^{0.25} \log(M)} ]
where ( k ) is the number of mentions that day and ( M ) is the maximum number of mentions across all days, and 1 for financial sources (because we cannot measure their impact easily, and we know it is large).
The final weighted sentiment score ( S_{\text{sent}} ) is the sum of the product of the sentiment, the hype multiplier, the recency decay, and the outreach, divided by the sum of the product of the hype multiplier, recency decay, and outreach. Therefore, it is normalized to [-1, 1].
The Double-Negative Solution & Signal Fusion
Our physics pipeline outputs a magnitude-only scalar:
[ V_{\text{score}} \in [0, 1], ]
and the sentiment bot outputs a directional signal:
[ S_{\text{sent}} \in [-1, 1]. ]
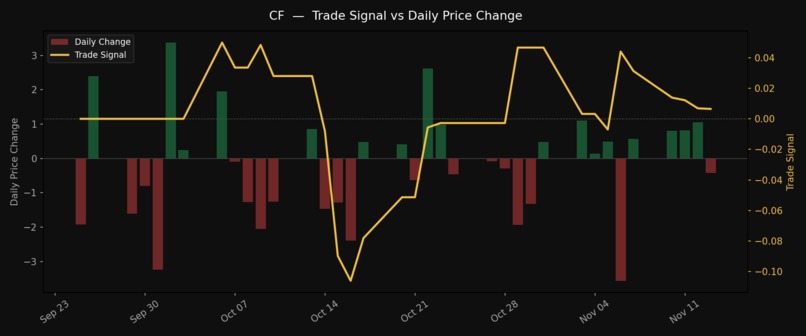
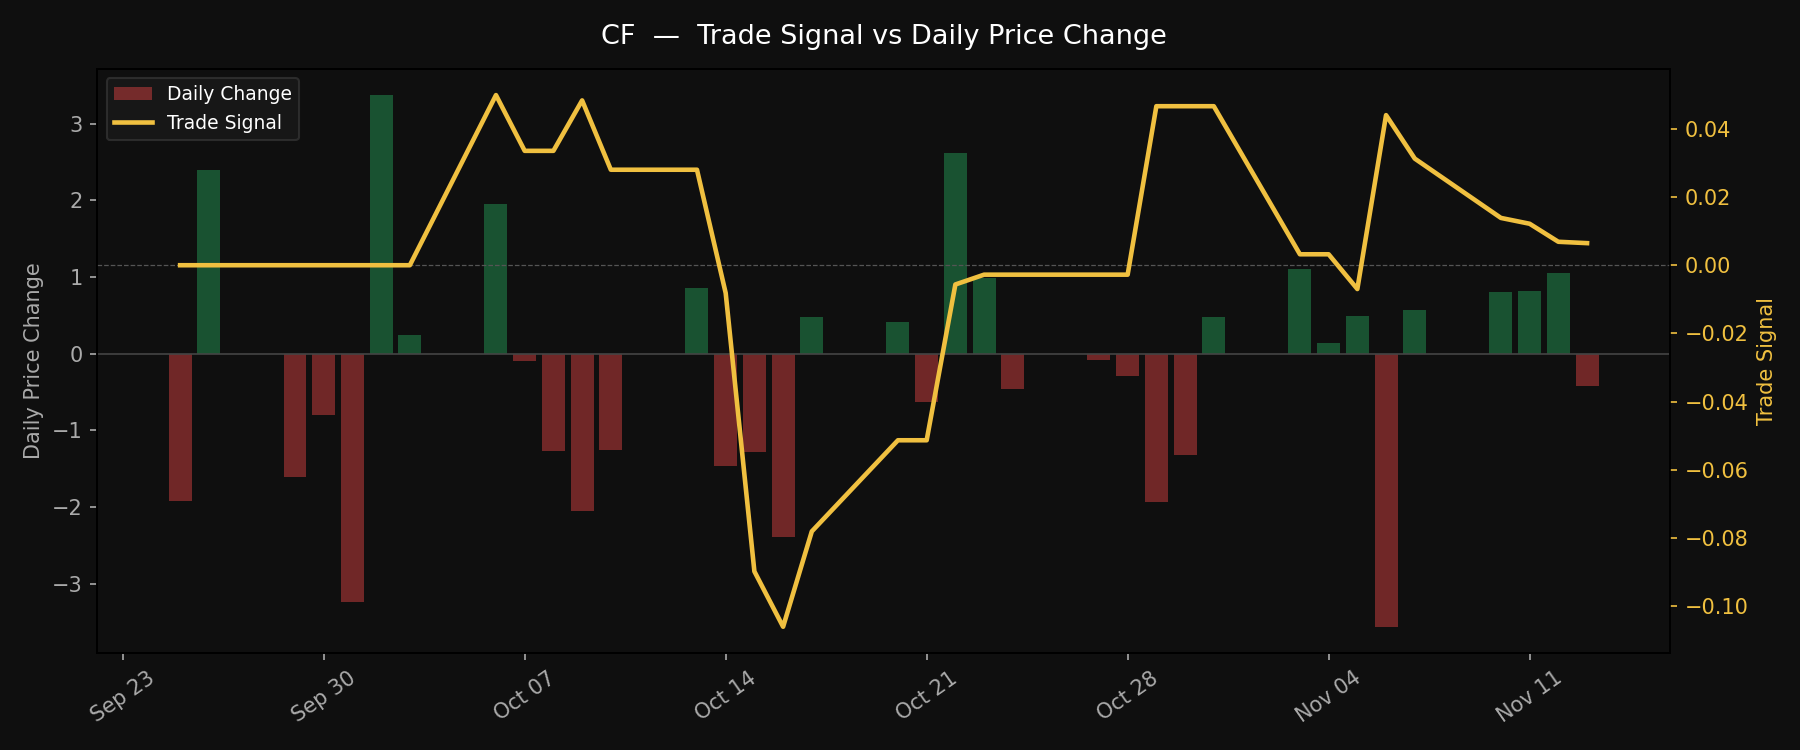
The final trade signal is:
[ \text{Final Trade Signal} = S_{\text{sent}} \times V_{\text{score}} \in [-1, 1]. ]
Functionality and Completion
The project is delivered as a fully functional, end-to-end pipeline giving a clear prediction for future price movement.
High-speed data ingestion.
A compiled Go script polls the Finnhub API for news and stores the data in a compressed Parquet file. Simultaneously, a Python module scrapes Reddit.Physics and NLP engine.
The main Python script loads historical price data, computes the 30/60/120 time-decay probabilities, executes the ( q=0.5 ) Tsallis calculations, and runs FinBERT inference.Actionable verdicts.
The code automatically classifies the asset’s thermodynamic state:- ( FTS < 0.3 ) → SIT OUT.
- ( 0.3 \leq FTS \leq 0.6 ) → MODERATE.
- ( FTS > 0.6 ) → FULL CONVICTION.
Impact and Challenges
This project introduces a novel way to combine physics and human sentiment, helping investors make more informed decisions. They can incorporate this unique way to think about volatility and direction and develop it into potentially a very strong strategy. The novel mathematical concepts are very impactful and exciting, and may be used to develop other strategies or theories.
There were numerous challenges when approaching this project. The largest one was finding the data, in particular organizing the data scraping. It was difficult to find software that could help us, and even then we struggled to access some common websites popular for the sort of task. After hard work, we were able to make it work in many cases, although to develop this further, we would want to access more webpages, in particular Twitter. Another challenge was speed. The program was taking a while to find all the necessary data and then make the required calculations. To improve optimality, we switched to using the language Go for the data scraper. This was quicker than more common languages like Python and helped improve functionality significantly.
To develop the model further, we should include even more data points. There are other data points we didn't have time to consider, such as market-wide volatility measures like VIX. There are also other ways to improve speed, such as using a Taylor approximation for the exponential. Instead of generating the exponential to an unnecessarily high degree of accuracy, it would be more efficient to generate up until around the 4th power term. This works because we were dealing with probabilities which are between 0 and 1, so higher powers tend to zero. We hope you found this an interesting read; we certainly enjoyed researching this!


Log in or sign up for Devpost to join the conversation.