-
-
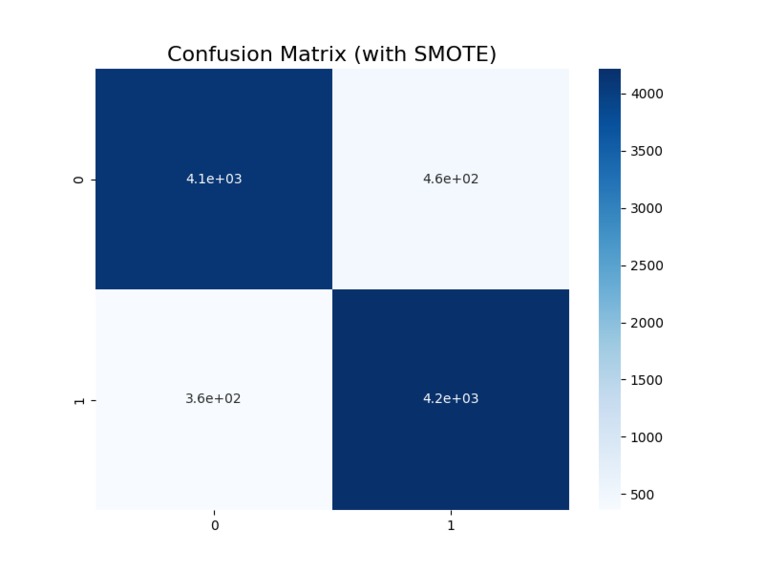
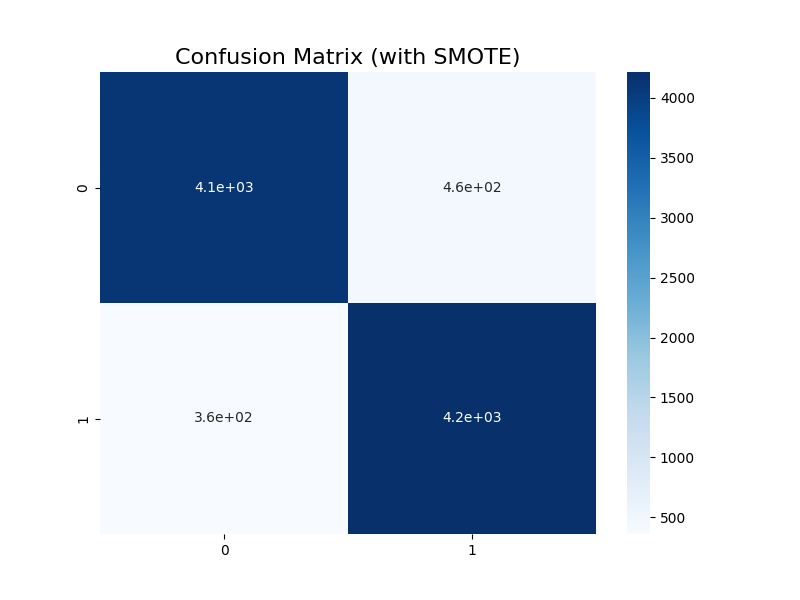
Confusion Matrix for our model after utilizing SMOTE to fix imbalanced data
-

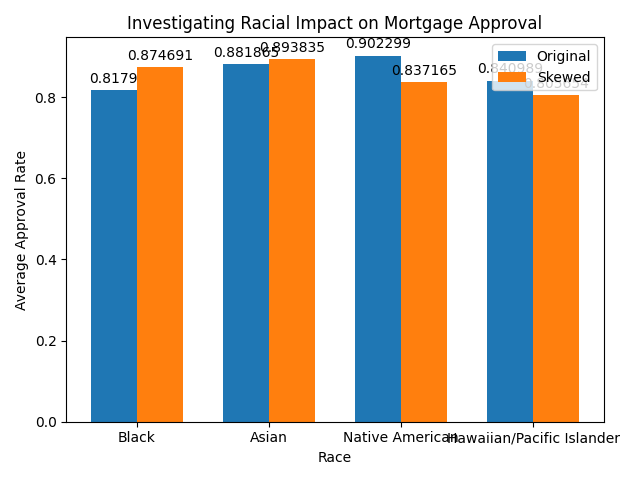
Predicted mortgage approval rates for various races compared to their identical white counterparts
Inspiration
As part of the Beginner's Track, we began investigating factors influencing mortgage approval rates within a dataset for Houston loan approvals in the past year. We noticed a difference in the approval rates for white applicants versus other races, so we worked to first build a logistic regression model to predict whether any particular applicant will be approved or denied.
How we built it
We cleaned up our data using pandas and numpy for Python. We utilized scikit-learn's MinMaxScaler to scale our data values across categories between 0 and 1. We then built our logistic regression model based on the following variables from the dataset: Applicant age, race, ethnicity, sex, income, loan amount, debt to income ratio, combined loan to value ratio, and whether it was accepted or not. Our testing metrics for the initial model had poor precision and recall values for rejected applications.
After looking into this further, we found that our dataset was heavily imbalanced, with only ~12% of applications being rejected. Thus, we sought to use the SMOTE class from imbalanced-learn to oversample our rejected applicant pool and balance our data. This new logistic regression model built on the SMOTE-utilized data pool showed vastly improved overall accuracy as well as precision and recall scores for predicting rejected applications.
Finally, we decided to utilize our model to predict approval for our initial dataset of applicants, categorized by race, before predicting approval for a near-identical dataset with every applicant's race changed to white. By plotting these two sets of predictions, we saw slight increases in approval rates for Black and Asian applicants, whereas we saw slight decreases in approval rates for Native American and Hawaiian/Pacific Islander applicants.
Our interpretation of these findings is that they are far from conclusive, as we would need to more systematically investigate whether there is bias in the variables our model is built off and if we can improve the model. Furthermore, many populations represent a minority group within the dataset, for example, Native American and Hawaiian/Pacific Islander applicants were vastly fewer in number compared to Black and Asian applicants, which were even fewer in number compared to White applicants. Additionally, our model does not differentiate between non-Hispanic or Latino White applicants versus Hispanic or Latino White applicants, which may introduce another level of bias. However, we believe that these findings may be indicative of more conclusive trends if our model could be honed and improved.
Built With
- numpy
- pandas
- python
- scikit-learn
- seaborn
- smote


Log in or sign up for Devpost to join the conversation.