-
-

Intro Page
-
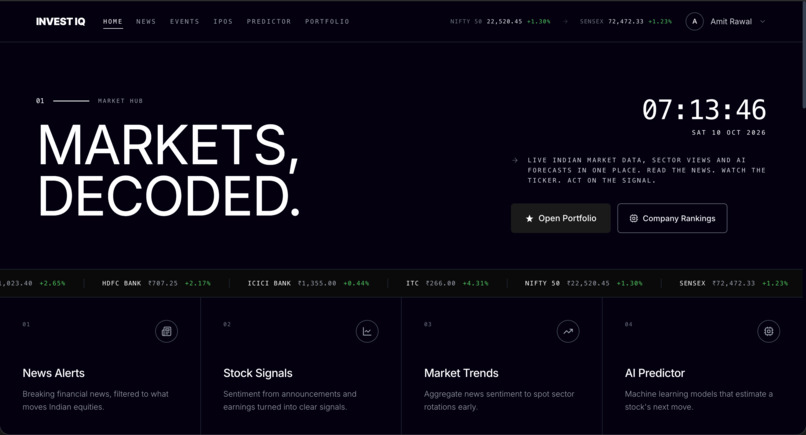
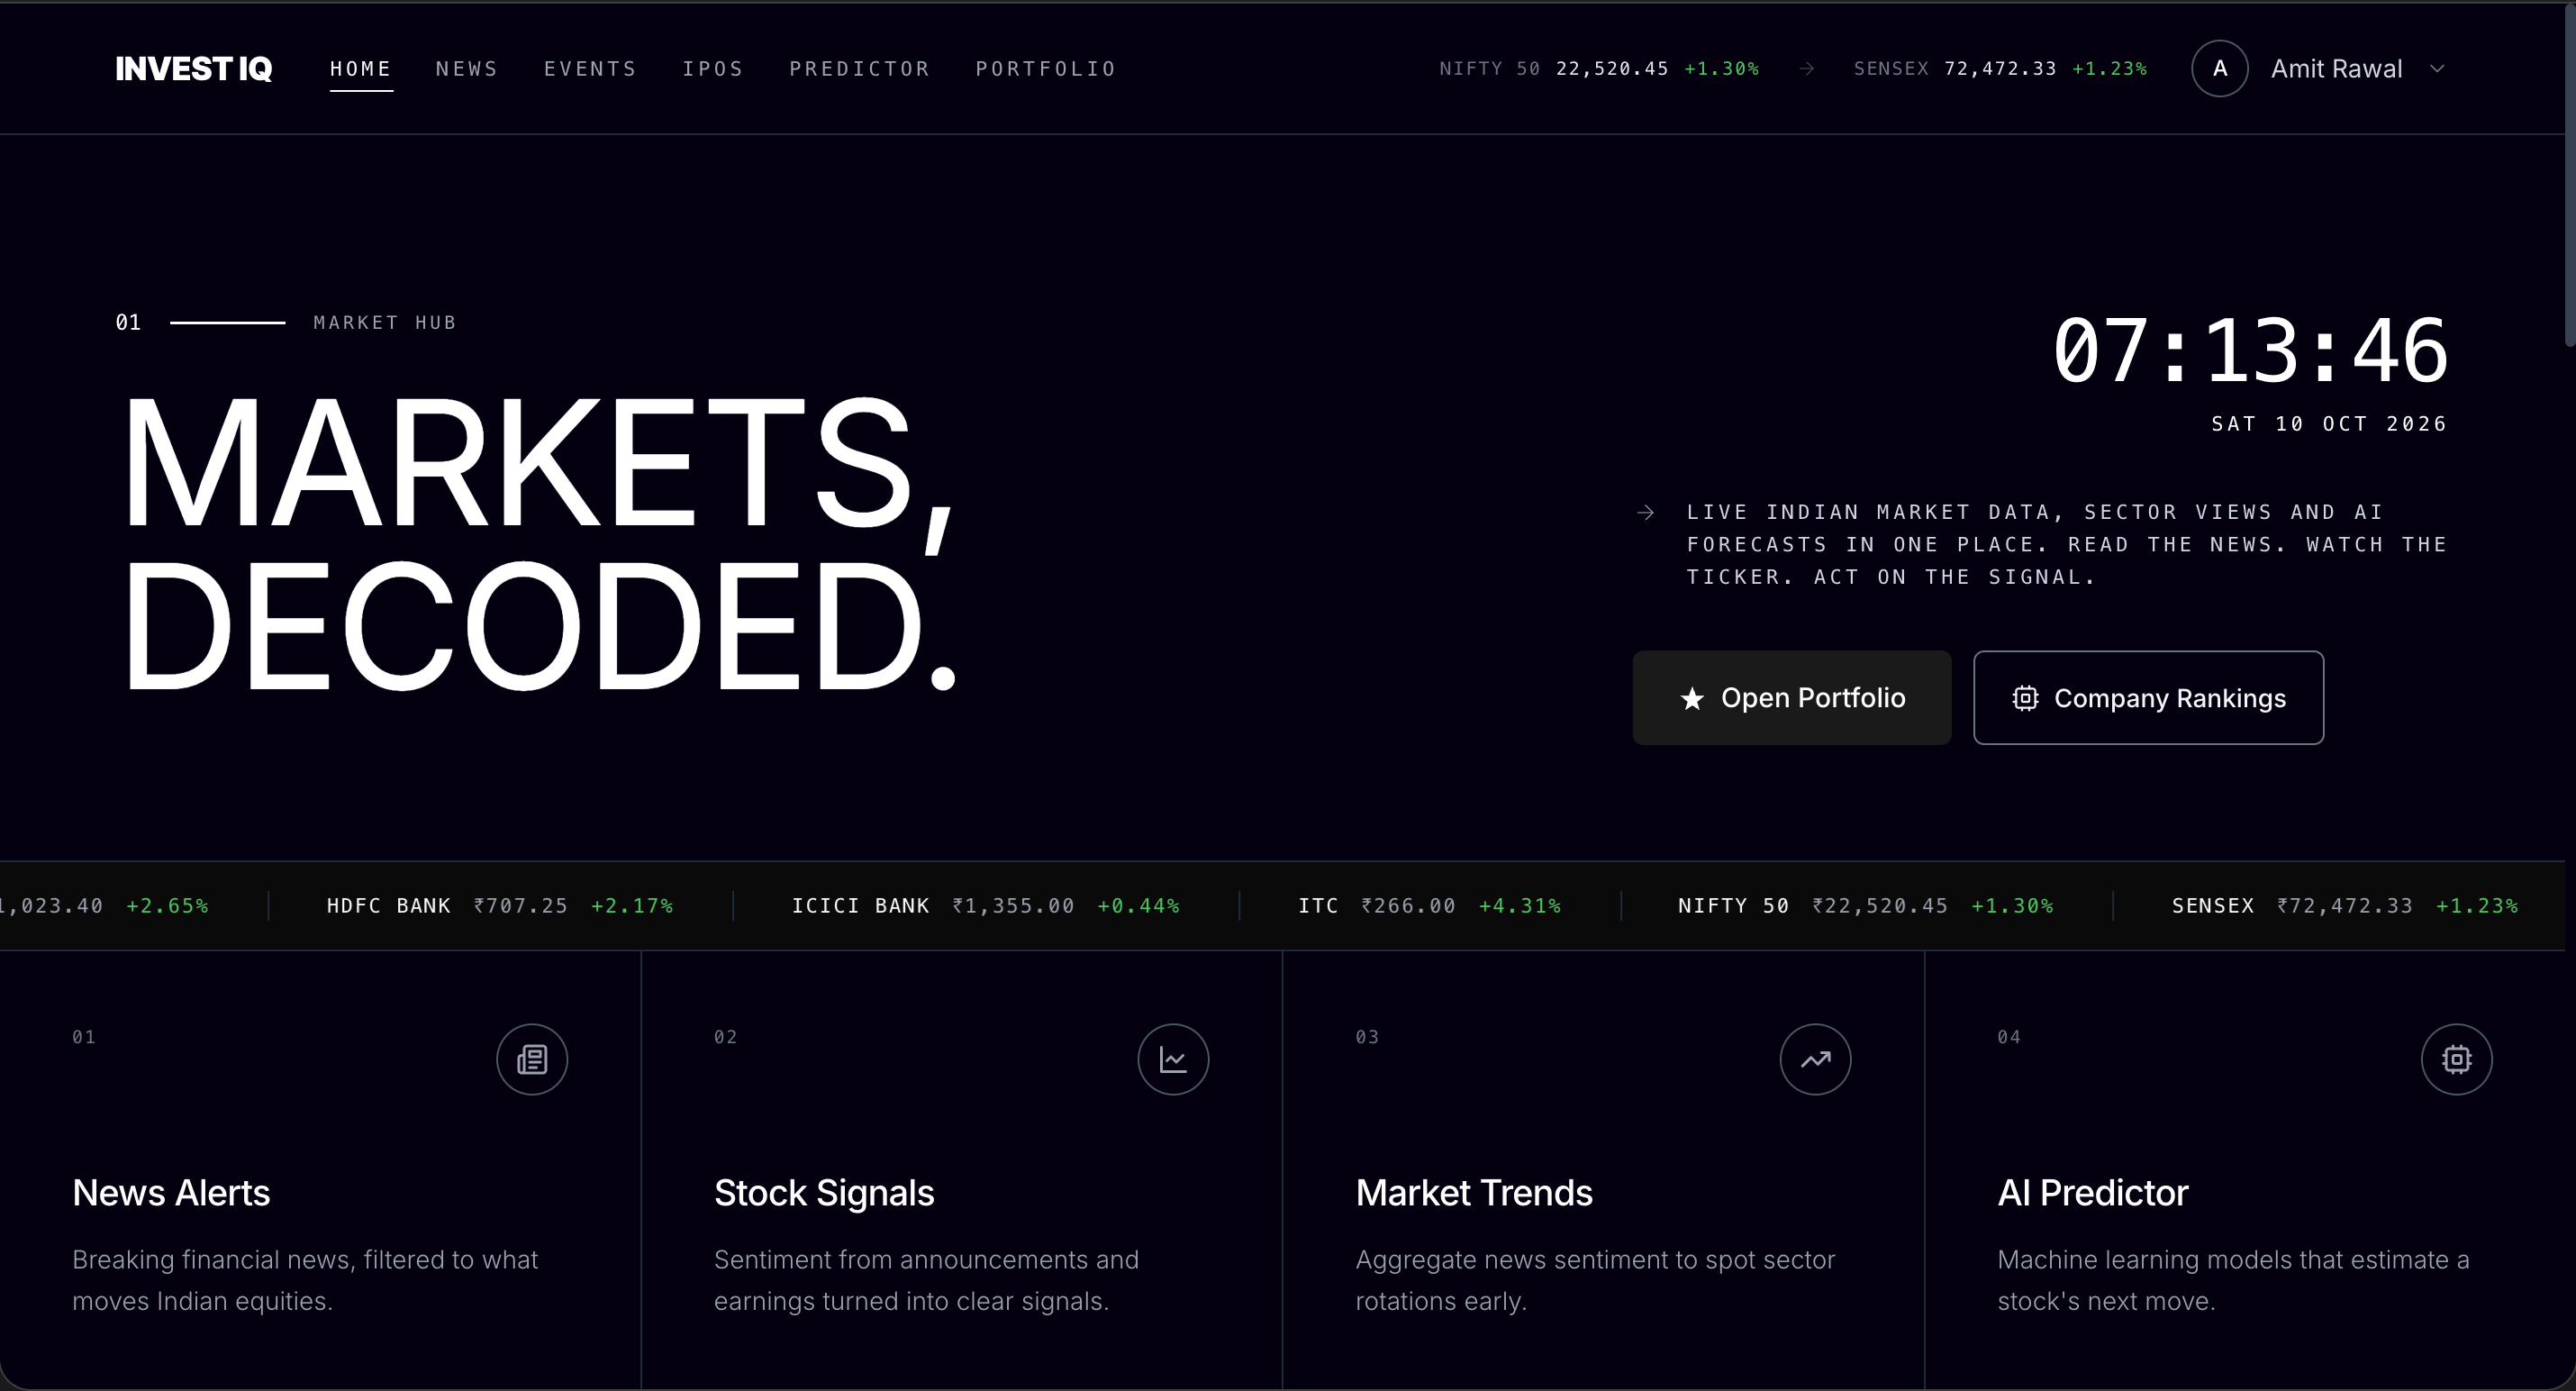
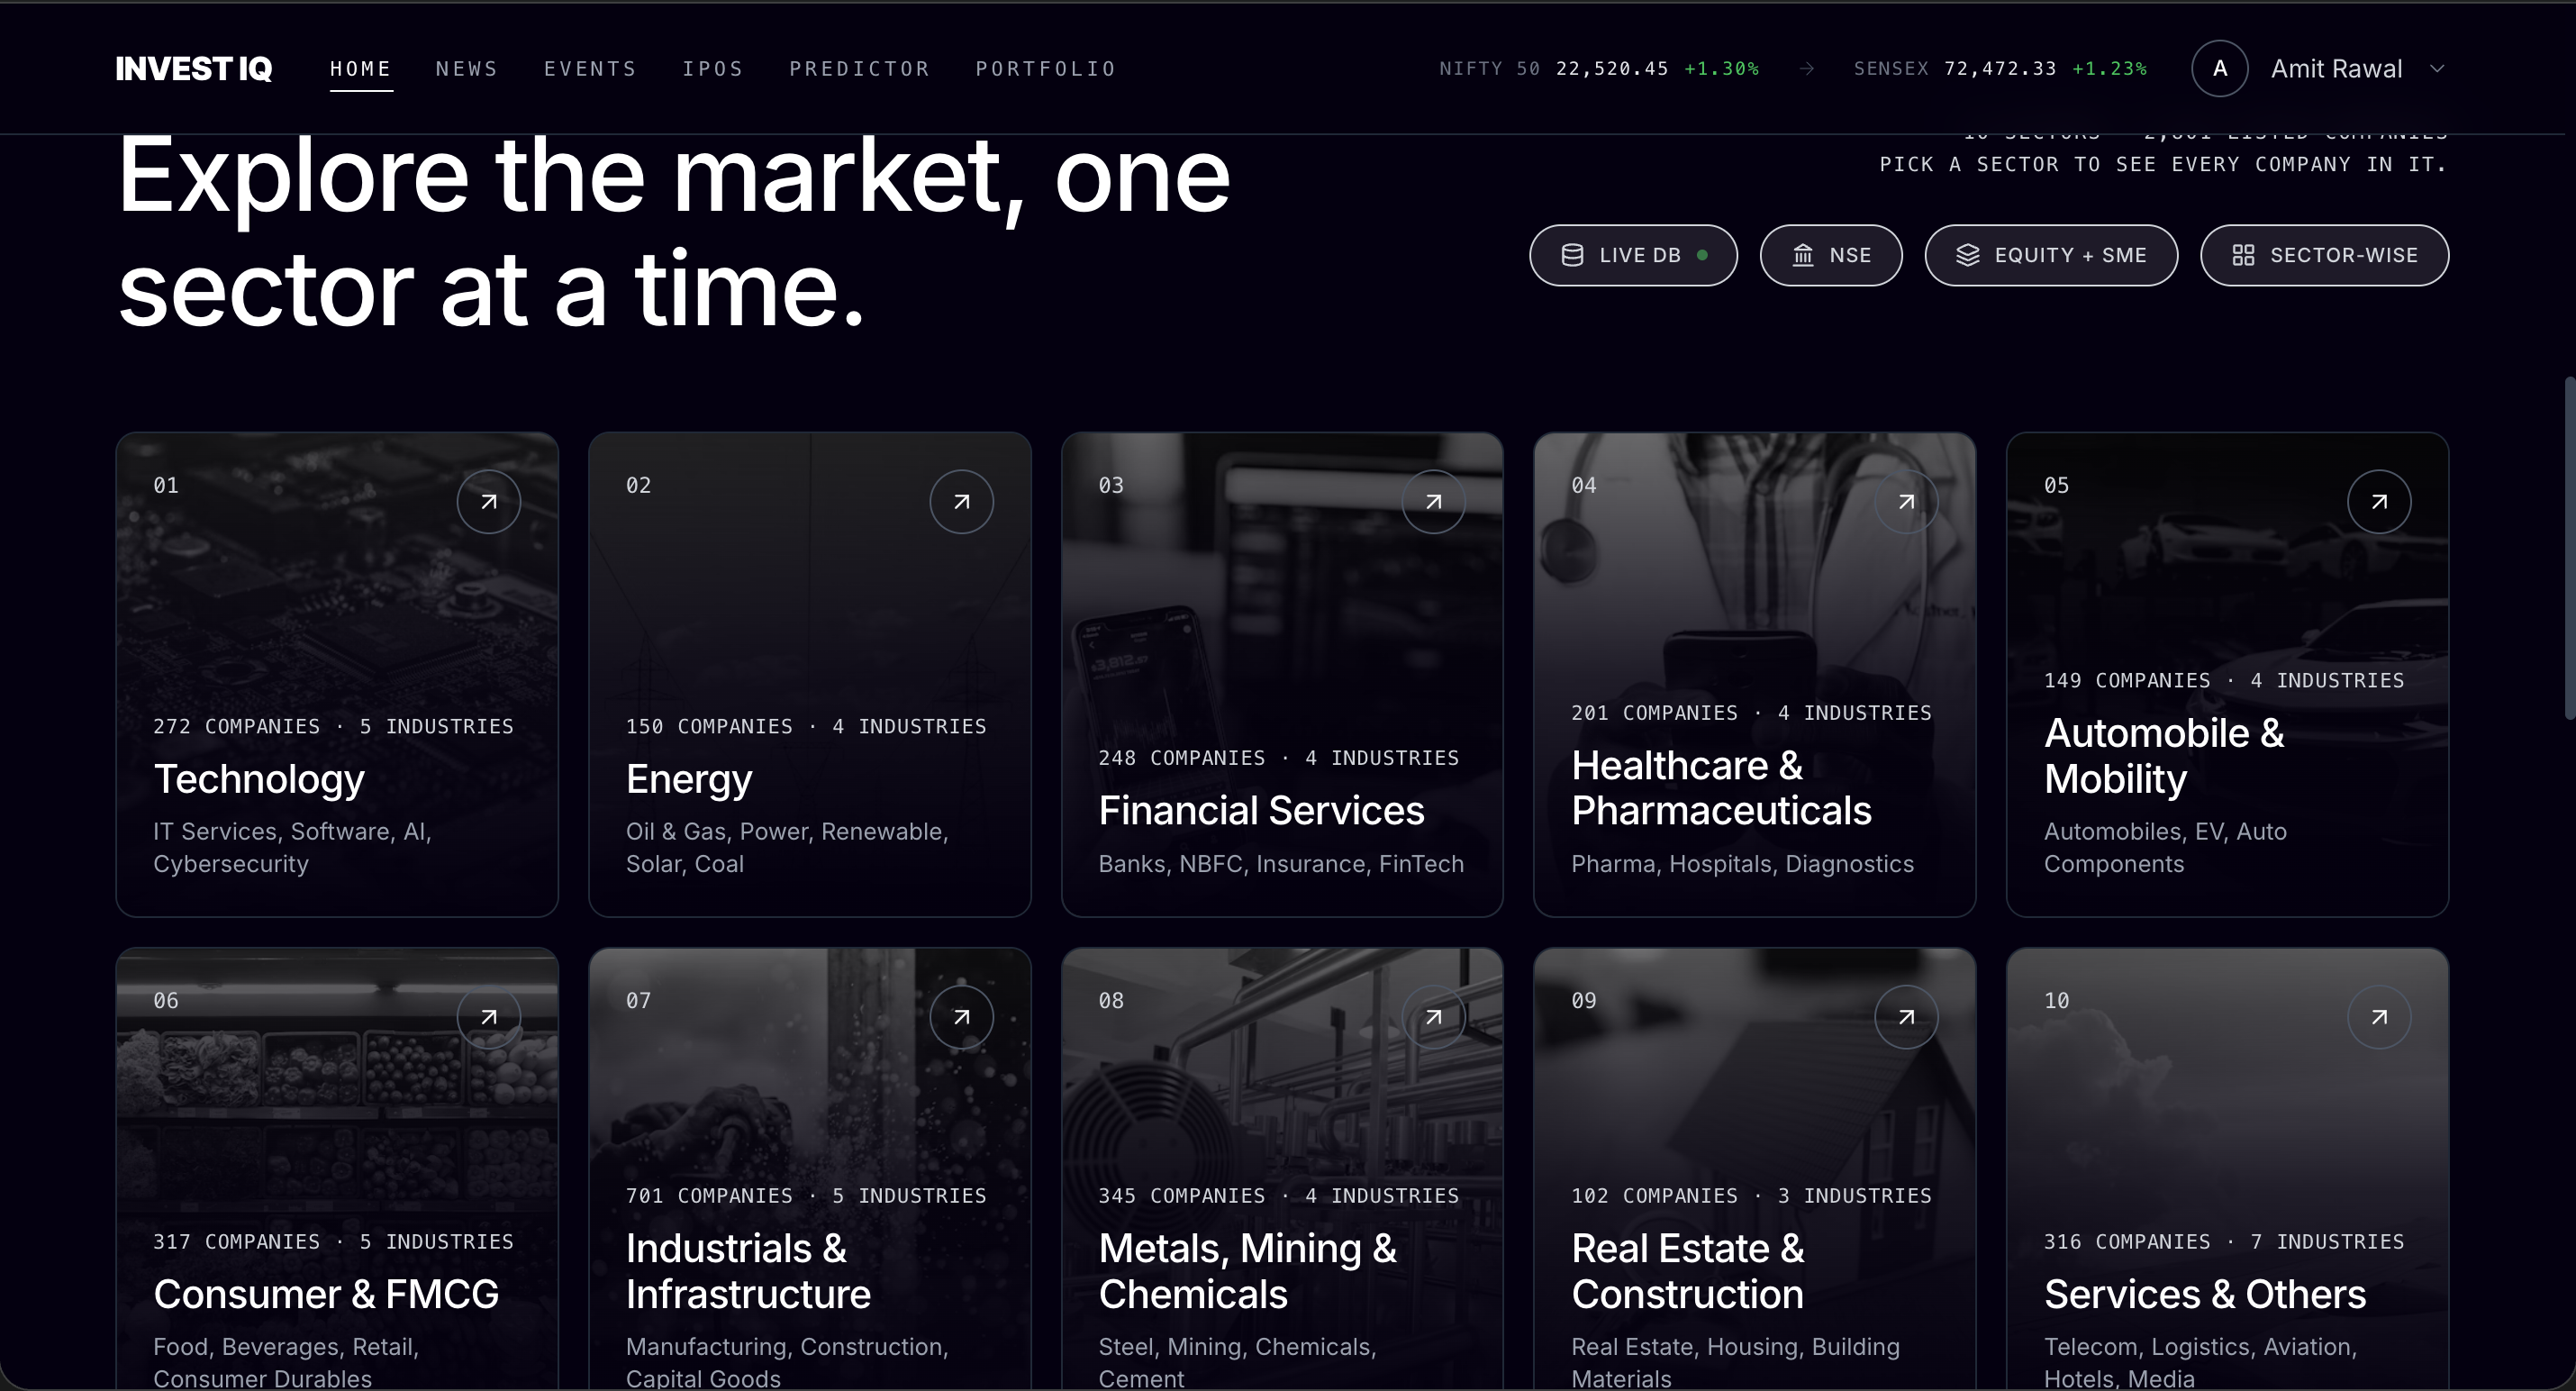
Home Page : live IST clock, market ticker and 3,100+ NSE companies grouped into 10 sectors and 45 industries
-
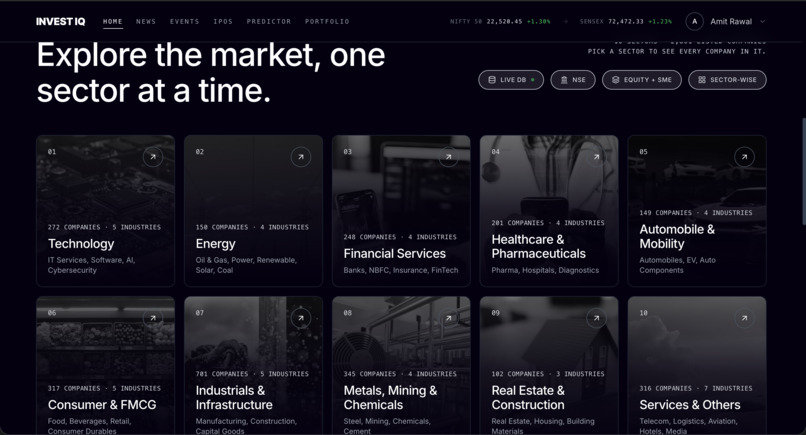
All companies: 3,100+ NSE-listed companies organised as Sector → Industry → Company, across 10 sectors and 45 industries
-
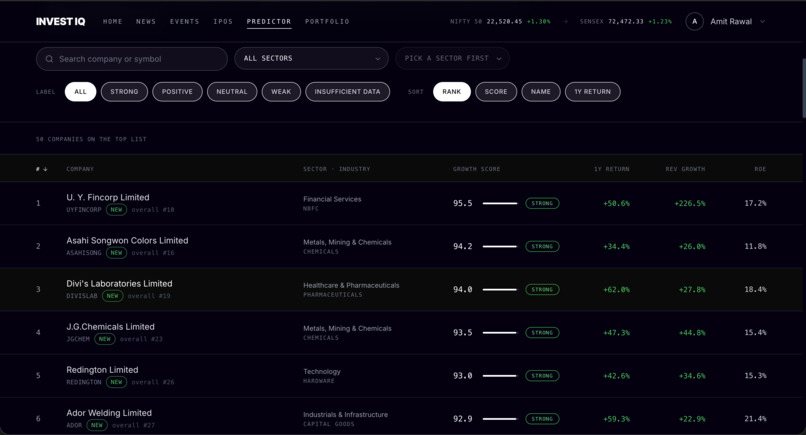
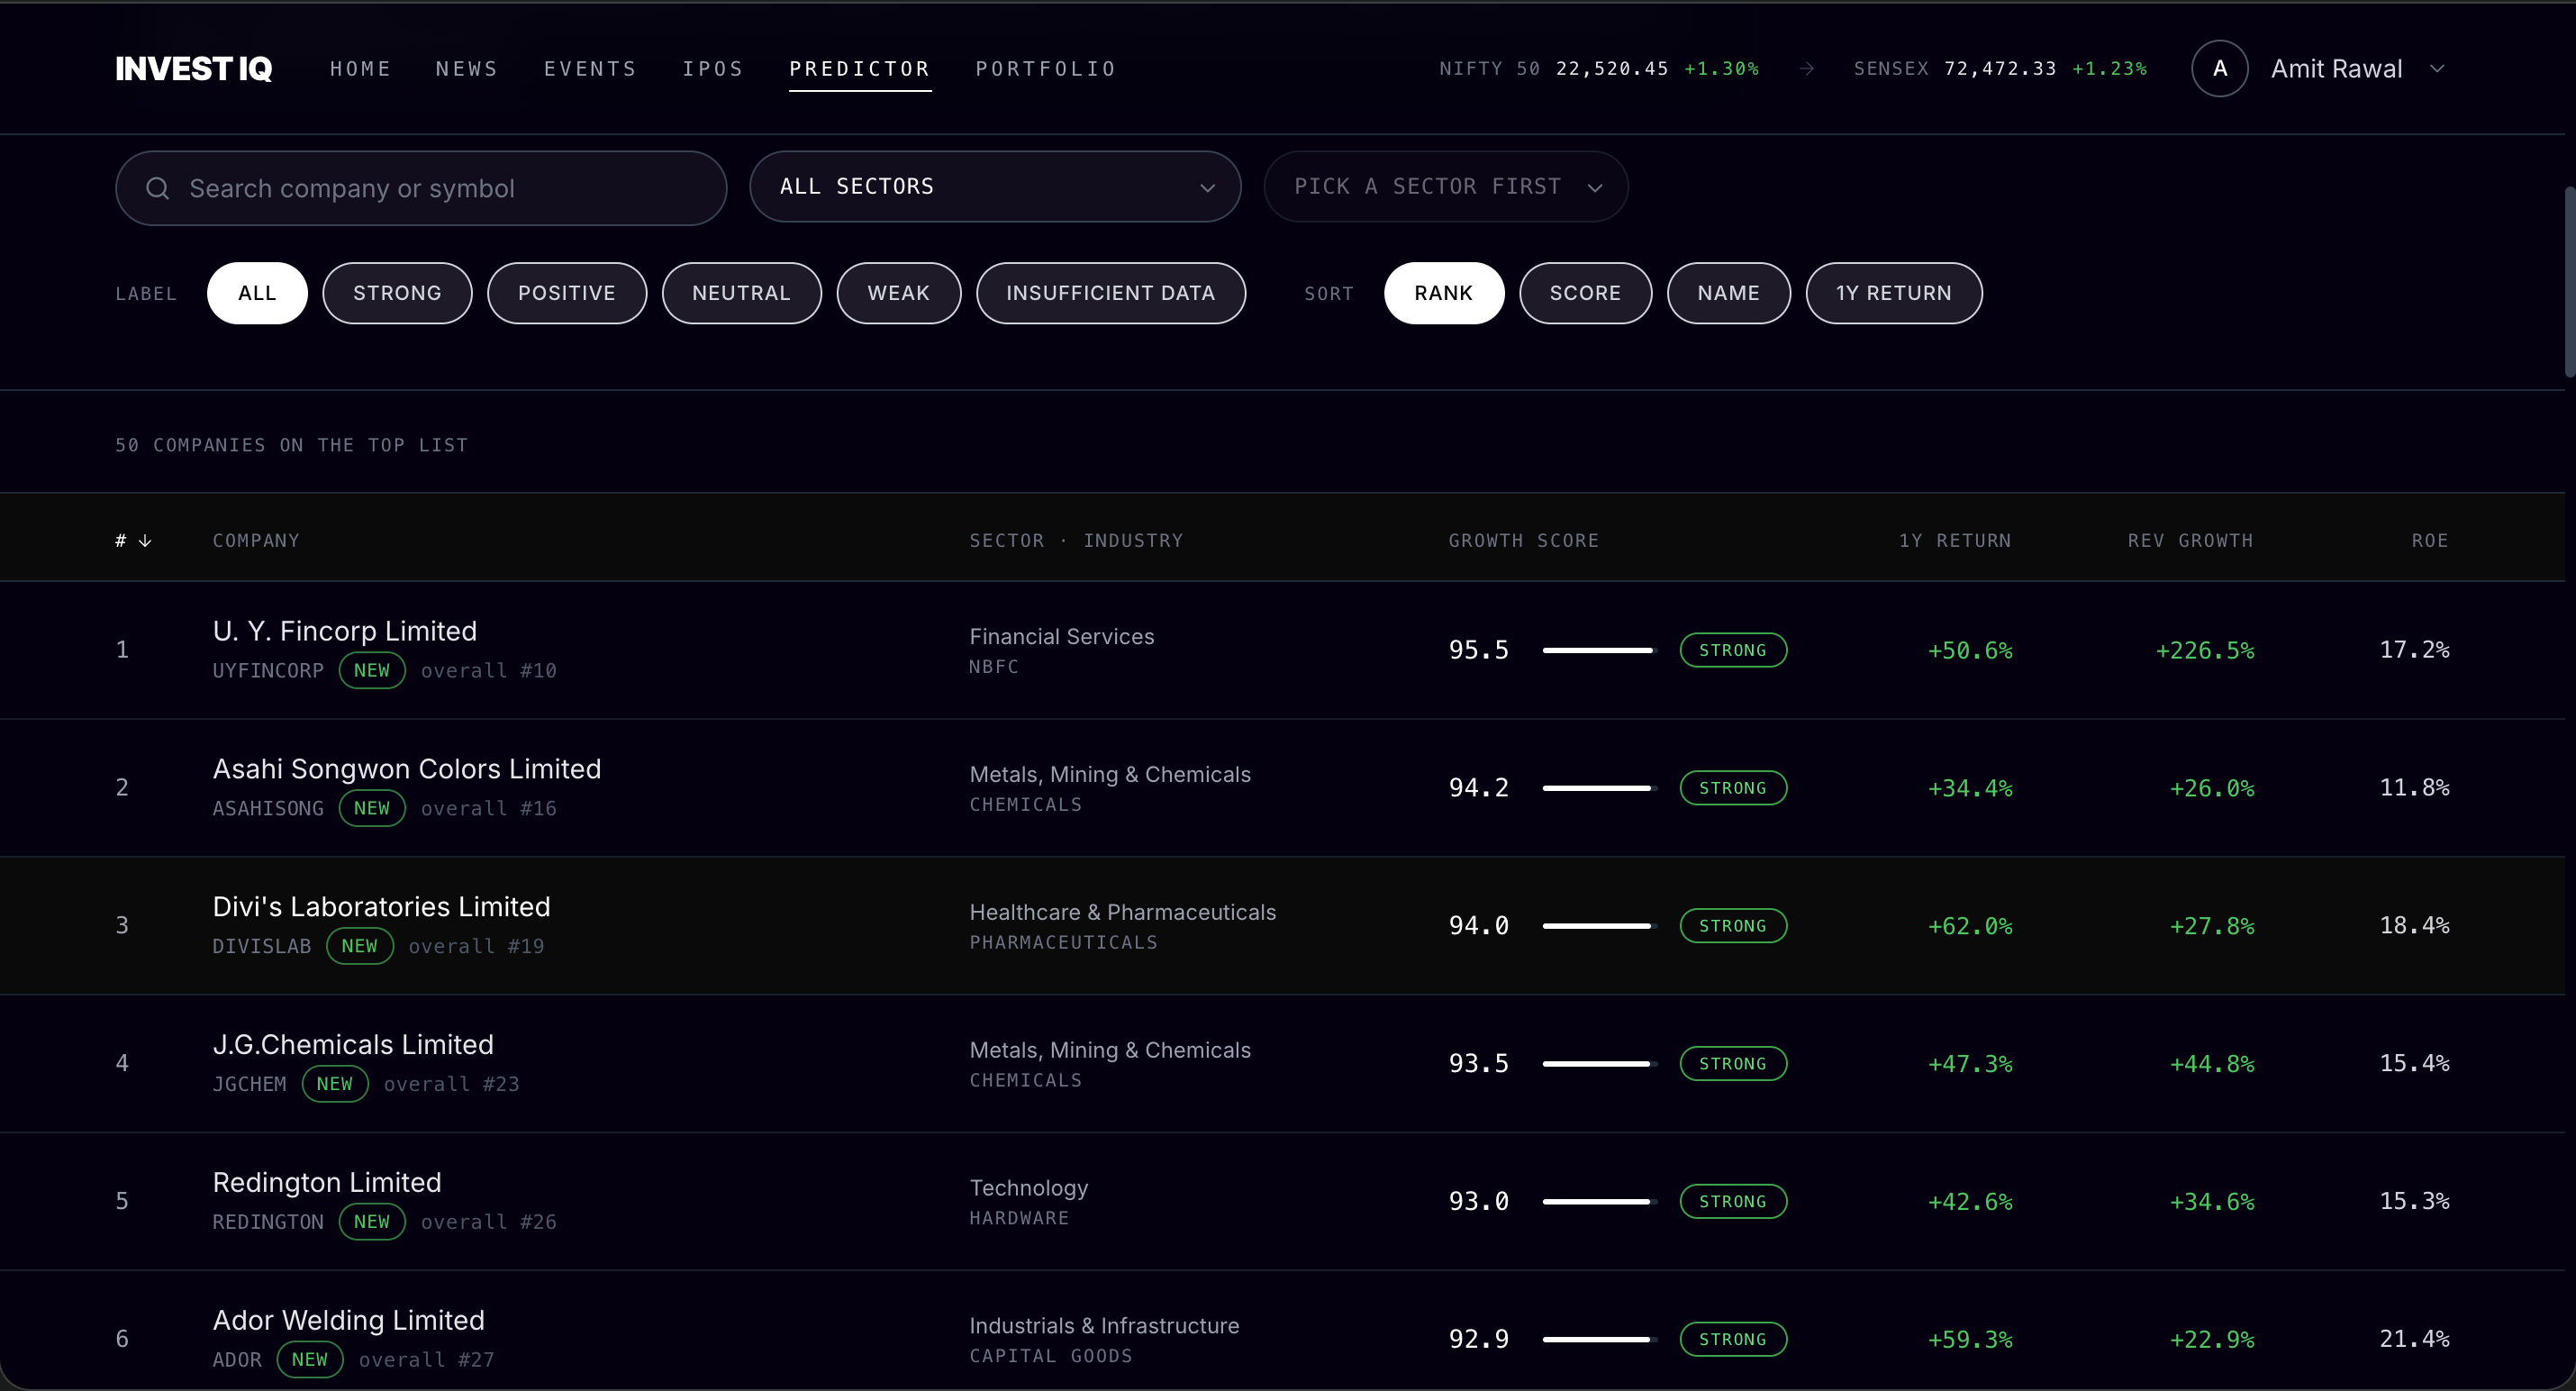
Predictor: every company gets an AI growth score (0-100) and a Strong / Positive / Neutral / Weak label
-
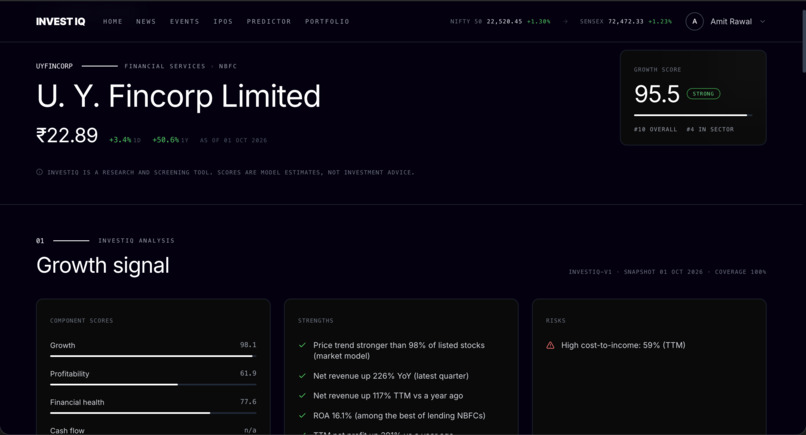
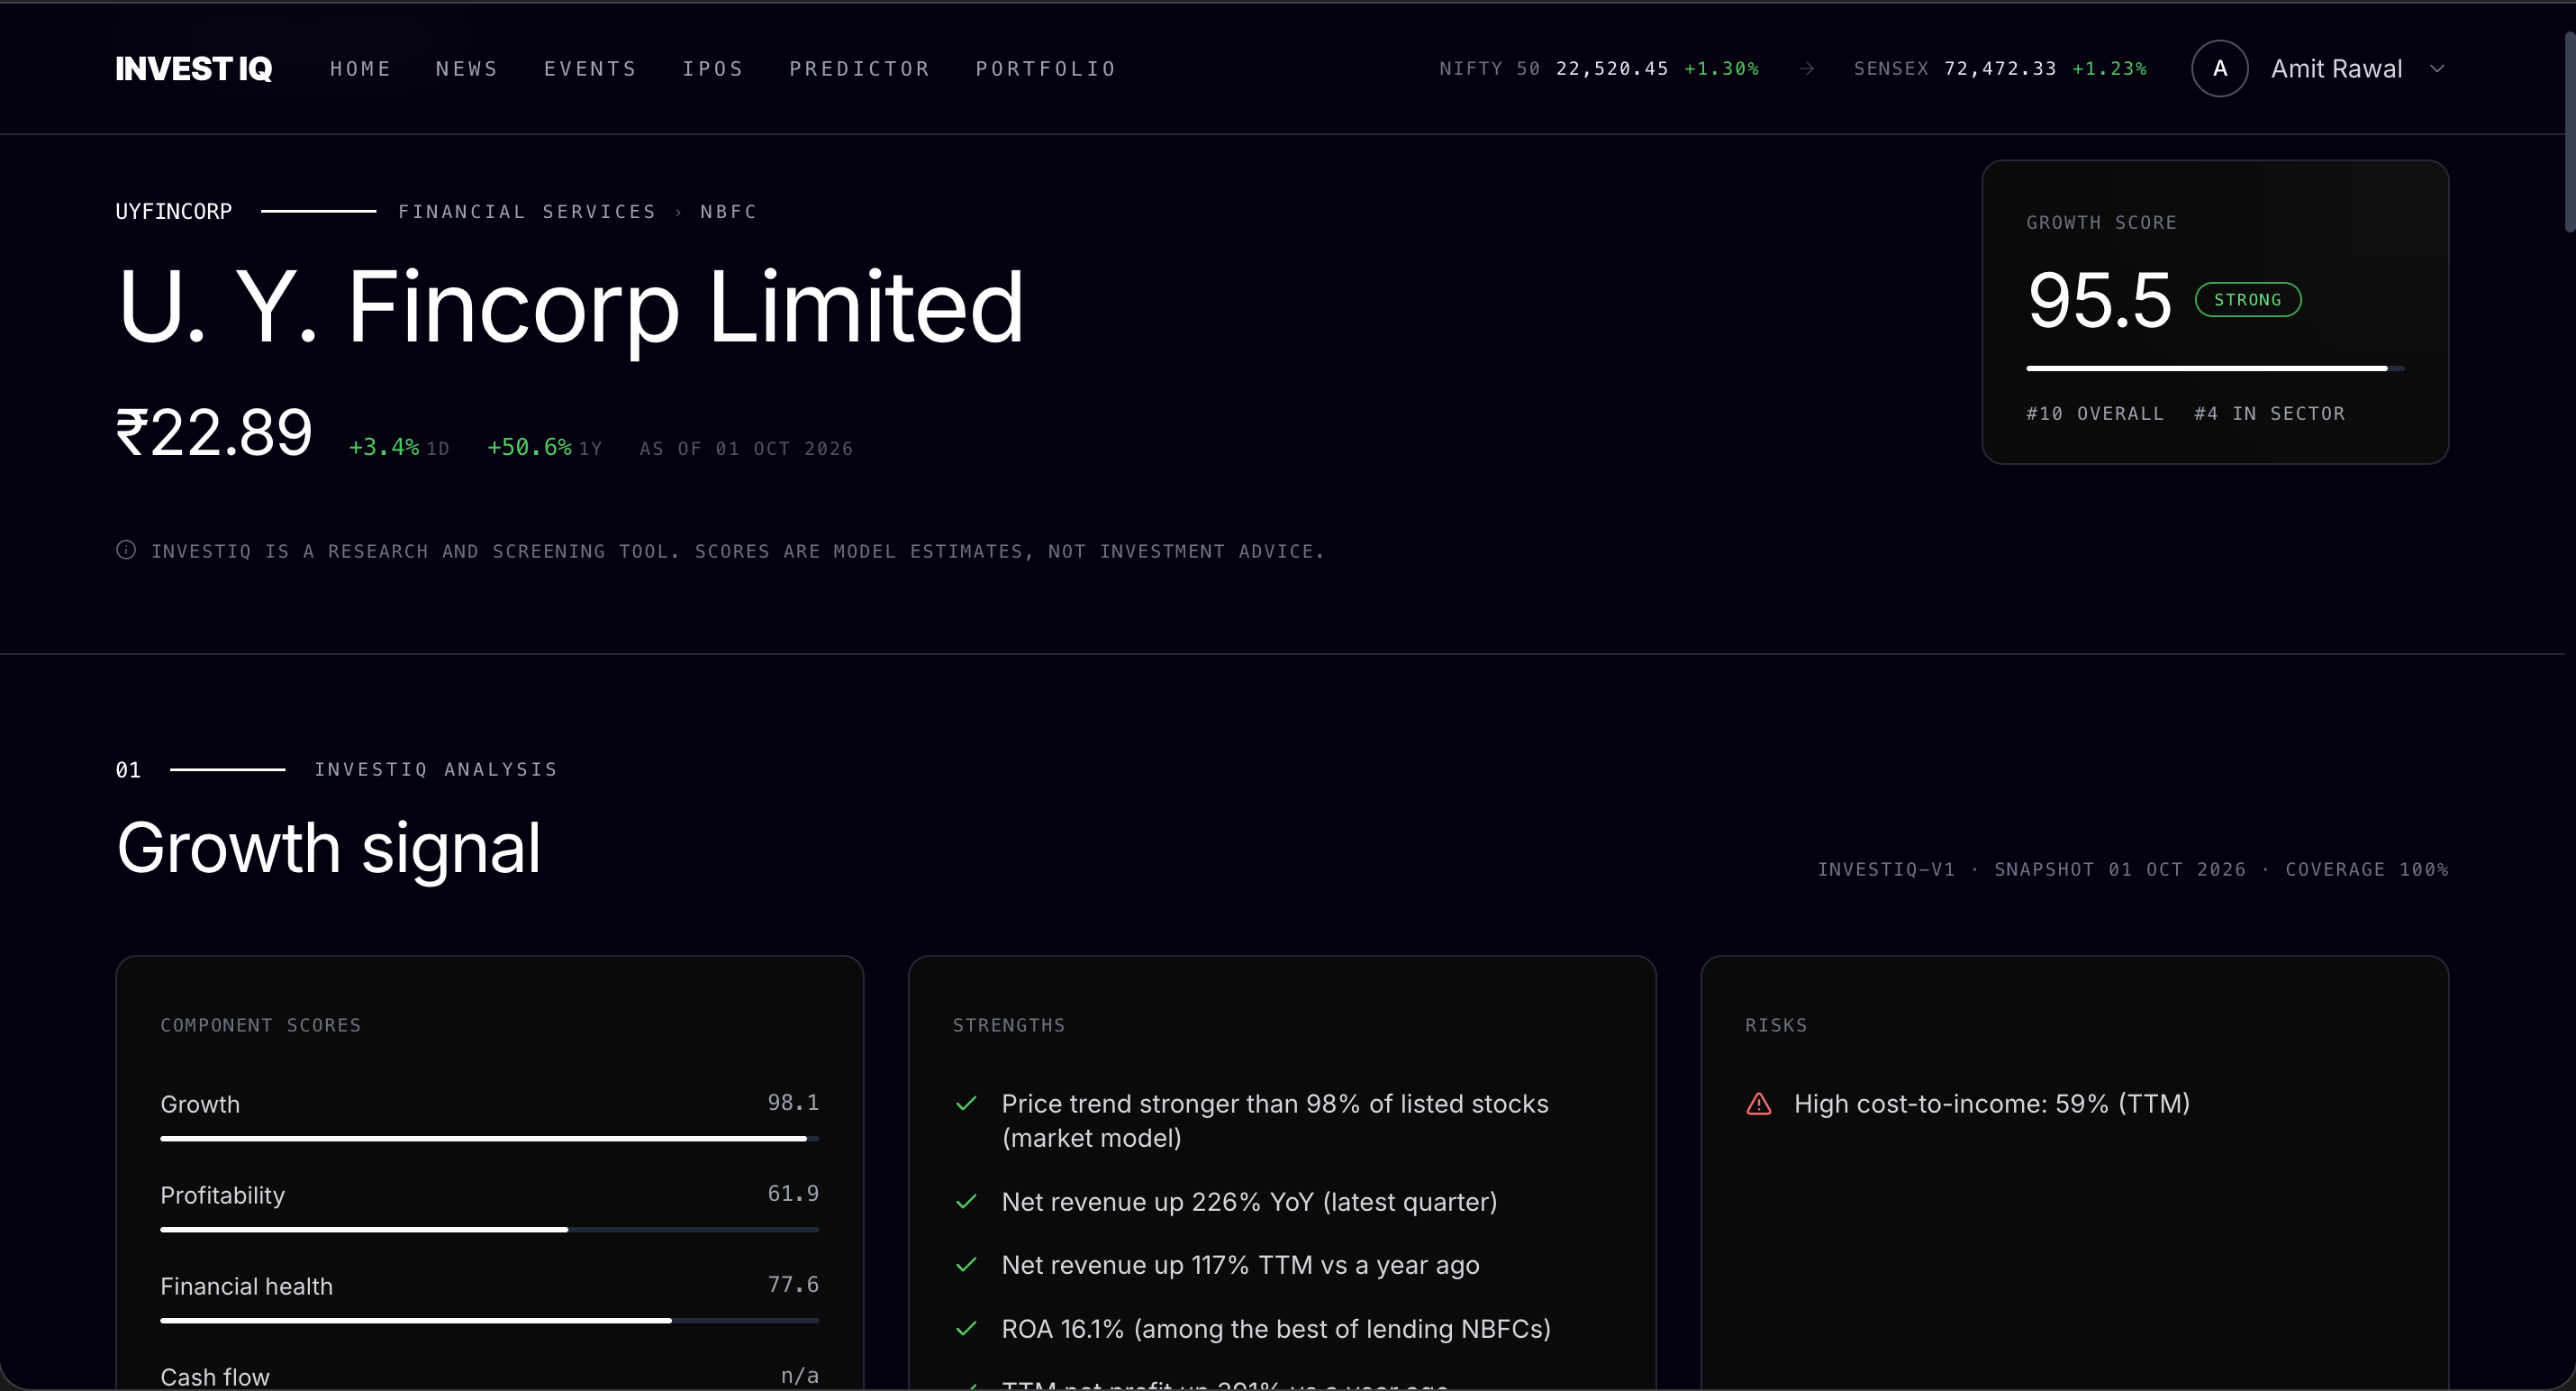
Company page: score with strengths and red flags, price vs NIFTY Smallcap 250, results, balance sheet and news
-
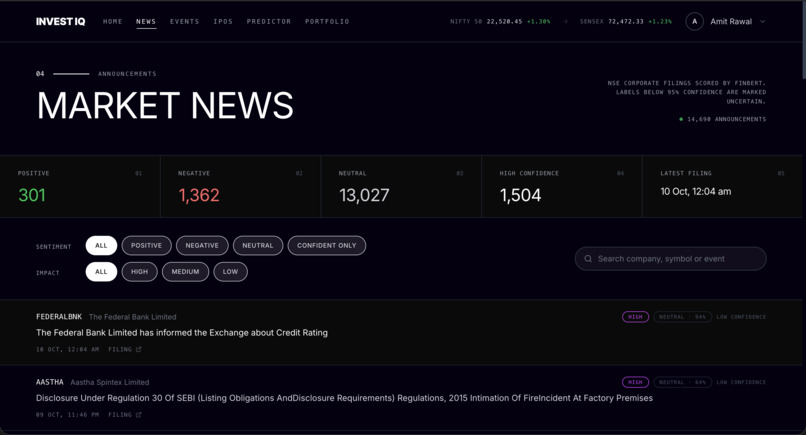
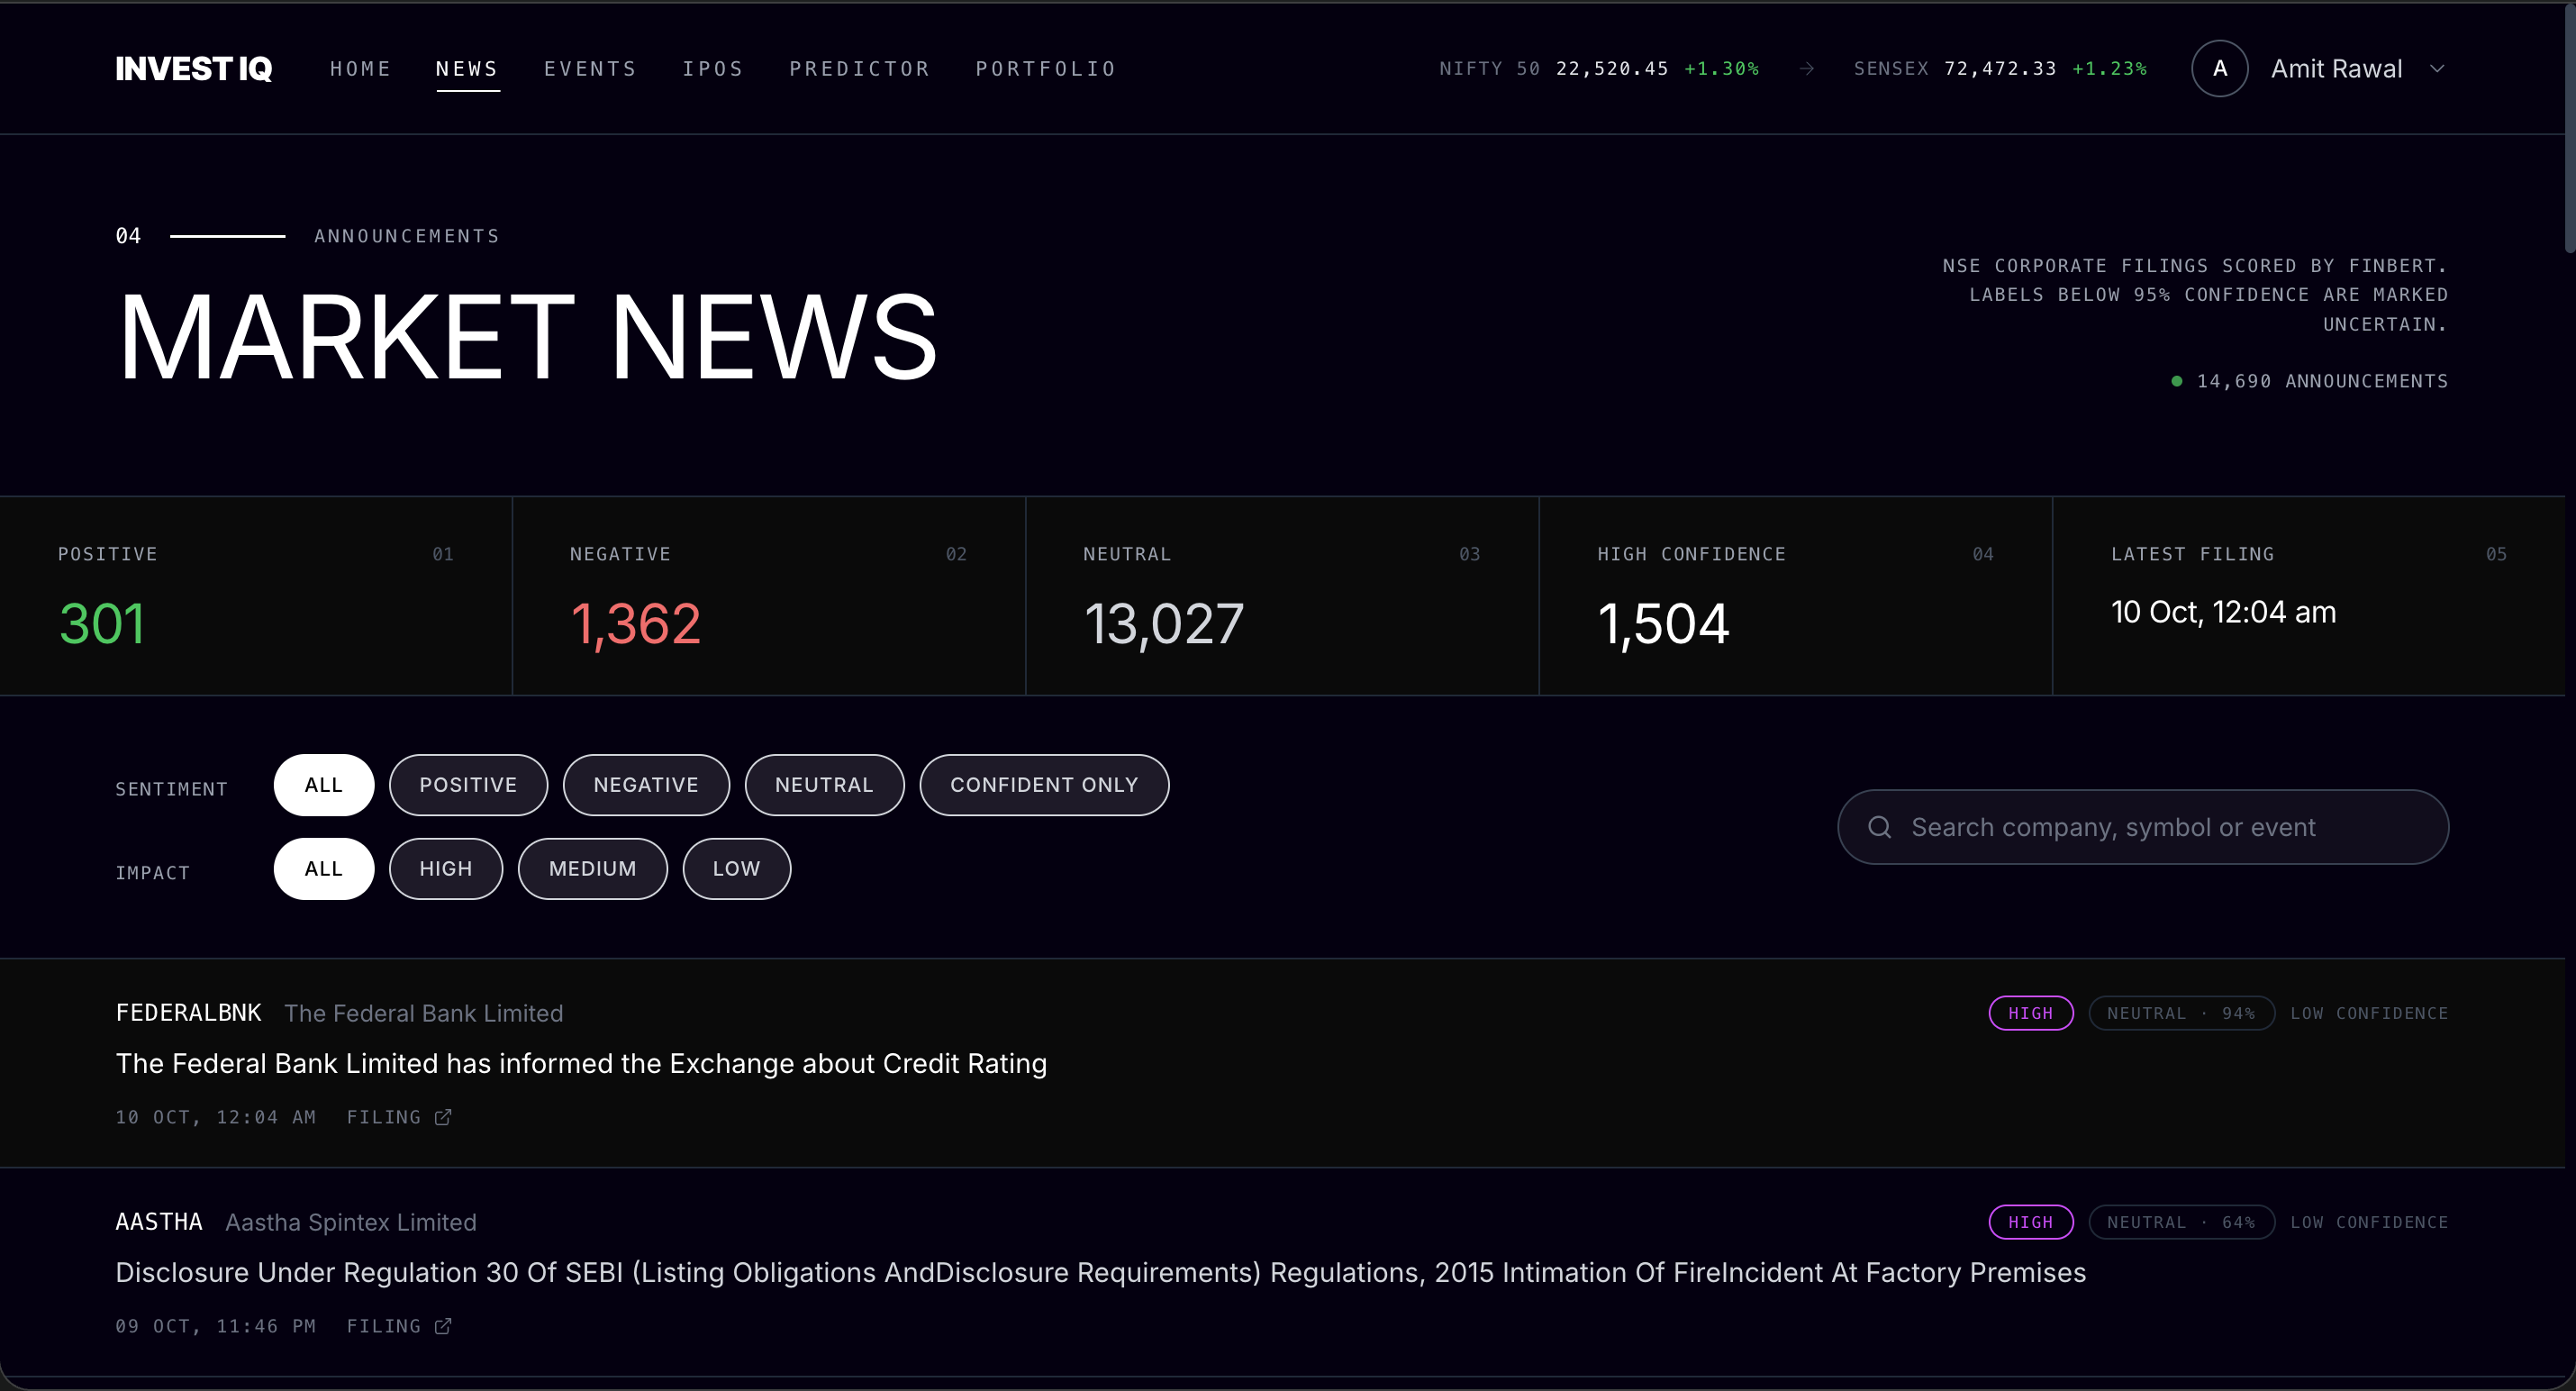
Market News: NSE announcements every 15 minutes, each tagged positive, negative or neutral by FinBERT
-
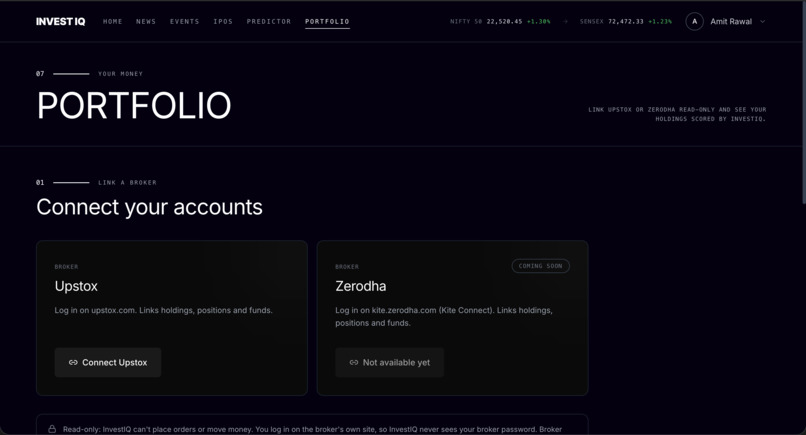
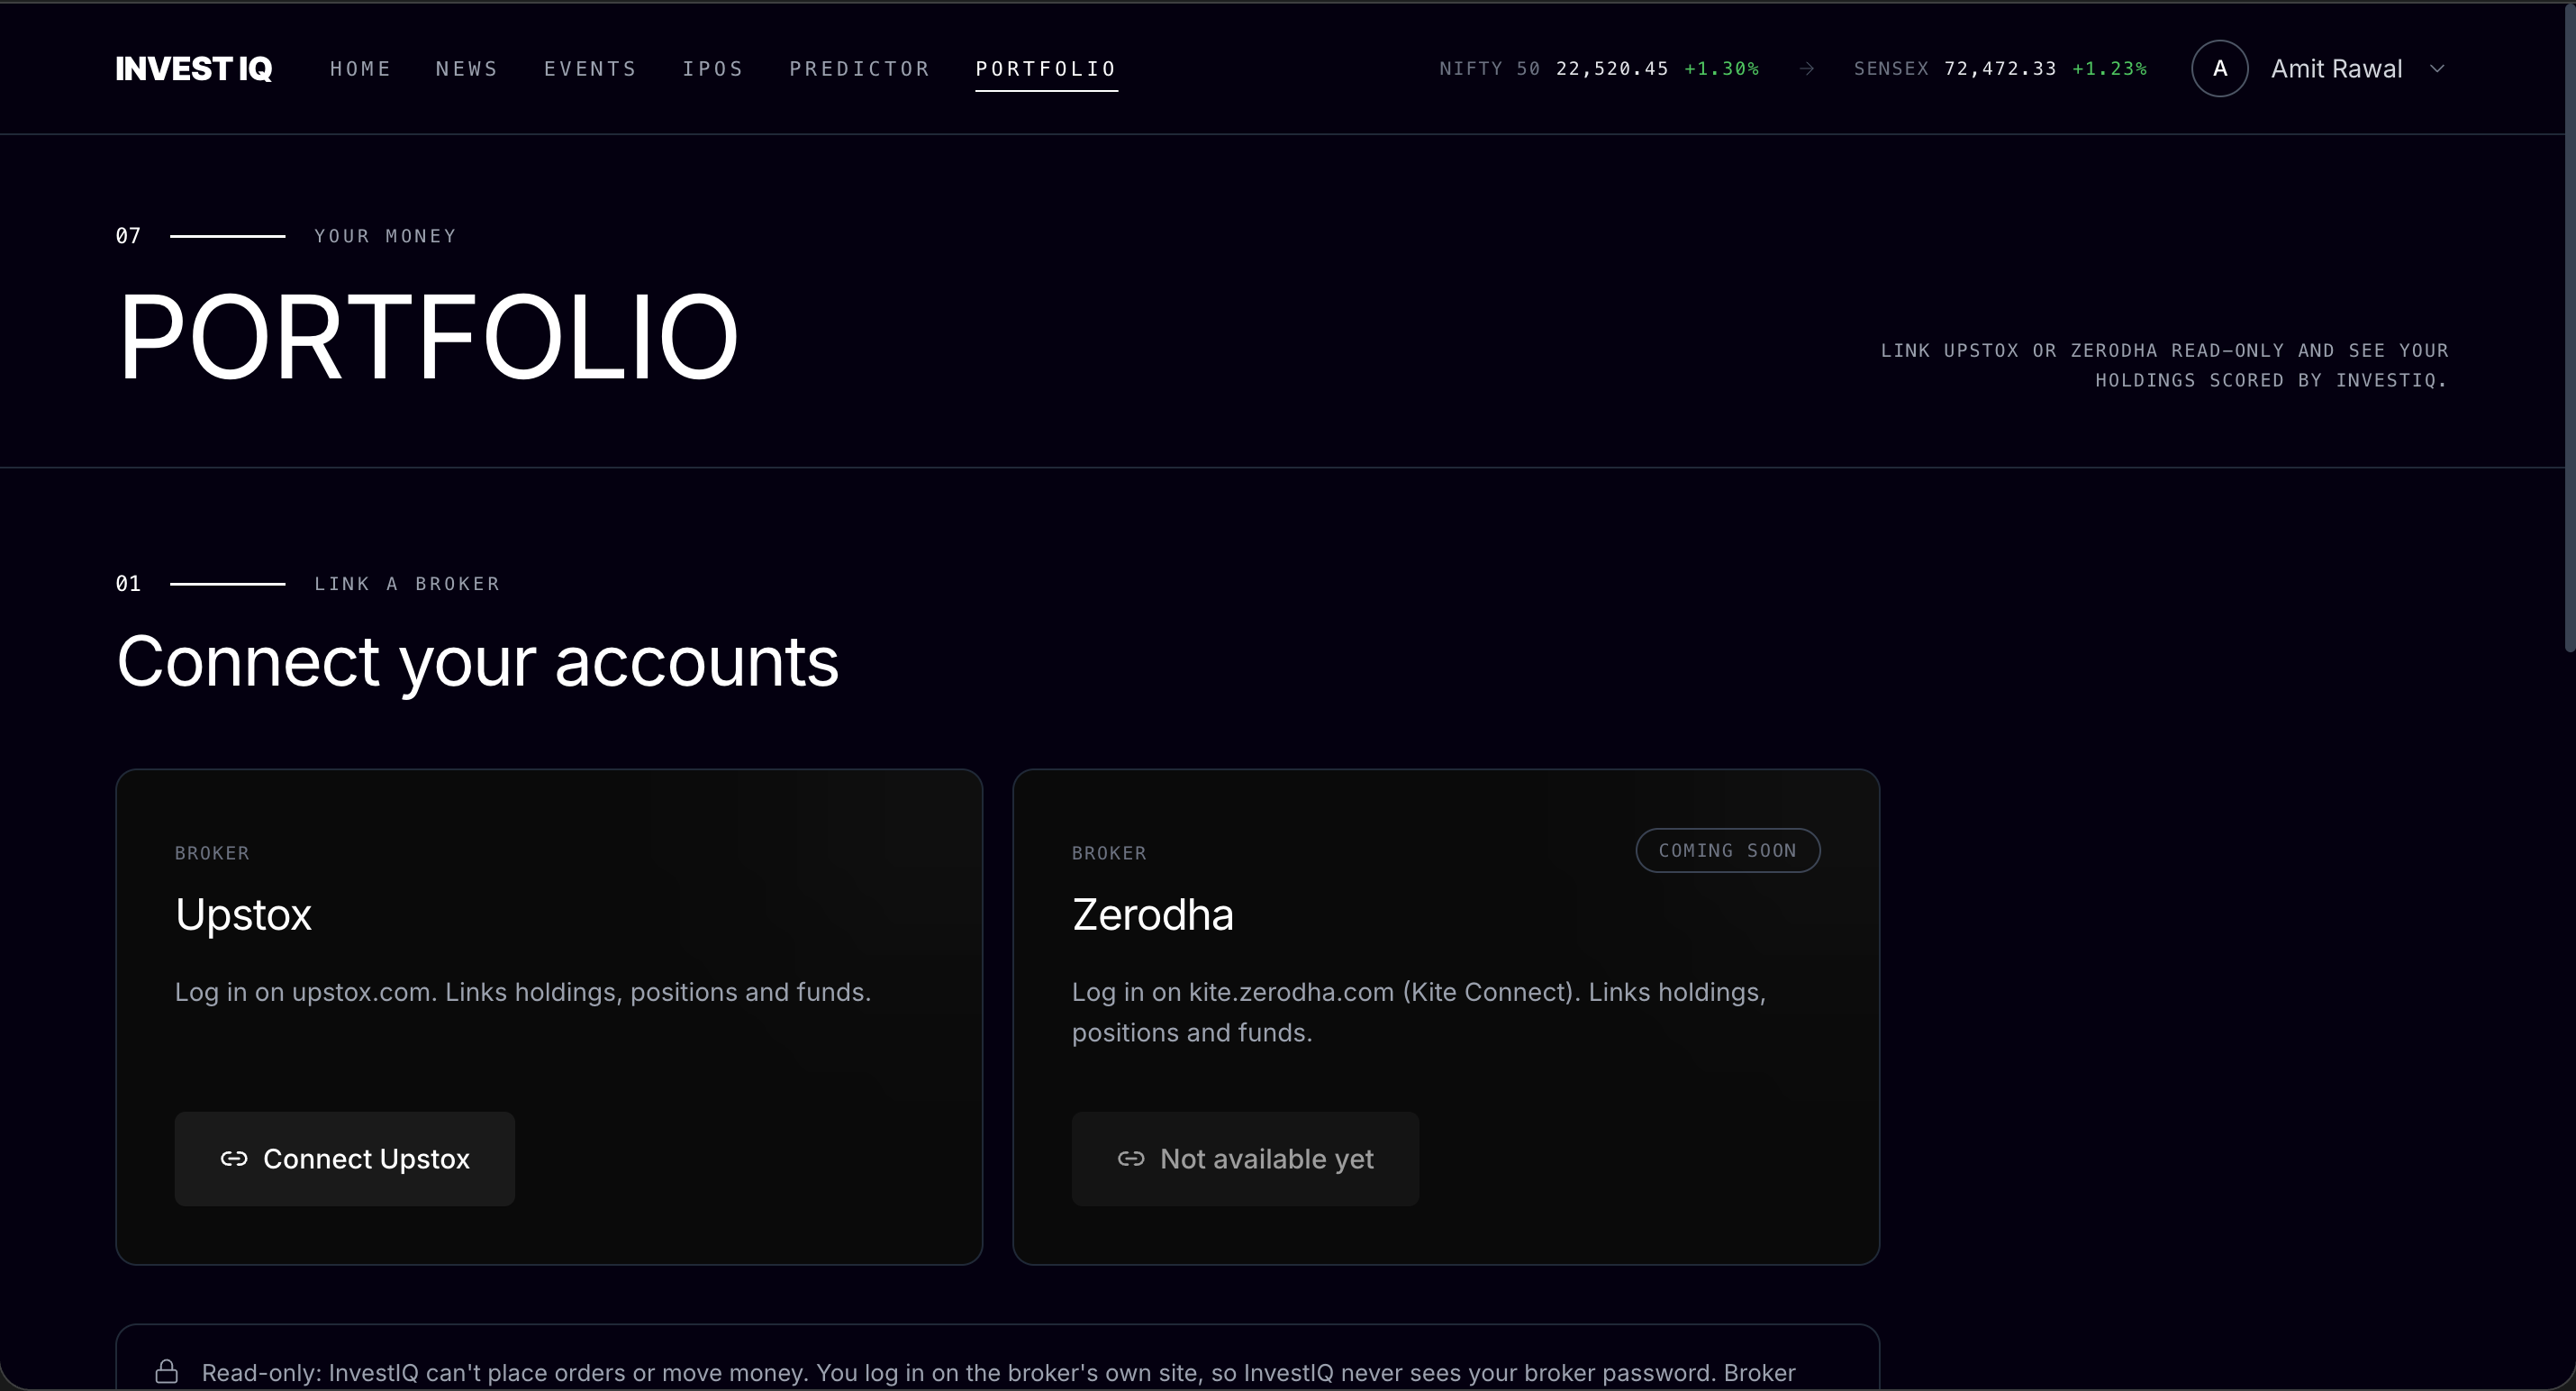
Portfolio: link Upstox or Zerodha (read-only) to see an InvestIQ score for every holding
-
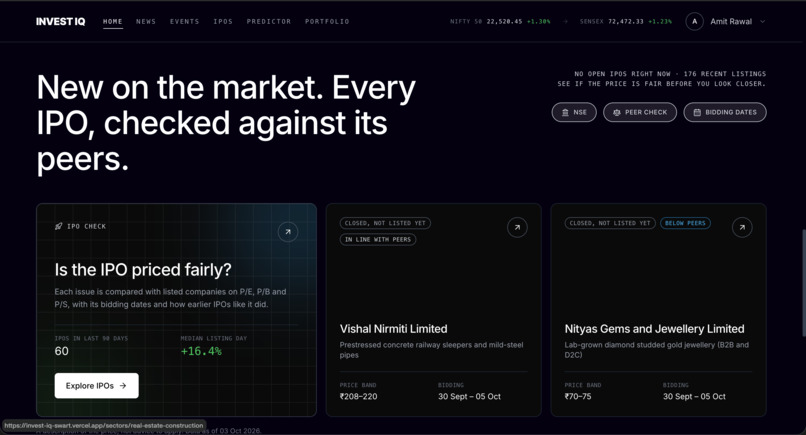
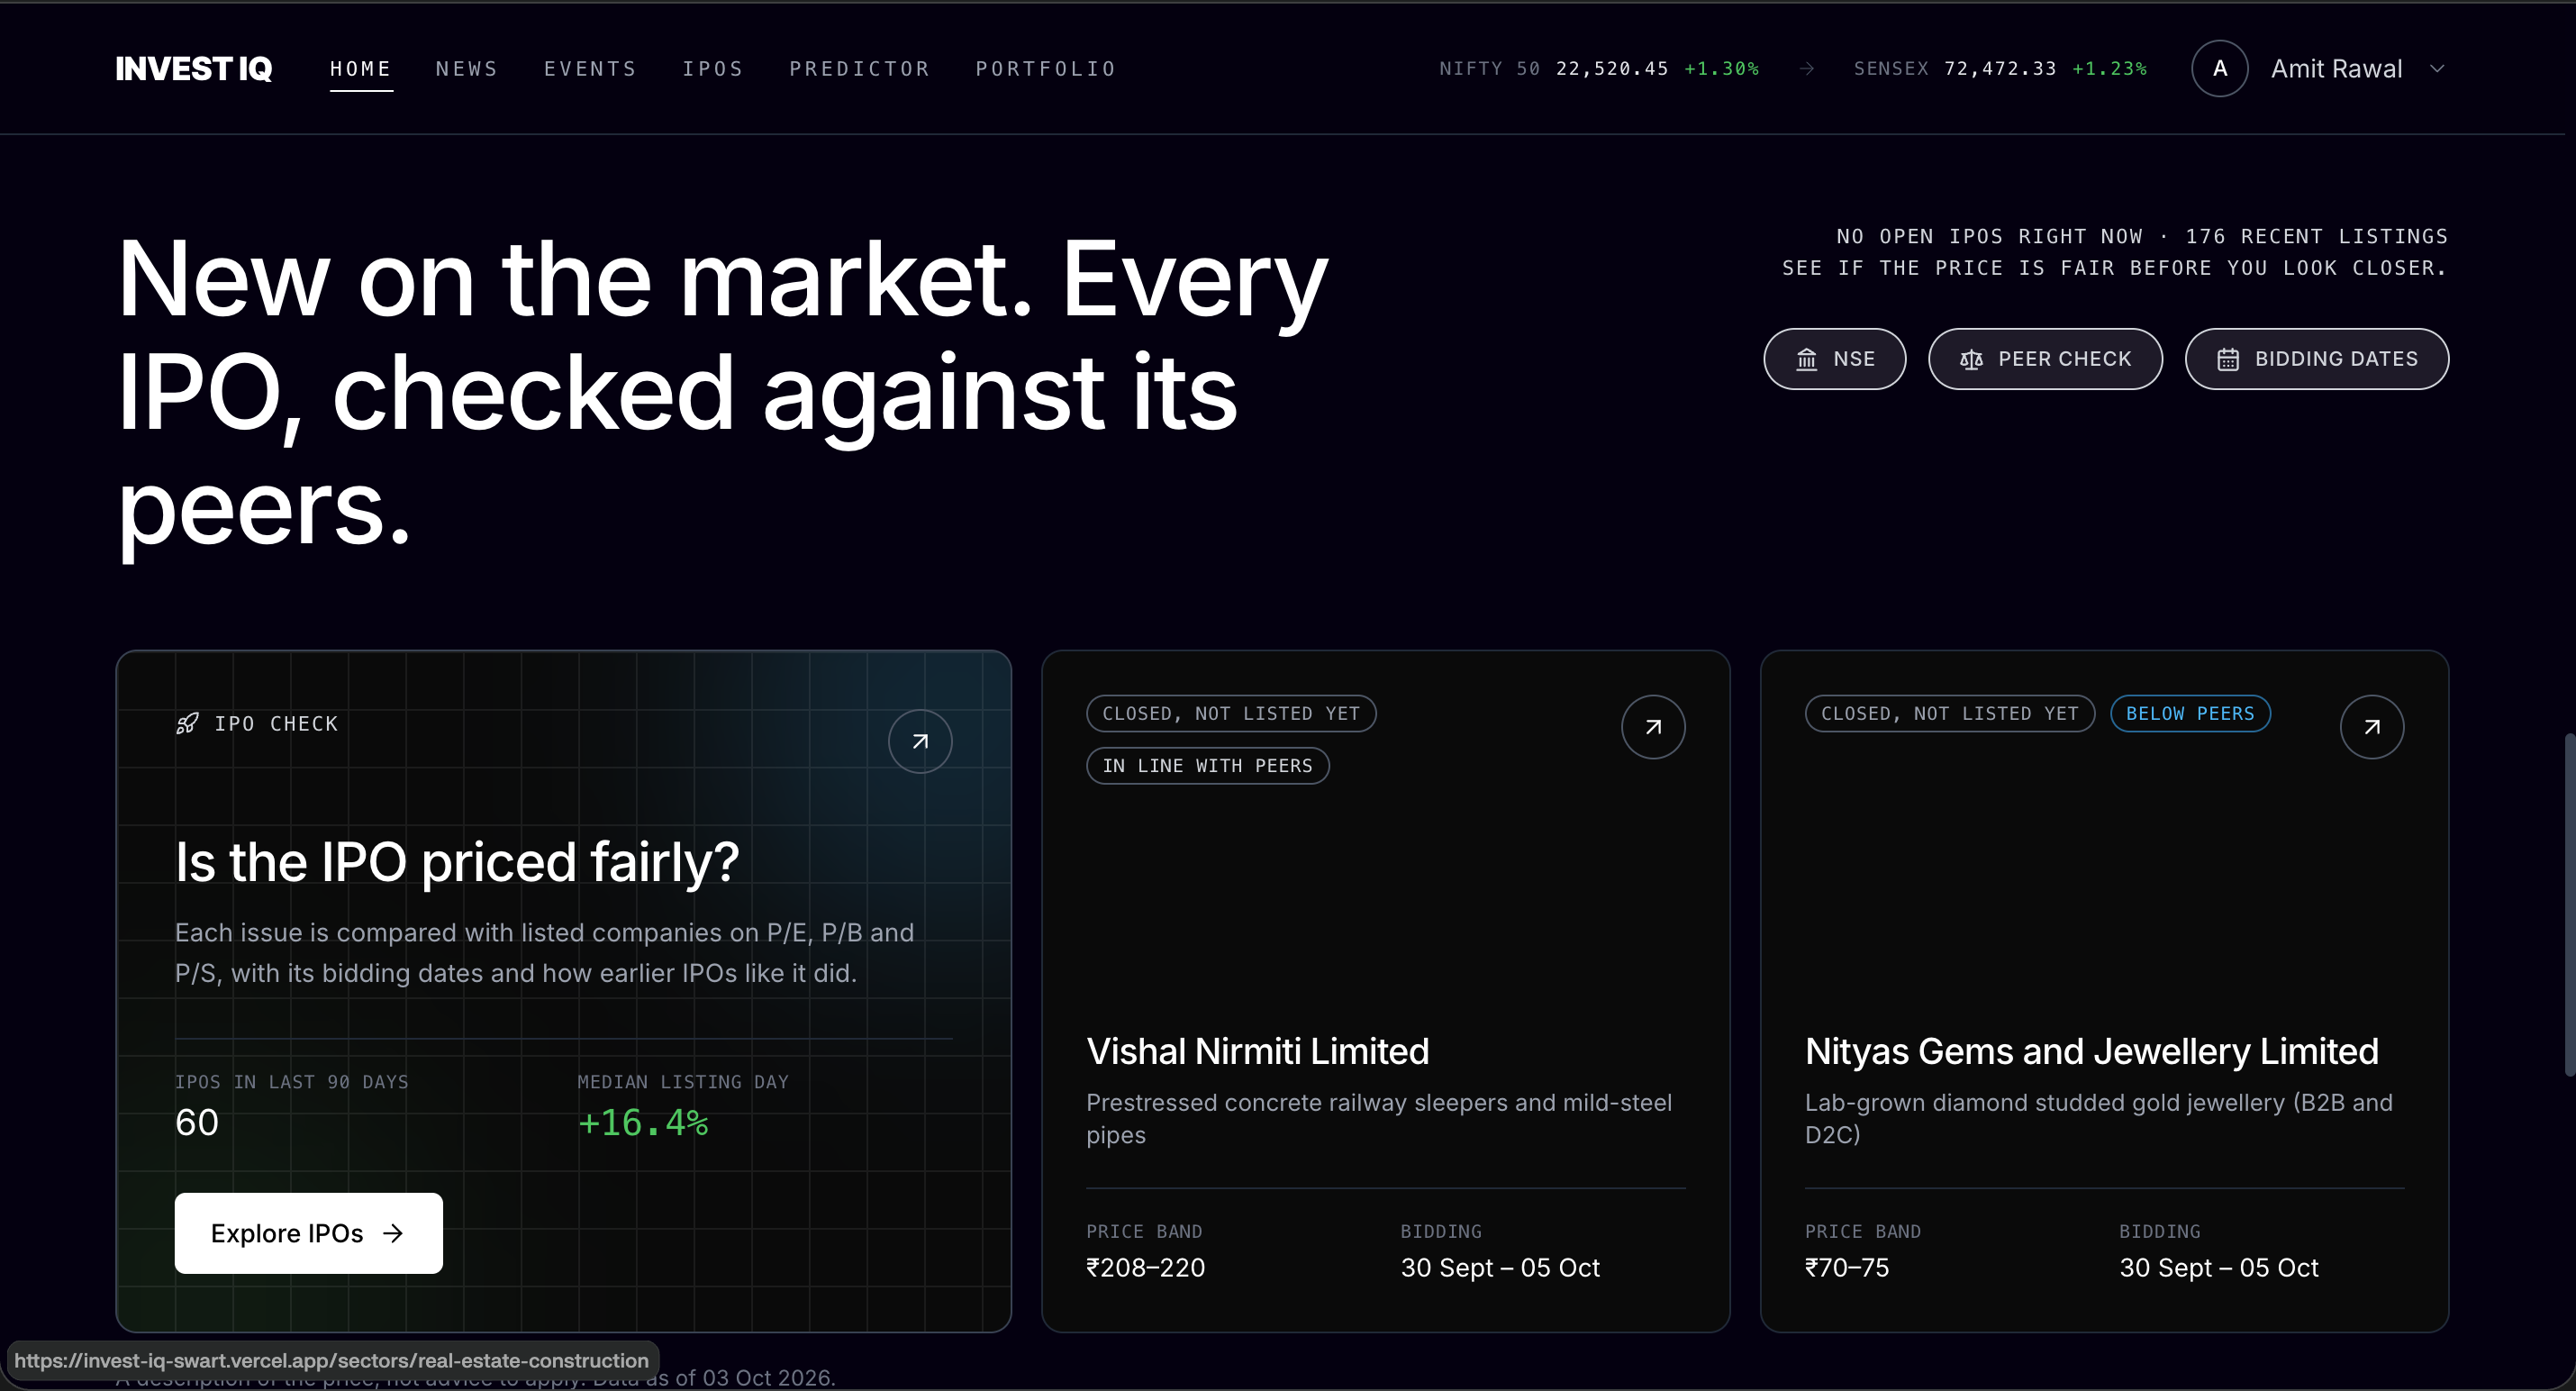
IPO Check: compares a new IPO's price with listed peers, QIB subscription and market mood, and shows how similar IPOs did

Inspiration
India has more than 3,000 NSE-listed companies, but most retail investors focus on a few popular stocks. Finding good opportunities among smaller companies is difficult because their financial reports, stock prices, and news are available across different sources.
I built InvestIQ to make stock research easier by bringing company financials, market trends, and news together in one platform.
What It Does
InvestIQ is an AI-powered stock research platform for more than 3,100 NSE-listed companies.
- Stock Rankings: Gives each company a score from 0 to 100 and classifies it as Strong, Positive, Neutral, or Weak.
- Company Analysis: Displays financial results, company strengths, potential risks, price trends, and news.
- News Analysis: Collects NSE announcements every 15 minutes and uses FinBERT to analyse news sentiment.
- Portfolio Analysis: Allows users to connect Upstox or Zerodha in read-only mode and analyse their holdings.
- Event Analysis: Shows how the market reacted to similar events in the past.
- IPO Analysis: Compares IPOs with similar companies and available subscription data.
- Performance Tracking: Tracks historical rankings and compares their performance with the market index.
How It Works
InvestIQ uses three main factors to calculate company scores:
- Market Trends: Analyses stock prices, moving averages, and performance compared with the NIFTY Smallcap 250 index.
- Financial Performance: Examines company growth, profitability, debt, and cash flow.
- News Sentiment: Uses FinBERT to classify company-related news as positive, negative, or neutral.
The system gives more weight to market trends, followed by financial performance and news sentiment. It also applies penalties for certain financial risks.
I test the rankings against historical market data to understand how well they perform. These scores help users research companies but cannot guarantee future returns.
How I Built It
- Frontend: React 18, Vite, Tailwind CSS, Motion, and Chart.js
- Backend: Node.js and Express
- Database: TiDB Cloud (MySQL-compatible), with around 4.3 million daily price records
- Machine Learning: Python, Pandas, Scikit-learn, XGBoost, and FinBERT
- Automation: GitHub Actions for scheduled news collection, price updates, and ranking snapshots
- Security: Google Sign-In, password hashing, JWT, and encrypted broker tokens
The machine-learning models run offline, and their results are stored in the database. This allows the website to display scores without running a machine-learning server continuously, helping reduce infrastructure costs.
Challenges I Faced
1. Finding the right scoring method
Initially, I gave more importance to financial data. Historical testing showed that combining financial performance with market trends improved the rankings.
2. Choosing the right model
XGBoost sometimes learned patterns specific to certain market periods. A simpler and more transparent scoring system performed better in my experiments.
3. Analysing financial companies
Banks have different financial reporting requirements from other businesses. I developed separate processing rules for financial companies, which helped me rank 170 of them.
4. Cleaning market data
Incorrect prices and relisting events sometimes created unrealistic returns. I added validation rules to identify suspicious price movements.
5. Identifying risks
Some stocks received high scores even after significant price increases. I added warnings to help users identify potentially overextended stocks.
6. Handling survivorship bias
My dataset mainly contains companies listed today, which can make historical results look better than actual market performance. I have documented this limitation and plan to include delisted companies.
Results
My historical tests have shown encouraging results:
- The Information Coefficient (IC) was positive in 5 out of 6 historical test windows.
- Strong-rated stocks averaged +8.4%, while Weak-rated stocks averaged -7.1% in the reported one-year evaluation.
- The bottom 50 stocks averaged -20.5% over the same evaluation period.
- During the COVID-19 market crash, the Top 50 portfolio fell approximately 33%, compared with a 39% decline in the benchmark index.
These results are based on historical testing and do not guarantee future performance. The model also has limitations during sudden market changes.
What I Learned:
- Historical testing is essential before trusting a prediction system.
- Simple and explainable models can work better than complex models when data is limited.
- Financial data requires careful cleaning and different approaches for different industries.
- News sentiment becomes more useful when combined with financial and market data.
- Being transparent about a model's limitations is important.
Building InvestIQ also helped me gain practical experience in full-stack development, machine learning, financial data processing, NLP, database management, and automation.
What's Next:
- Add delisted companies to reduce survivorship bias.
- Include valuation metrics to identify potentially undervalued companies.
- Collect more historical news data to improve testing.
- Add alerts when company scores or risk levels change.
- Improve performance during sudden market changes.
My goal is to make stock research easier and help investors discover smaller, lesser-known listed companies.
Built With
- chart.js
- express.js
- finbert
- github-actions
- google-oauth
- hugging-face
- javascript
- jwt
- kite-connect
- mysql
- node.js
- nse
- numpy
- pandas
- python
- pytorch
- react
- scikit-learn
- tailwindcss
- tidb
- transformers
- upstox-api
- vercel
- vite
- xgboost

Log in or sign up for Devpost to join the conversation.