-
-
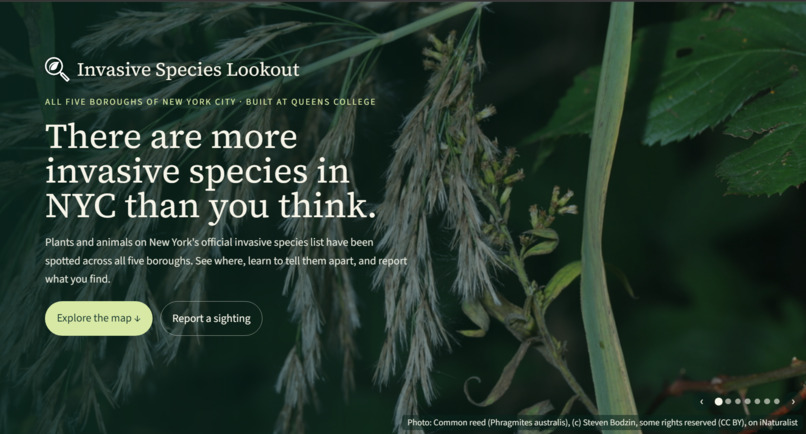
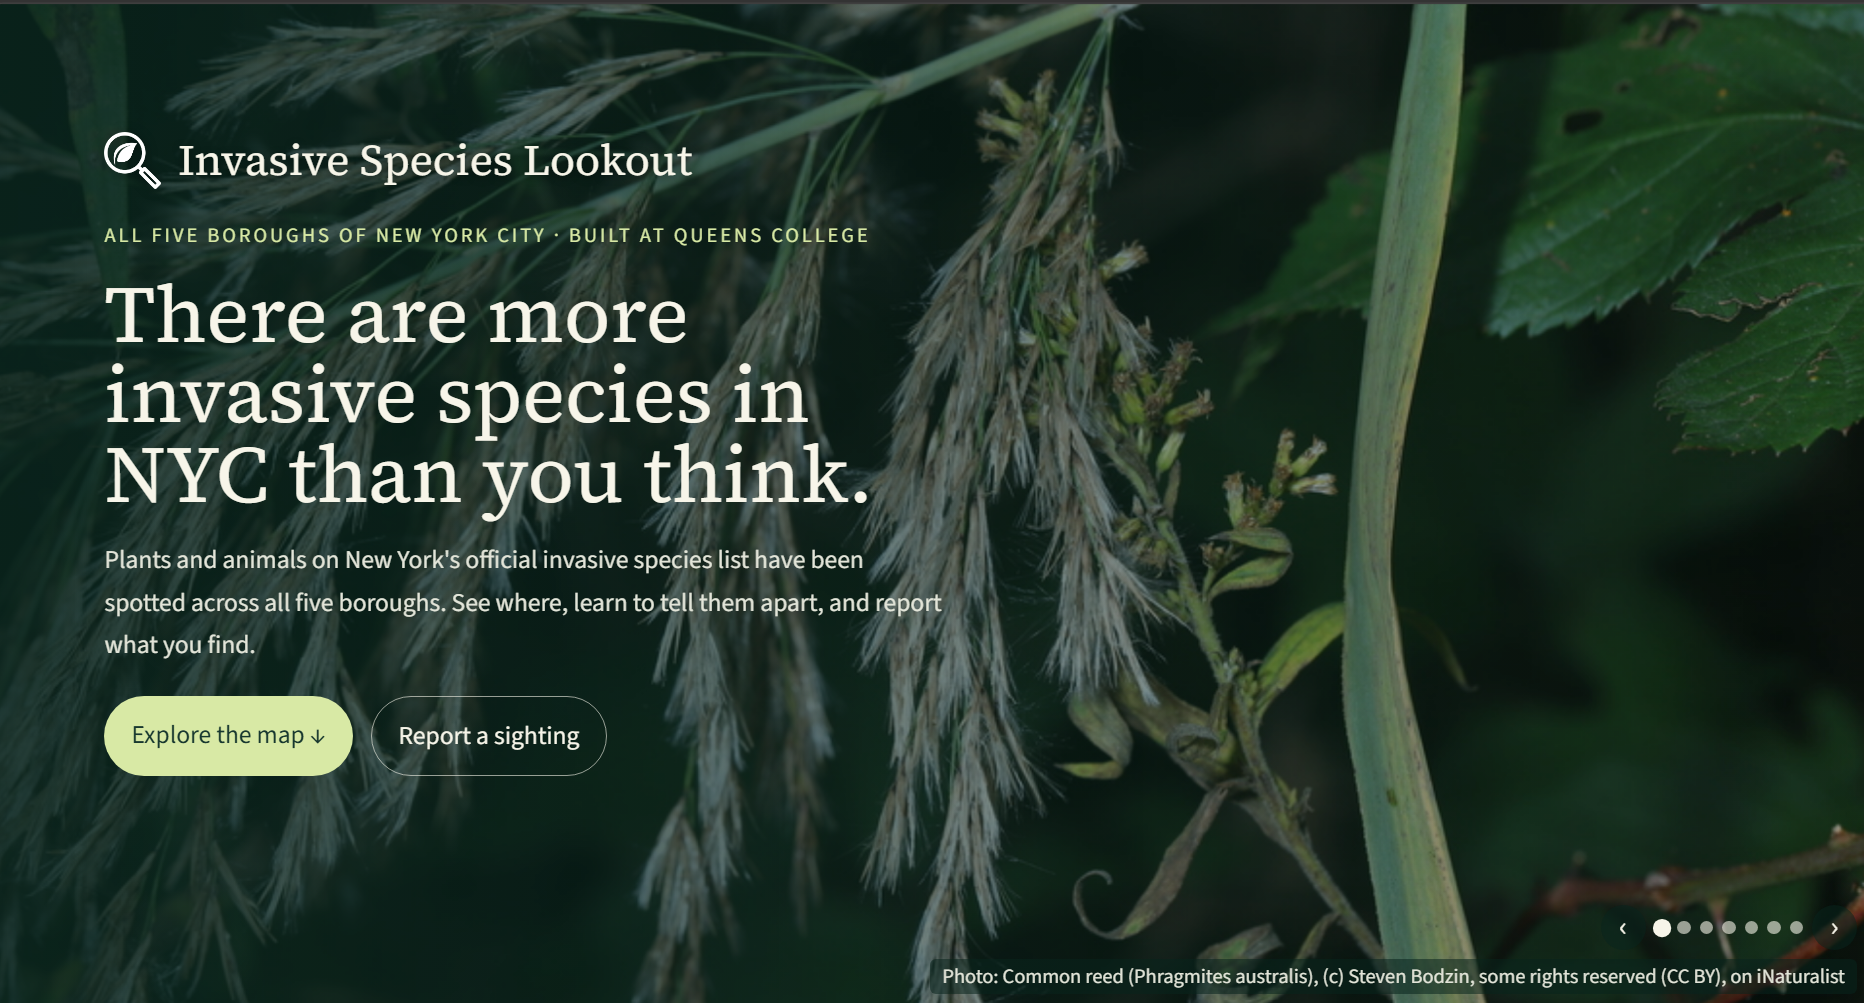
Landing image
-
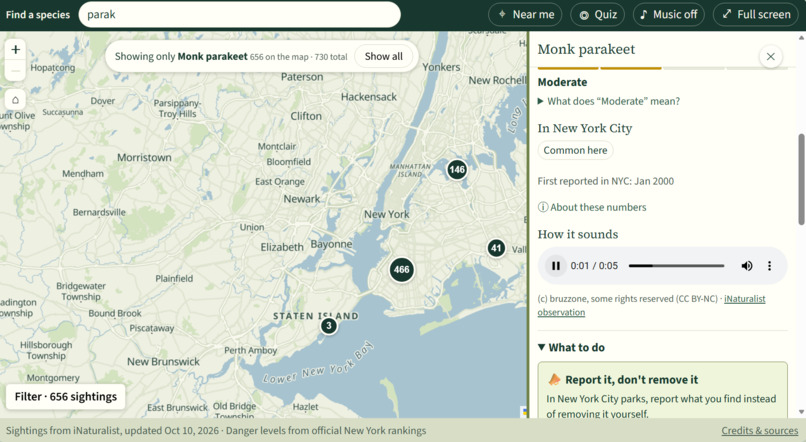
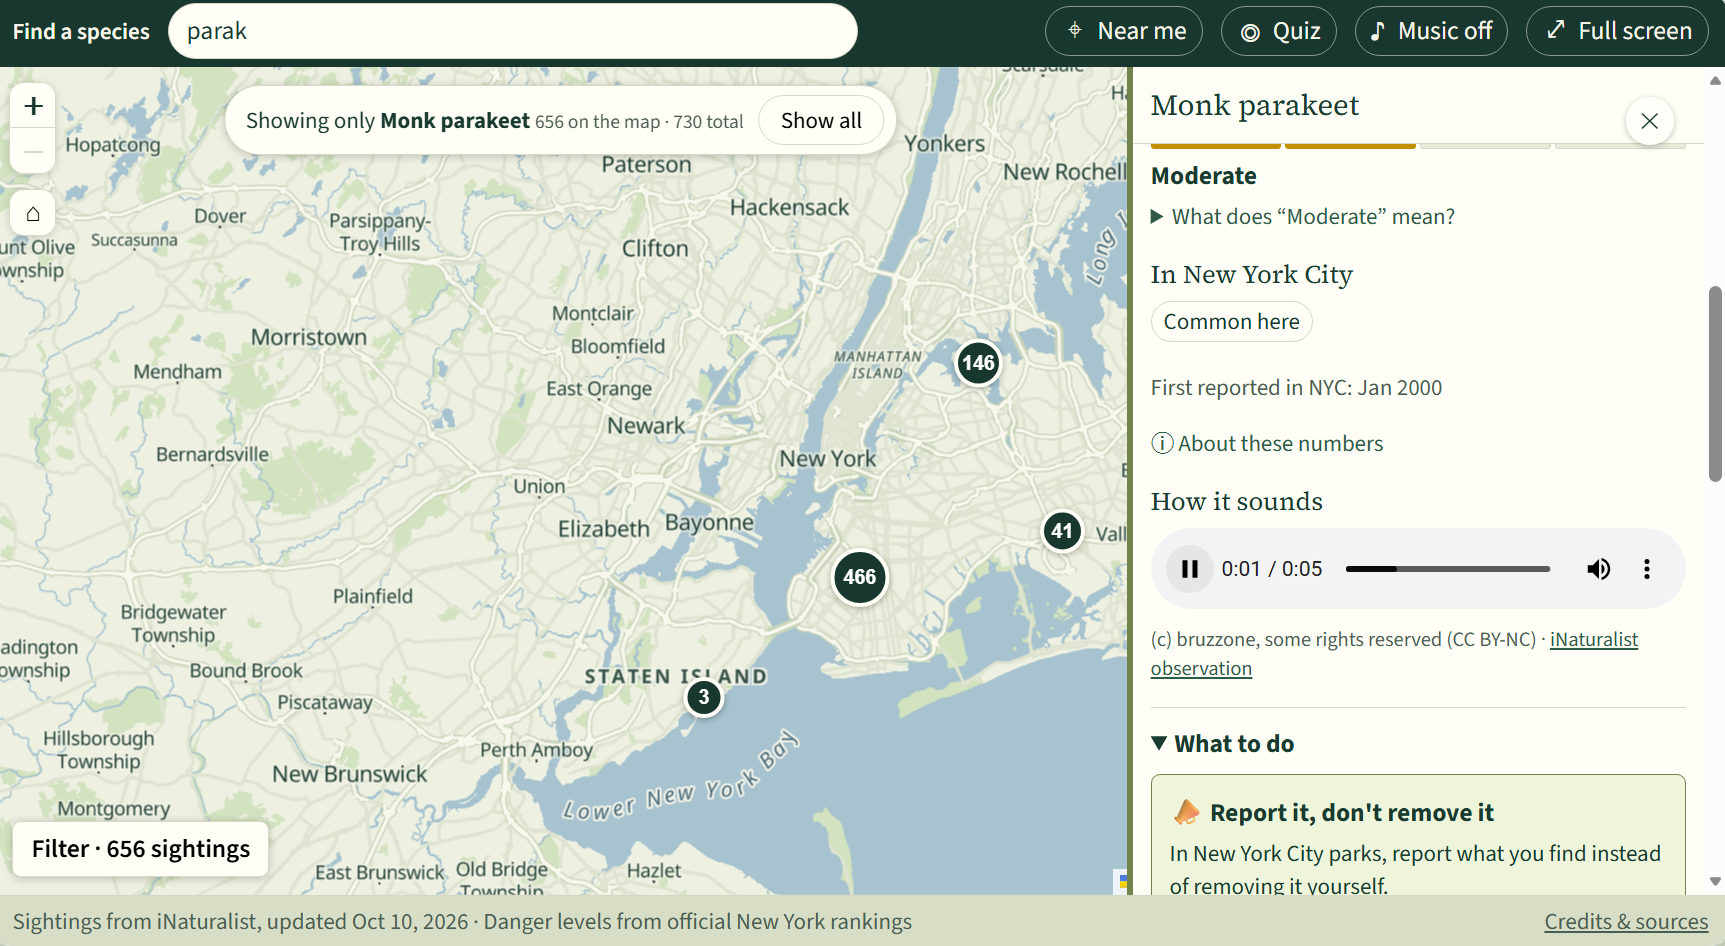
Some species have audio files, and you can hear them!
-
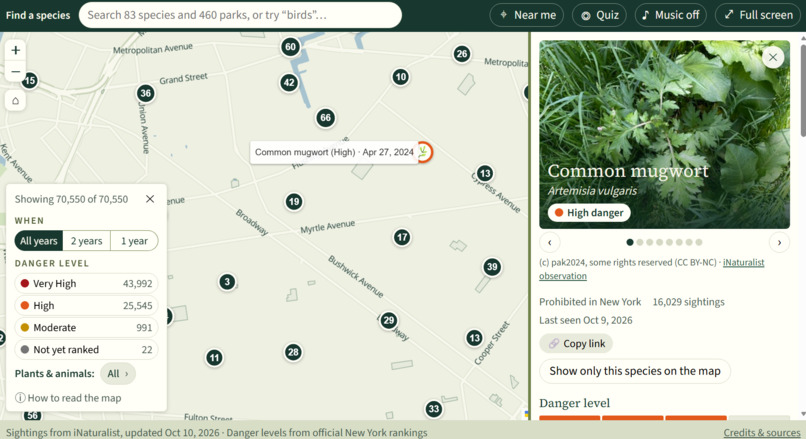
Overview of the species
-
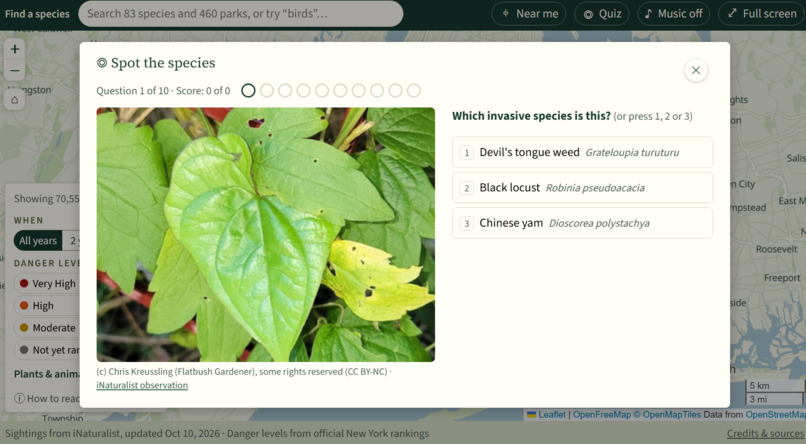
A quiz to recognize invasive species
-
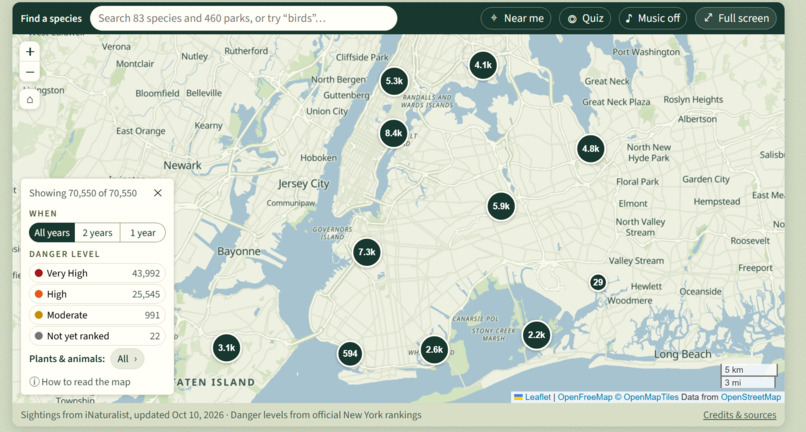
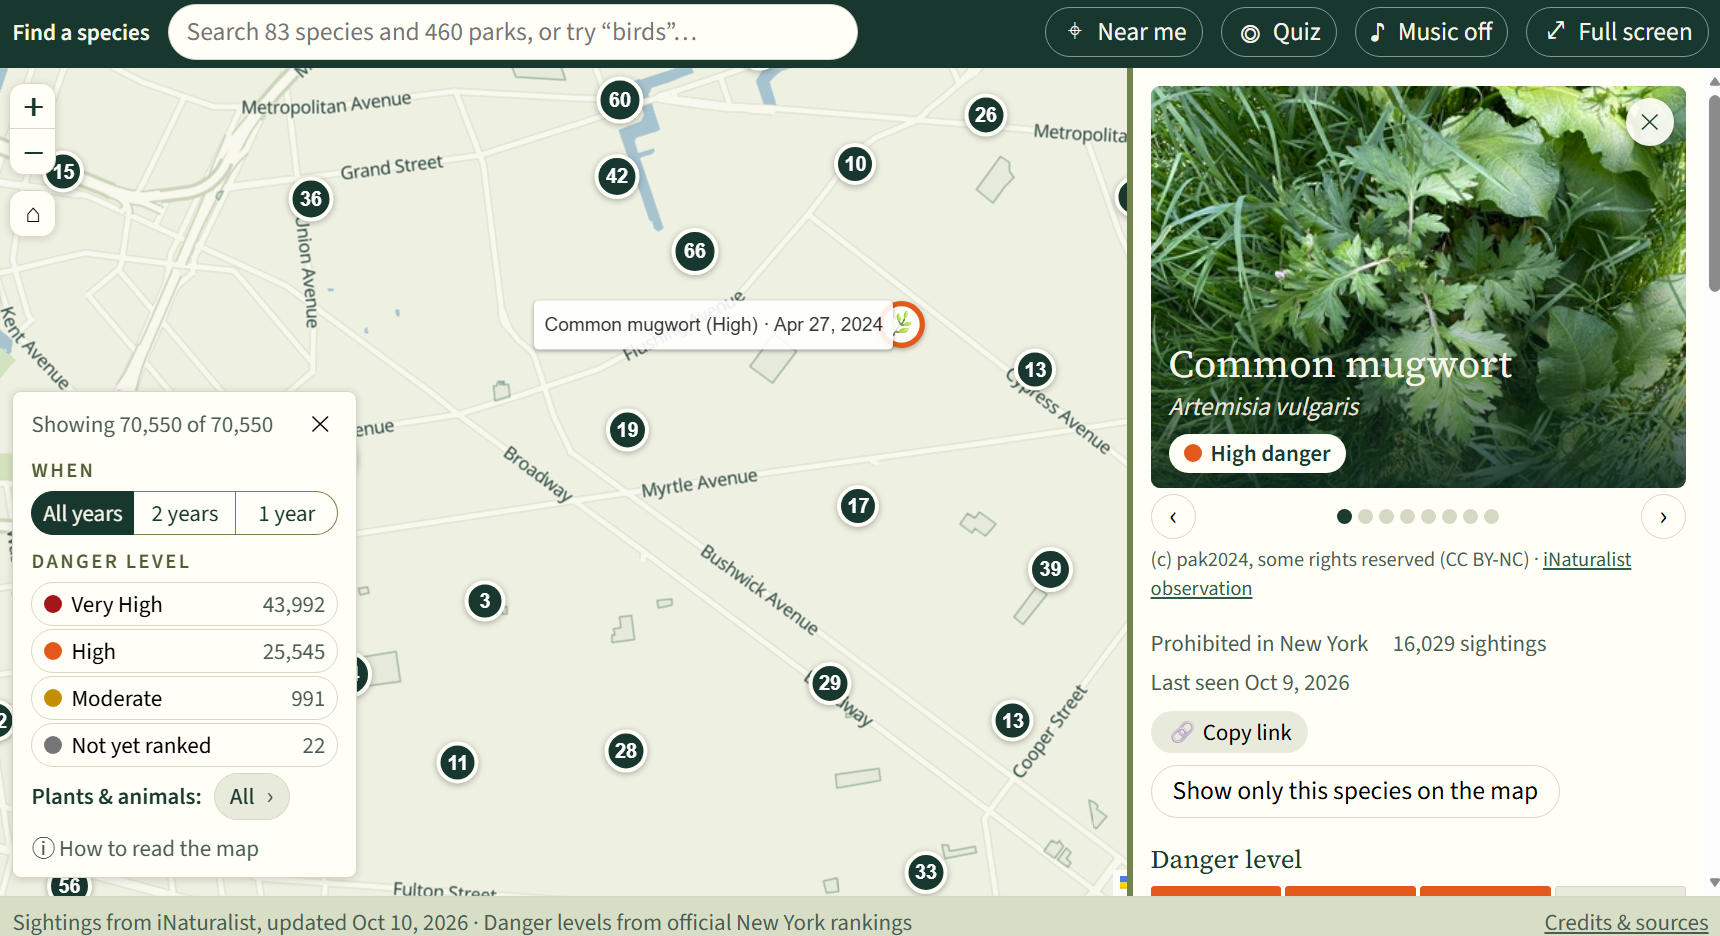
The map, with several filters
Inspiration
We attended BioBlitz during the summer for Willowbrook Park. We collected data on the species around the area and ended up really liking working with iNaturalist. This hackathon, we saw an environmental track, and we wanted to connect it with iNaturalist in some way.
What it does
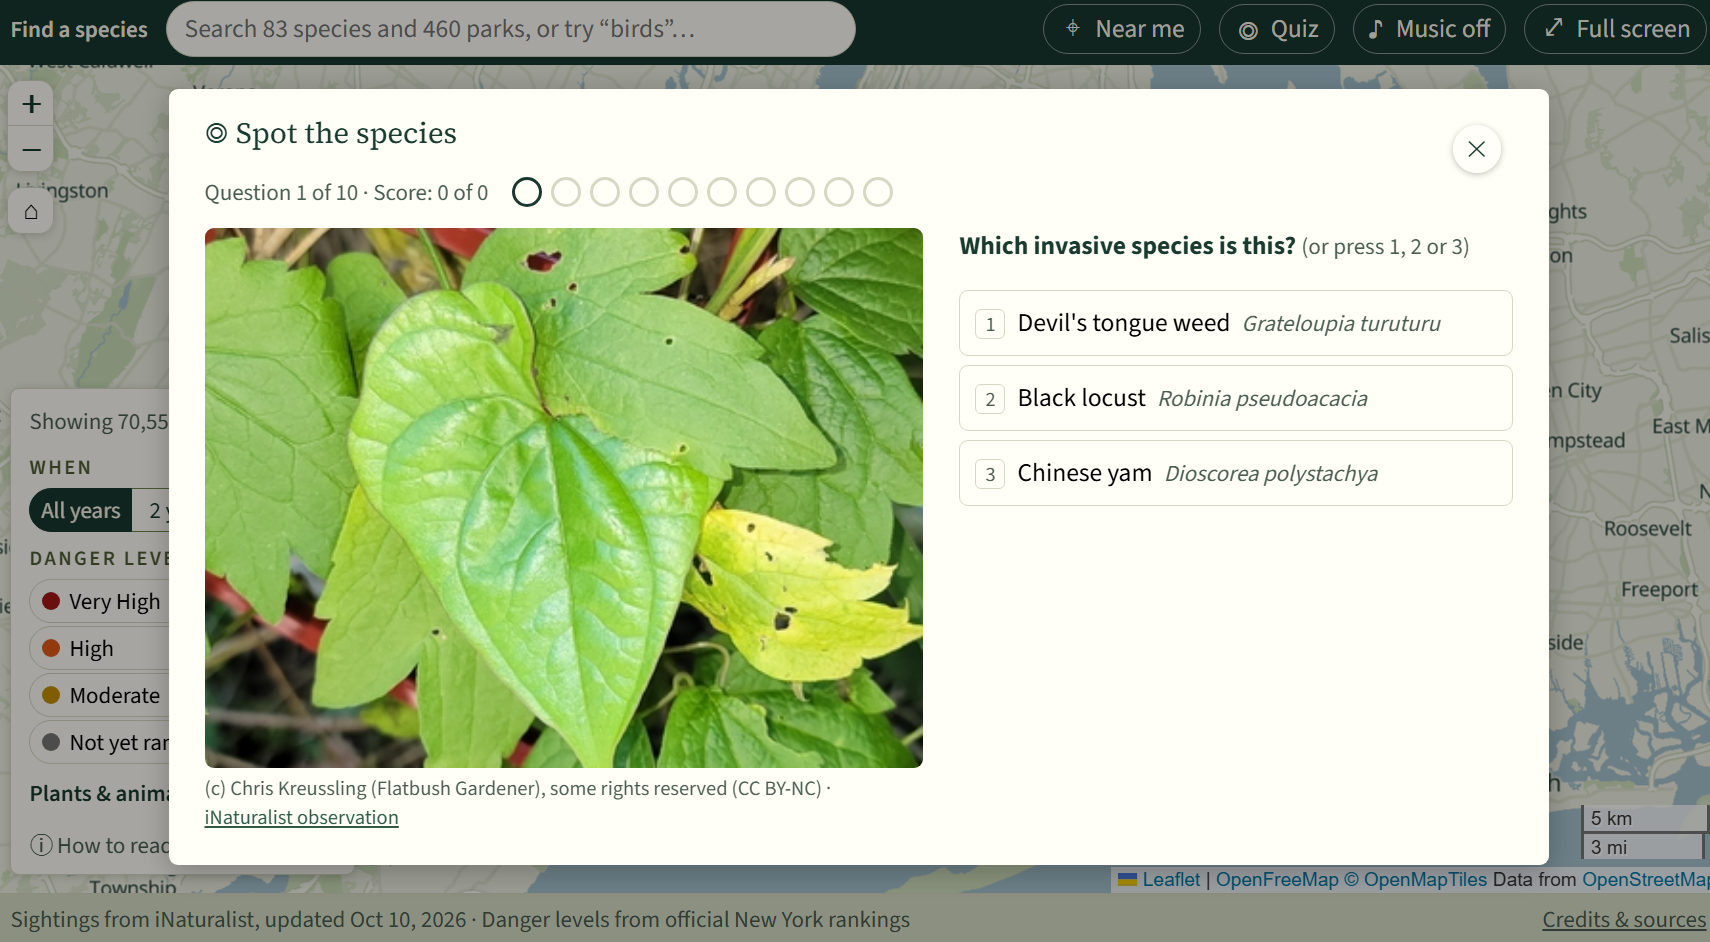
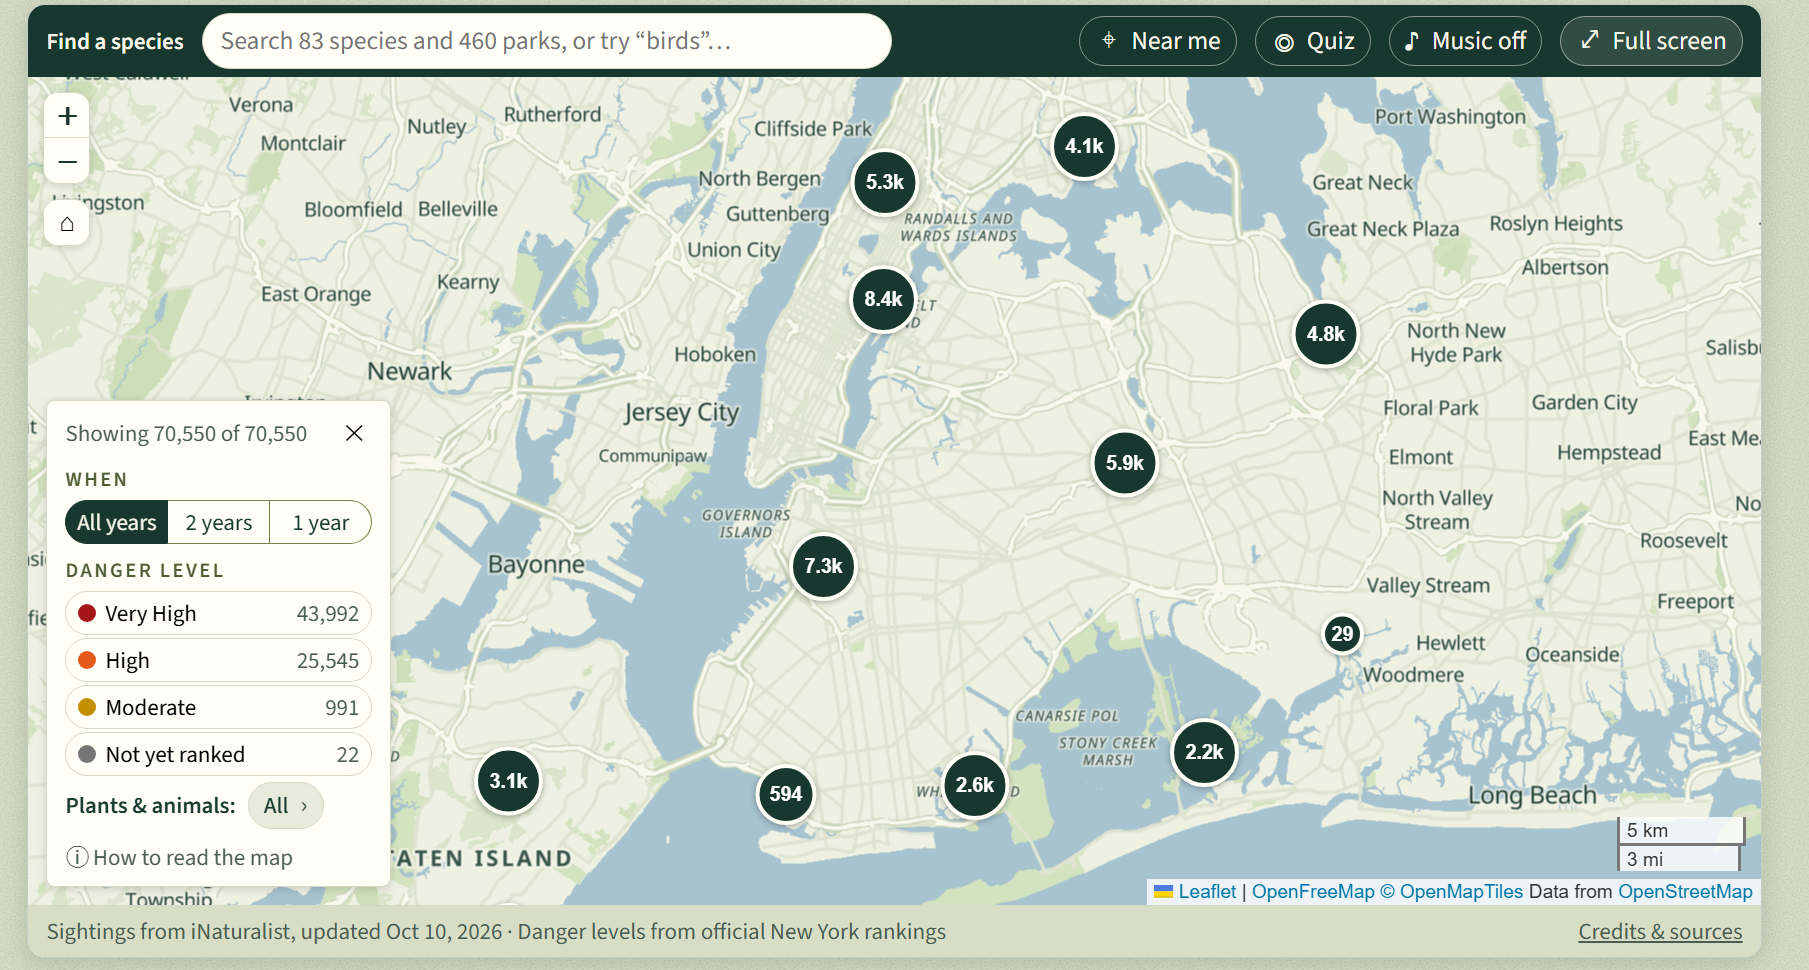
An interactive map that allows you to view invasive species in the NYC area. Grouped by parks, types (birds, plants, fish etc), how many observations were made of it. You can also report invasive species that you find. You can also see how dangerous a species is, also how new an observation is. On top of that, you can quiz yourself on invasive species.
How we built it
Claude built the base of the application, while we kept adding onto the code and splitting up roles and tasks. We started out by creating the interface for the website separately and then merging it with our backend development branches. At the end, we merged all of our changes together to create a better layout and add interactive features we wanted to add while working with invasive species data with SQL.
Challenges we ran into
- We wanted to generate summaries using a RAG model through Snowflake. But we realized that if we did that, even if it was only generating summaries based on information given to it, it still added filler words whenever information was ambiguous. We wanted accurate and educational information to be displayed on our site, so we ended up abandoning the RAG model. Instead, we decided to use the source material and write a script that splits the source material into chunks and uploads them to a Snowflake table. There's a Cortex Search service that we use that goes through it. Another script runs to "generate" a summary, but it only creates one per species. Cortex Search is what finds the matching pieces and makes the search to create the summaries faster. Everything is saved to a Json file, and the backend just reads it.
- There were issues with how the map looked, it was cluttery and kept interfering with our UI. There were bugs with how the information was presented, and so we kept editing the UI to make it simpler. It also kept lagging, which we had to fix by preloading all the data first.
Accomplishments that we're proud of
- Learned how to use Claude more efficiently to aide in completing our project
- Fixing the icon grouping, making the website run more efficiently
- Having it deployed using Render!
What we learned
- How to use more git controls/commands
- How to use more terminal commands
- Use React & Python and see them interact with each other
What's next for Invasive Species Lookout (ISL)
Include the list of endangered species in the general NYC area (not where they're located, so that they're not hunted). Possibly expanding to a map of the United States.


Log in or sign up for Devpost to join the conversation.