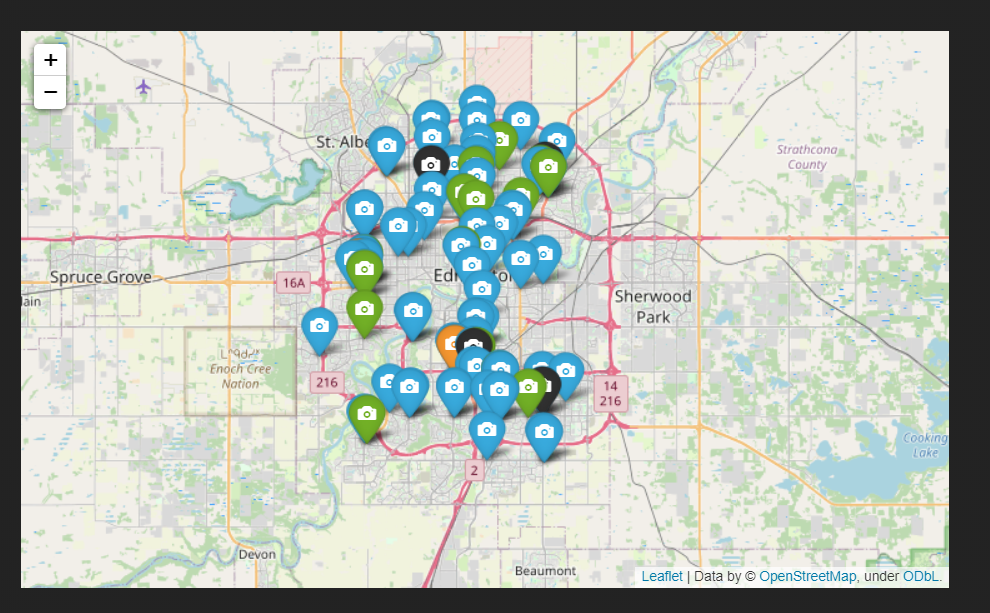
What it does Our program gives the user an opportunity to obtain a visual aid in viewing all the intersection safety devices, ISD, via an interactive map. How w-e built it
Inspiration
An API, namely speaking “sodapy” was used to gain access to the dataset given through data.edmonton.ca. Pandas was used to read the dataset, which gave us the availability to access the values in the desired columns. Folium was used to create the interactive map interface. The whole project was built on MecSimCalc, a prebuilt GUI platform.
Challenges we ran into
As our coding experiences are quite limited and the coding skill levels varies within our team, we found ourselves challenged by using APIs for the first time as well as folium and MecSimCalc. It was an adversity to build a project with unfamiliarized tools when under a time limit.
Accomplishments that we're proud of
Getting closer to the end of HackED, we found ourselves getting comfortable and familiarized with using APIs and MecSimCalc. Ultimately, being able to write a project that runs without any major errors was an achievement for us.
What we learned
We’ve learnt the process behind API’s mechanism in being able to access and manage the datasets. In addition, the process behind building a project via MecSimCalc’s map’s feature with folium was learnt.
What's next for speed trap map tracker
For the future, we can expand our map to incorporate other cities if a suitable dataset was found. Features, such as path finding from one location to another with the description of which ISD will be encountered, can be applied.
Built With
- api
- folium
- mecsimcalc
- pandas
- python
- socrata-open-data

Log in or sign up for Devpost to join the conversation.