Inspiration
Global FDI does not reach vulnerable economies evenly, yet the same story is often hidden in spreadsheets. We wanted a single screen where investors, students, and policymakers can see financing gaps on a map, compare poverty and employment context, and reason about social returns—aligned with economic empowerment and SDGs 1, 8, and 10.
What it does
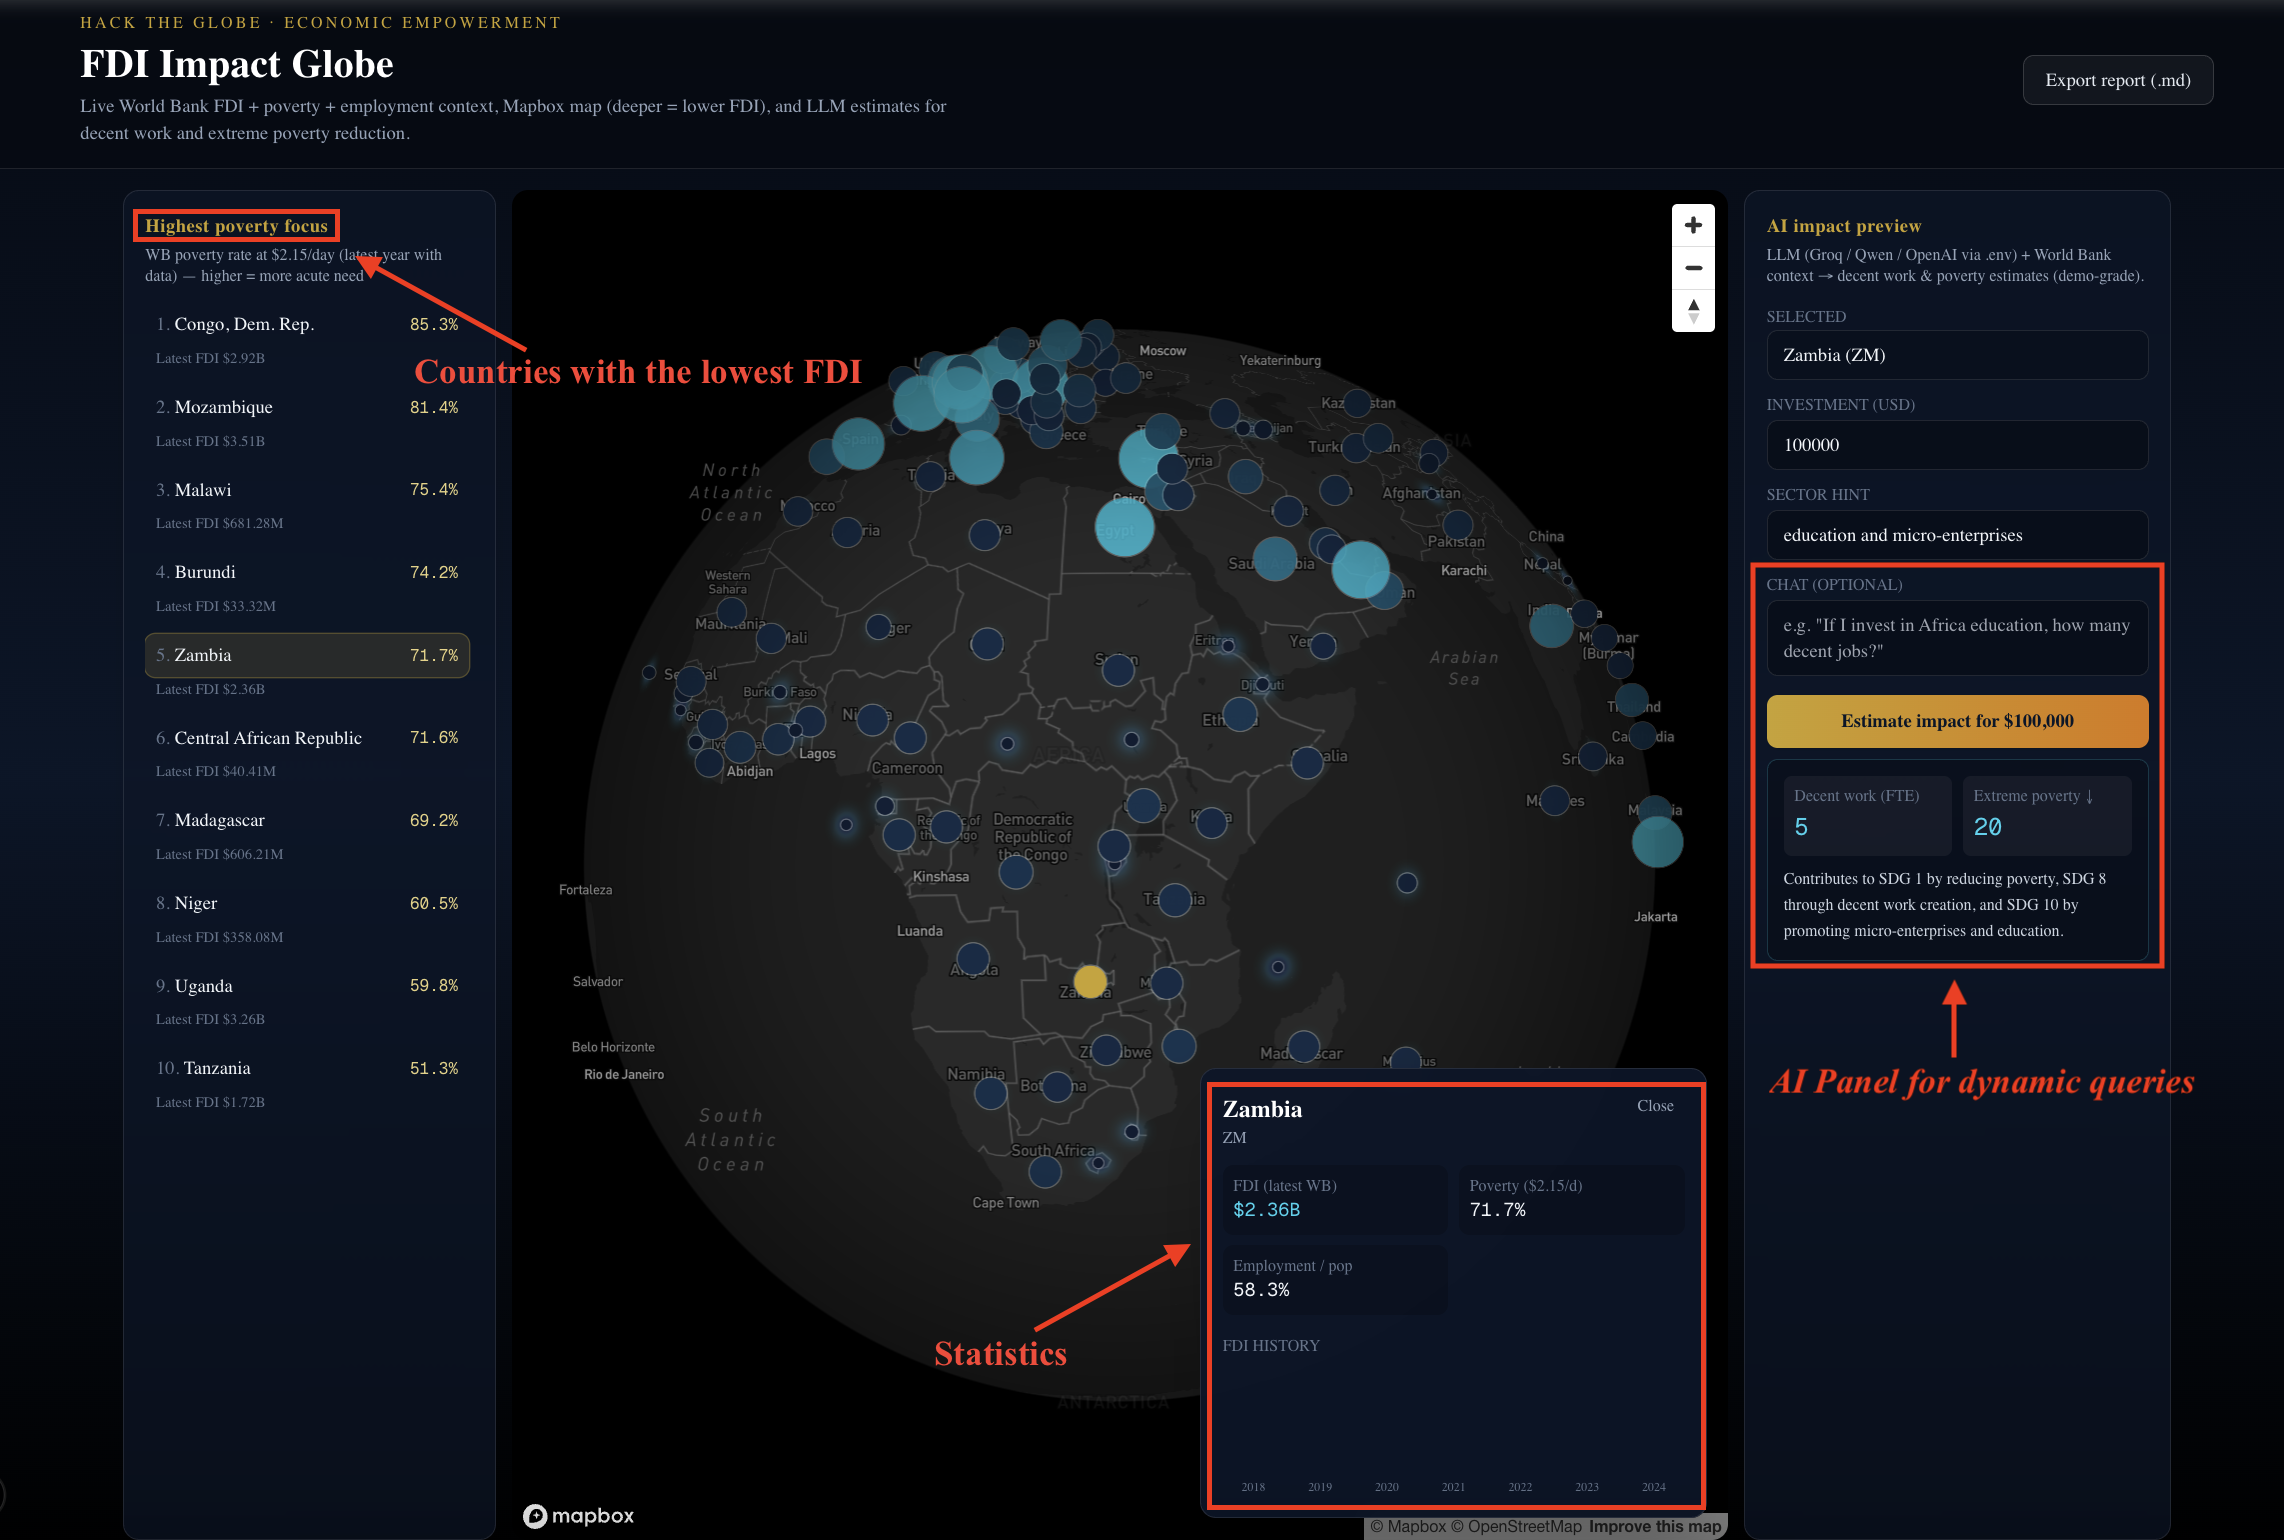
FDI Impact Globe pulls live World Bank indicators (FDI inflows, $2.15/day poverty, employment-to-population) and renders an interactive Mapbox world map where lower FDI reads as darker “need.” A poverty-first ranking highlights high-need countries; clicking a country shows FDI history and key stats. An AI impact panel takes the user’s investment size and sector hint and returns structured estimates (decent work, extreme poverty reduction, SDG framing) plus Markdown export—for demo and storytelling, not financial advice.
How we built it
We used Next.js 15 (App Router) with React and Tailwind for the dashboard. Server-side data fetching merges multiple World Bank indicator series and serves the page with time-based revalidation to balance freshness and rate limits. react-map-gl and Mapbox GL power the heatmap and clickable country points using approximate centroids and GeoJSON built in the app. A small API route calls an OpenAI-compatible chat API (e.g. Groq for a free tier) with JSON-only responses, which the UI parses and displays.
Challenges we ran into
API and keys: OpenAI quota errors surfaced as confusing “network” failures until we returned proper JSON errors from the server. GitHub push initially failed when local credentials did not match the target account. Mapbox + TypeScript needed careful typing for layer expressions. World Bank field names differed from our first assumptions (e.g. ISO2 comes from country.id), so we adjusted parsing so countries actually appear on the map.
Accomplishments that we're proud of
We shipped a coherent end-to-end MVP: map + rankings + country detail + LLM panel + export, all on public data and a deployable Next.js app. We inverted the visual language so low FDI and high poverty drive attention—matching the hack’s social mission. We added a provider-flexible LLM layer (Groq / OpenAI / compatible endpoints) so the demo stays runnable without a paid OpenAI bill.
What we learned
Judges care about the story arc: map first, then one sharp “what-if” number. Defensive API design (clear errors, fallbacks) saves hours during live demos. Normalization matters: ranking by poverty instead of FDI alone changes how people interpret the globe. Hackathon scope means centroids + indicators beat perfect GIS—for now.
What's next for International Investment Dynamics
Short term: country choropleths or WB-boundary tiles, time slider for FDI/poverty years, and cached edge responses for faster global loads. Medium term: UNCTAD or IMF series as optional layers, scenario compare (two countries / two ticket sizes), and PDF one-pager for ESG-style handouts. Long term: verified project pipeline (real deals) and guardrails so AI outputs stay clearly labeled as illustrative, not advisory.
Changes/Improvements we would have made to our design if we had more time
If we had more time or stronger baseline technical skills (1–2 week scope improvements) With another week or two—or teammates with deeper GIS, data viz, and UX polish experience—we would have made the following targeted upgrades to the current design: Replace the approximate centroid-based points with proper country choropleth layers using Mapbox’s built-in boundary tiles or a lightweight, pre-processed Natural Earth / World Bank-aligned GeoJSON. This would give smoother, more professional-looking “need” shading across entire country areas instead of discrete dots, while still keeping load times reasonable. Add a simple time slider synced across the FDI inflows, poverty rate, and employment-to-population ratio layers. Users could animate changes over the past 10–15 years, making temporal trends immediately visible without needing to switch views.
Long-term changes which would need to be made to our design
To evolve FDI Impact Globe from a compelling hackathon MVP into a widely used tool for impact investors, development finance institutions, university programs, and ESG analysts, we would focus on the following extensions—all building directly on the current architecture: Data layer expansion & freshness Move from pure server-side fetching to a lightweight ETL pipeline (e.g. scheduled Vercel Cron + Edge Functions or a small Supabase/PostgreSQL instance) that ingests and normalizes World Bank, UNCTAD, and IMF series daily/weekly. This enables reliable multi-source overlays (e.g. toggle FDI vs. ODA vs. greenfield project counts) without hitting rate limits during high-traffic demos or classroom sessions. Performance at global scale Introduce edge-cached responses for the map data and common country queries (Vercel Edge or Cloudflare) and pre-render popular country detail pages. This keeps the experience snappy even when hundreds of users (e.g. during a policy workshop or investment conference) load the globe simultaneously.


Log in or sign up for Devpost to join the conversation.