-

UI/Logo
-

Plot 1
-
Plot 2
-
Plot 3
-
Plot 4
-
Plot 5
-
Plot 6


Inspiration:
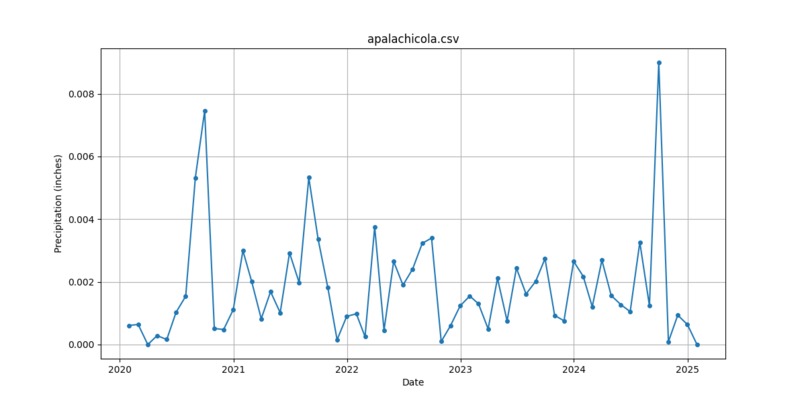
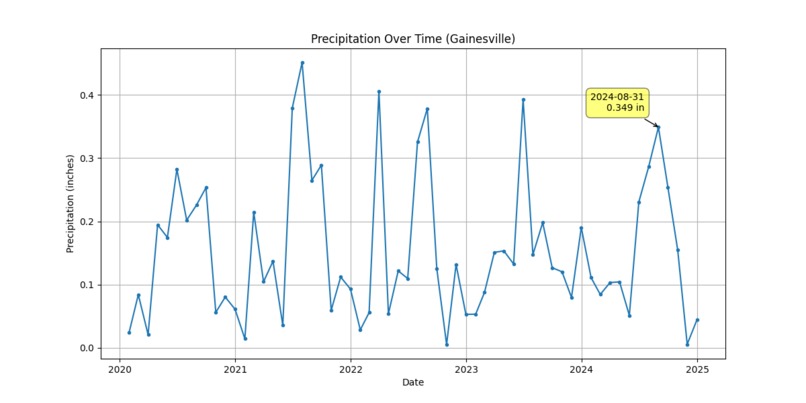
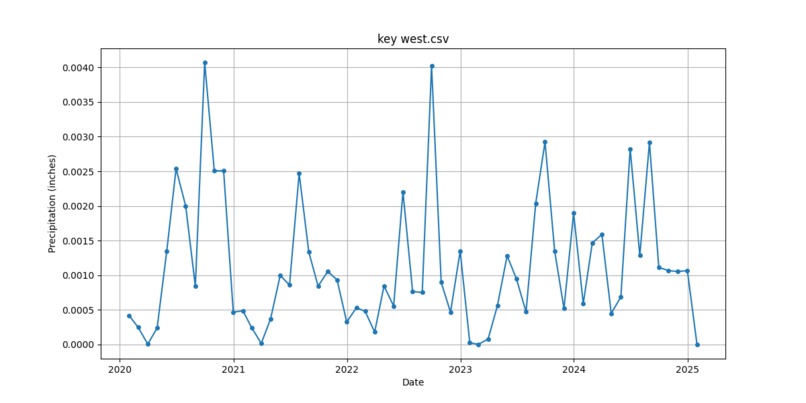
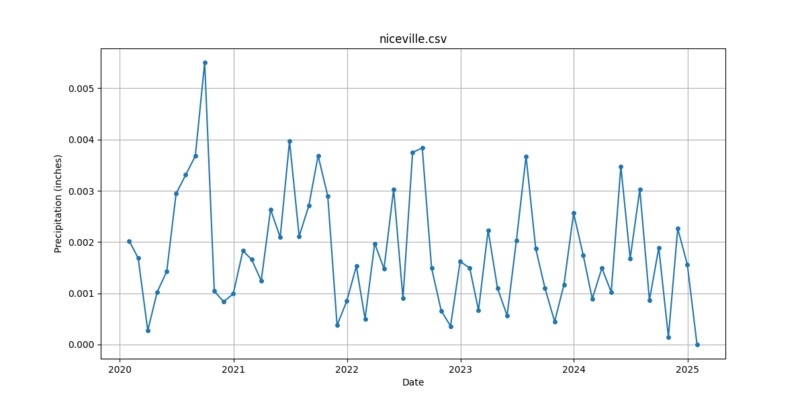
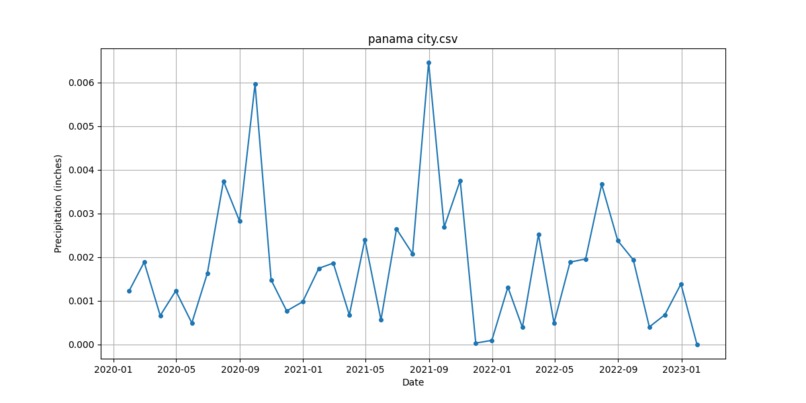
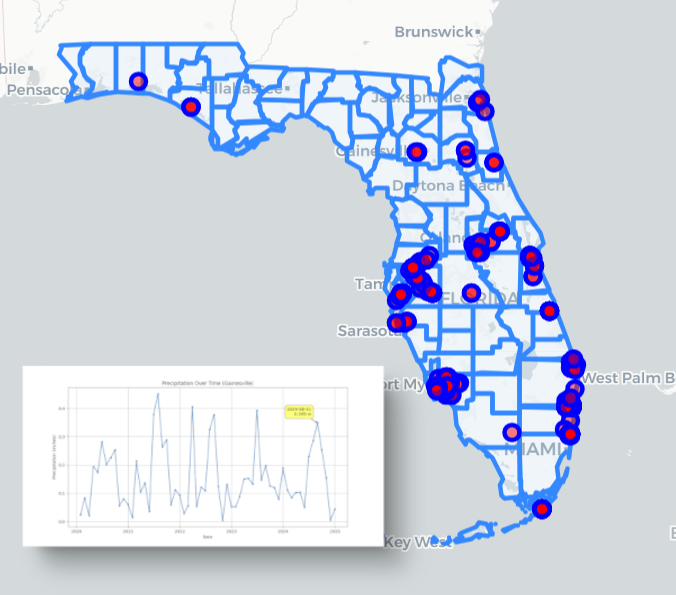
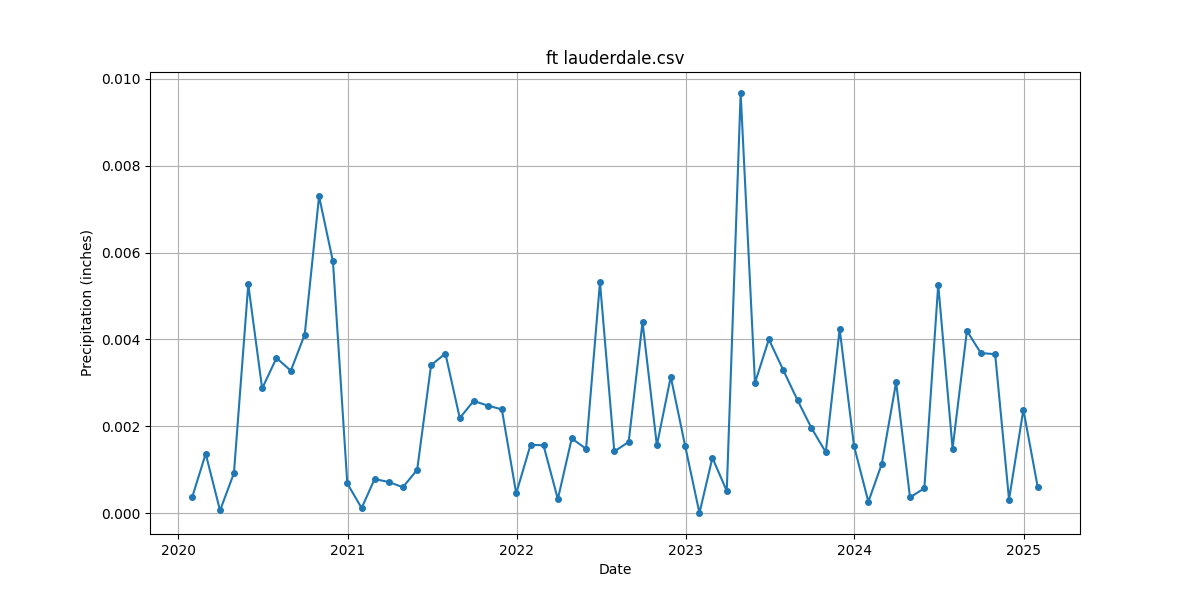
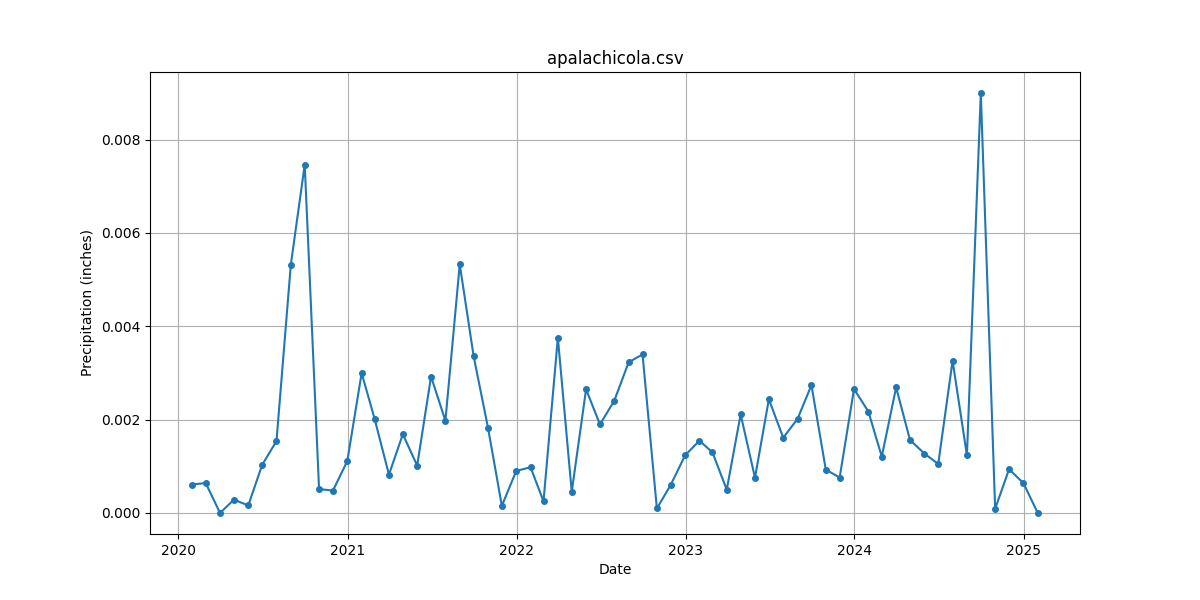
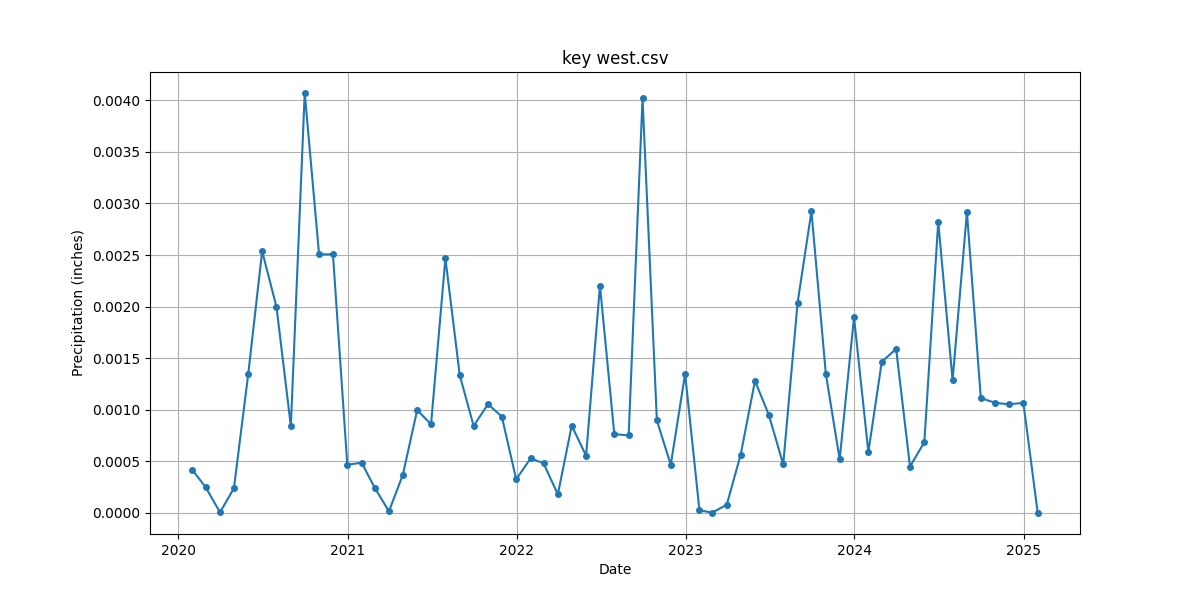
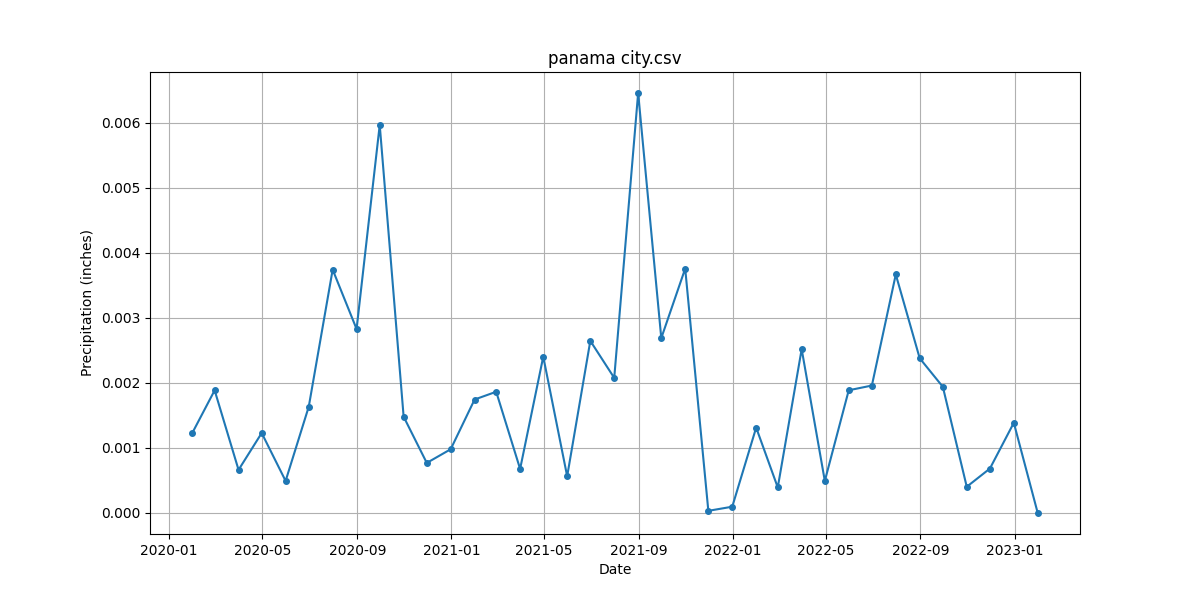
This project was inspired by the lack of data visualizers regarding environmental factors that impact mosquito populations. We focused on precipitation in Florida which generates ideal mosquito reproduction conditions, especially considering the external factors that impact Florida's climate such as hurricanes, tropical storms, and man-made lakes. By combining precipitation + mosquito data, satellite imagery, and mapping analysis, we aimed to increase accessibility to this data for researchers and educators.
What it does:
The user can interact with our project in three different ways: -Analyze regional mosquito populations through the interactive map -Assess precipitation trends by region by depictions of our graphs -Compare precipitation trends among mosquito populations by county
How we built it:
We used Panda documentation and cheat sheets to construct the data frames necessary for our project. Furthermore, we extracted data from NASA and other online research for creating graphs to visualize precipitation rates throughout the years 2020-2025. The graphs from reading the CSV through utilizing Matplotlib and unnecessary data was removed from the .csv files. Our map of Florida was created from folio and the county grid lines were also implemented by folio.
Challenges we ran into:
Since it was our first time using Google Collab, we ran into errors when it came to collaborating and automatically saving our code. Furthermore, because Git version control wasn't utilized, it was hard to keep track of where merge conflicts would occur and why they were occurring. Obtaining the data regarding climate factors and mosquito populations regionally was also a struggle, as there are not many samples that are present online. This challenge meant most of the data pulled required extra cleaning and was less standardized than ideal, causing implementation issues when attempting data integration.
What we learned:
Read the Documentation in advance. Navigating Jupyter (through Google Collab) and working with shortened timeline were wonderful surprises.
What's next for our project?
Ideally, we would implement mosquito sighting trends within the same graph as the precipitation trends. The goal of this addition would be to determine relation (if any) between mosquito population and average rainfall.

Log in or sign up for Devpost to join the conversation.