-
-

Code Directory
-
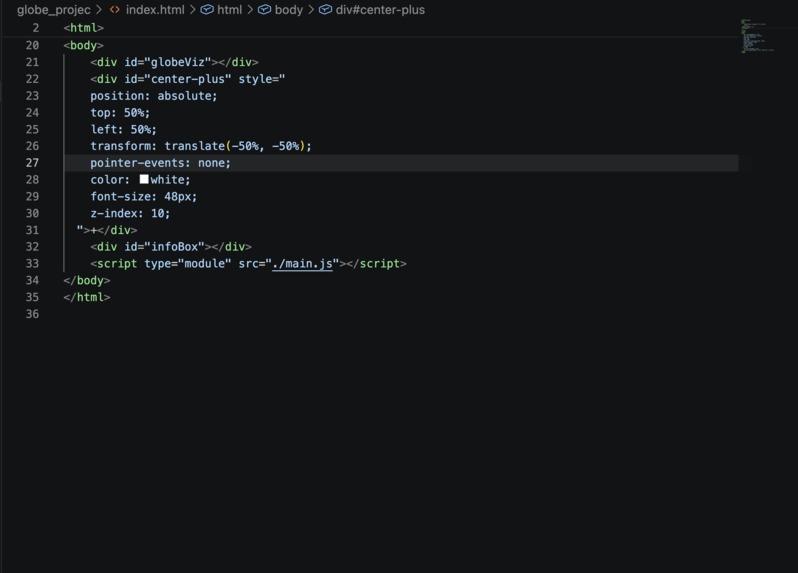
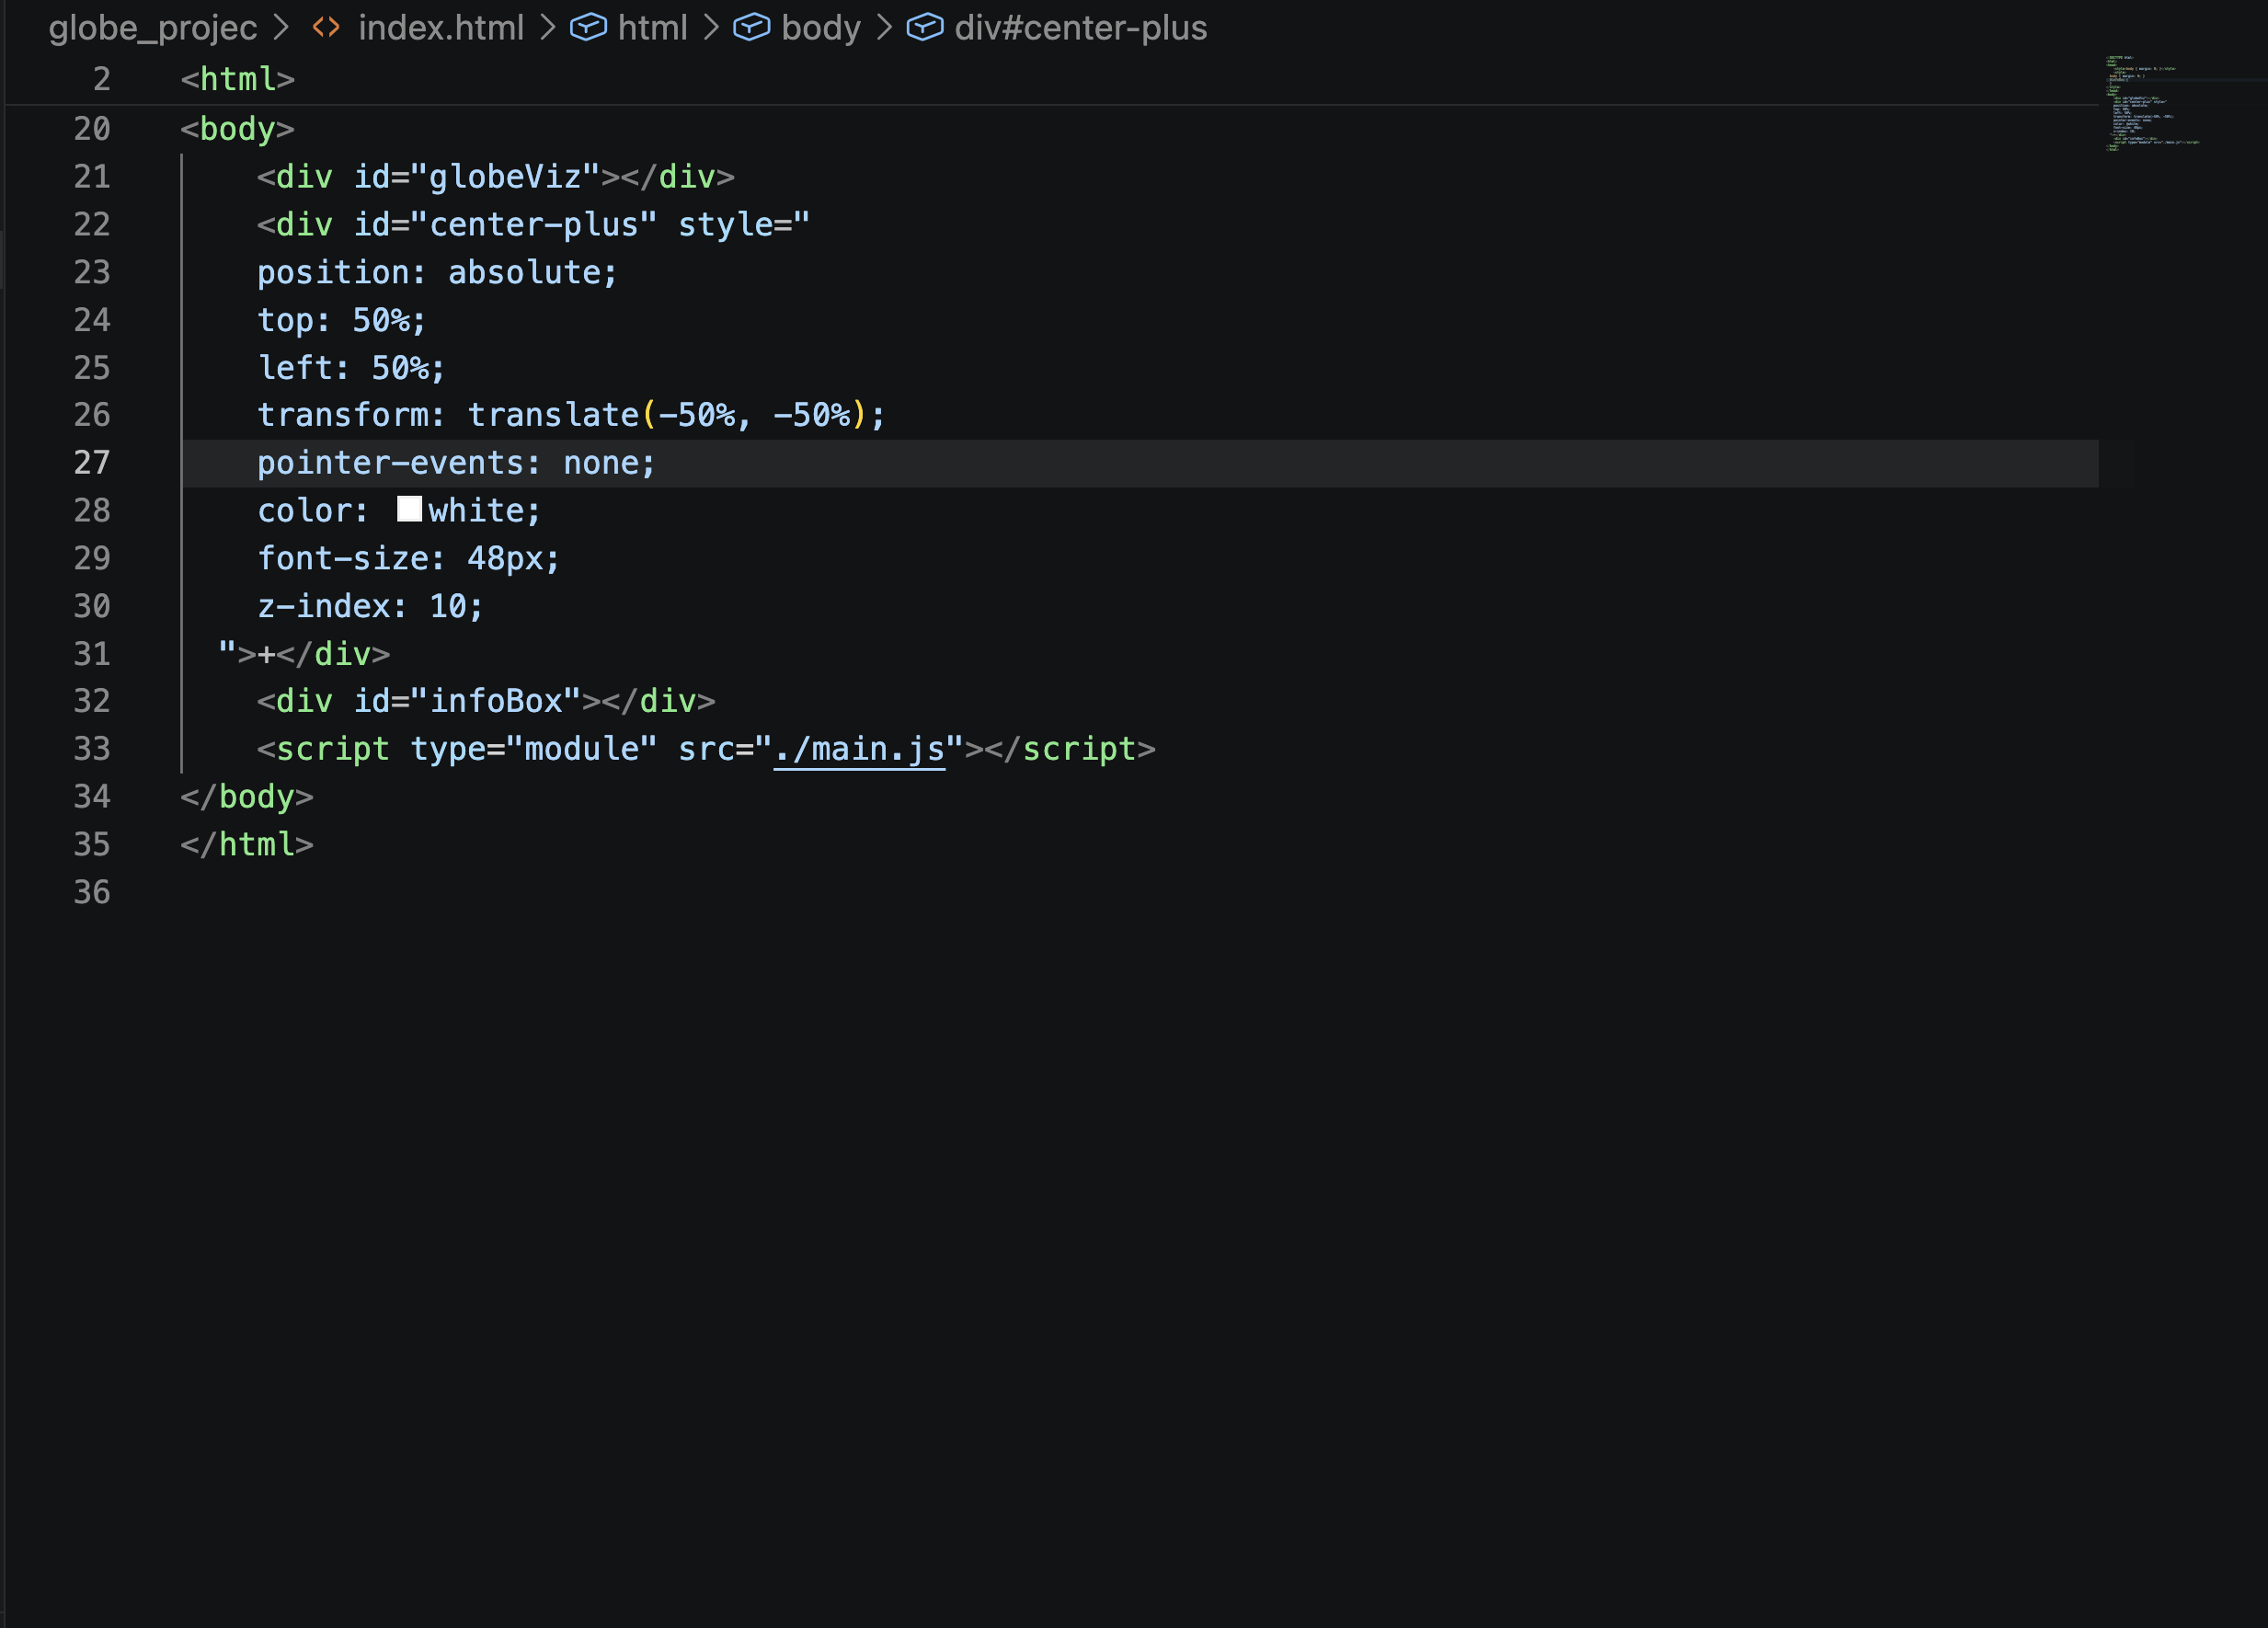
HTML Code
-
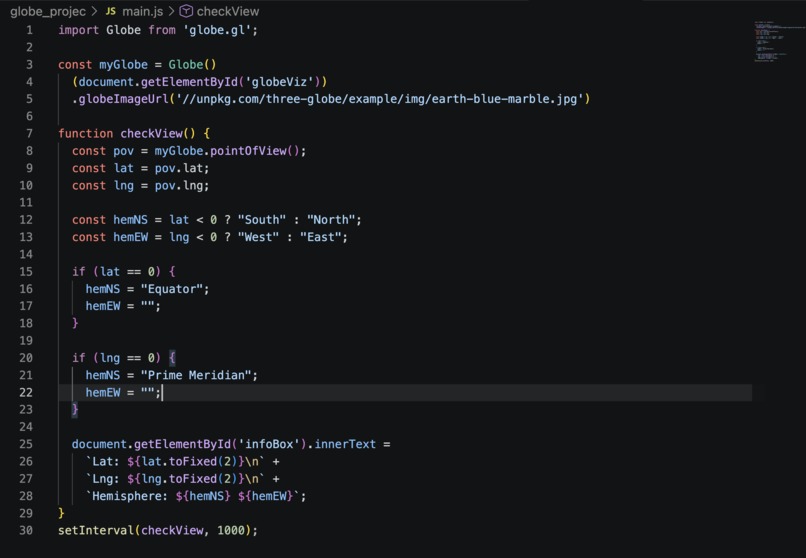
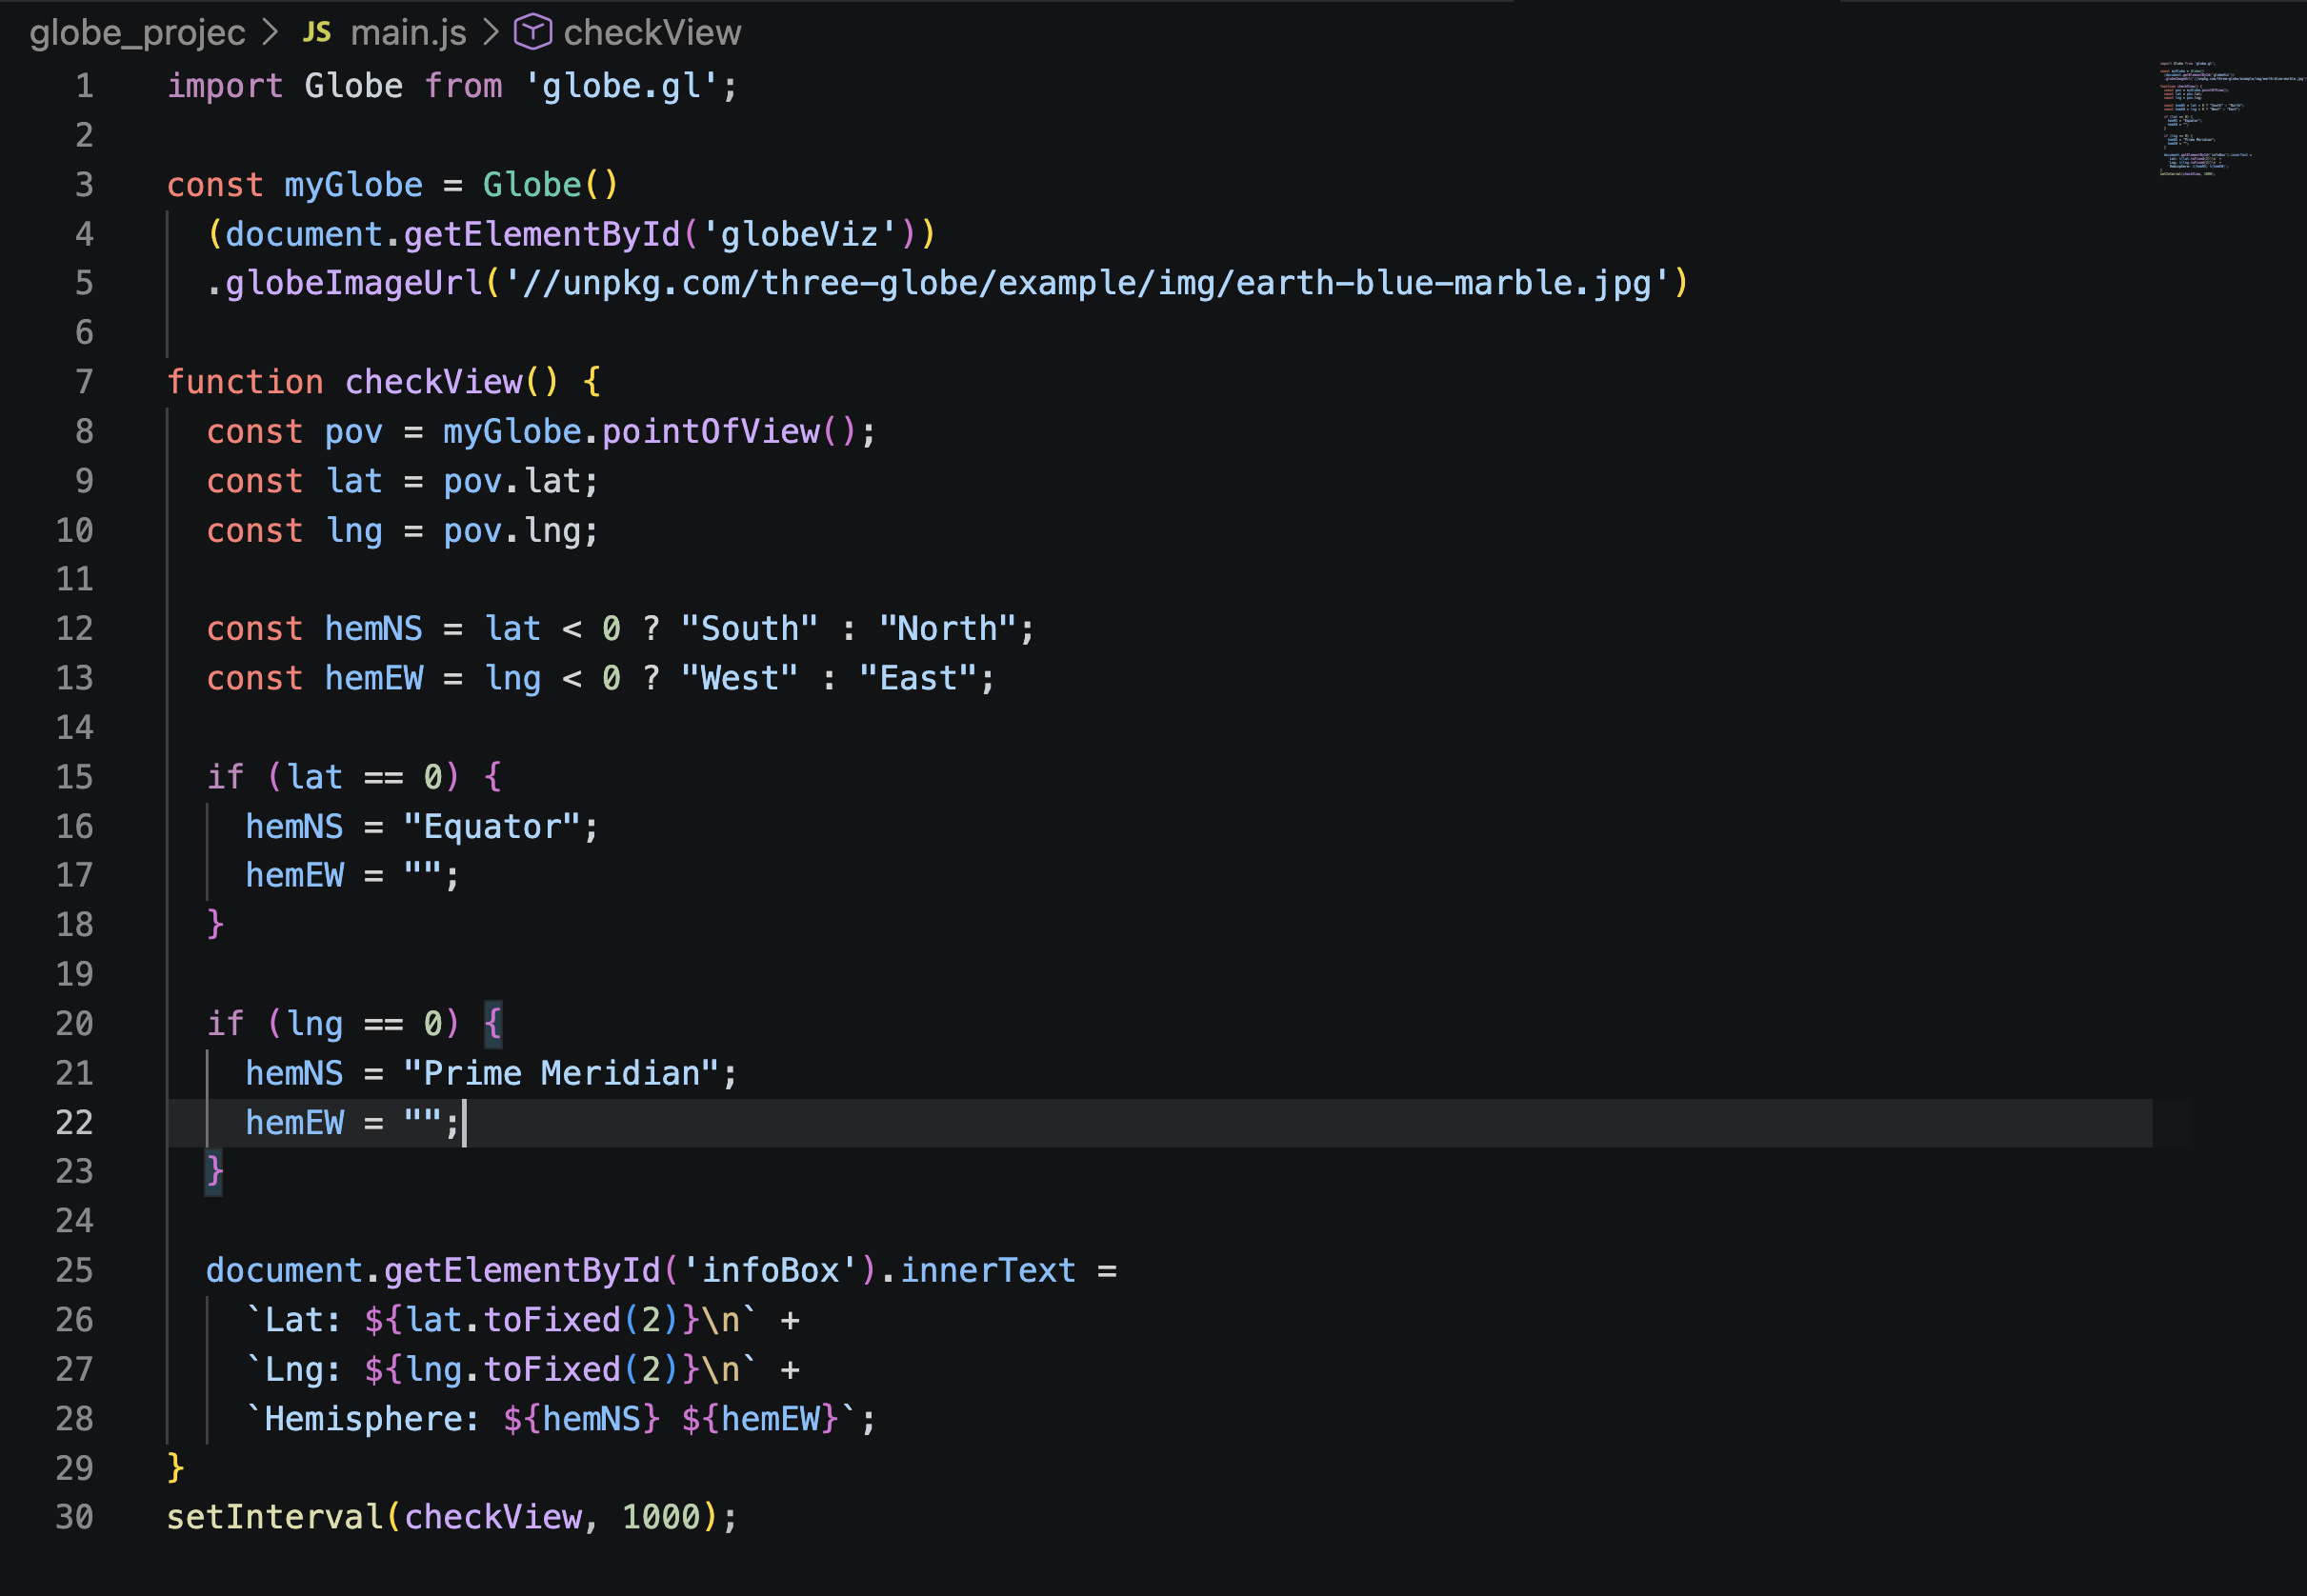
JS Code

This is a beginner project!!!
Inspiration
We were inspired by Windy and other weather tracking websites because it combines interactivity with data and maps.
What it does
The map allows the user to rotate the globe around and see which coordinates and what hemisphere their cursor is currently on.
How we built it
We built this project using Node.js, Globe.gl, JavaScript and HTML on Visual Studio Code.
Challenges we ran into
Some challenges that we ran into were figuring out how to show the globe on screen as well as figuring out the coordinate system so that it is as exact as possible
Accomplishments that we're proud of
We're proud of creating a globe using HTML and making it very interactive for the user.
What we learned
We learned alot about utilizing HTML and other JavaScript tools to make this project possible on a website.
What's next for Interactive Topographical Map of the World
We would continue to add more features on the map such as a weather radar so that there are different ways the user can use this map of the world.


Log in or sign up for Devpost to join the conversation.