-
-
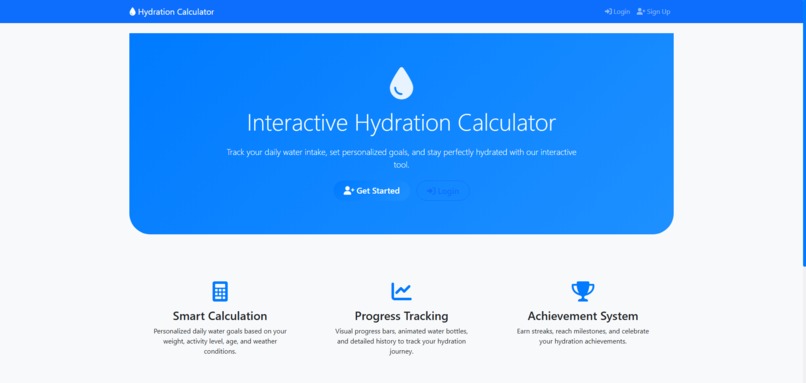
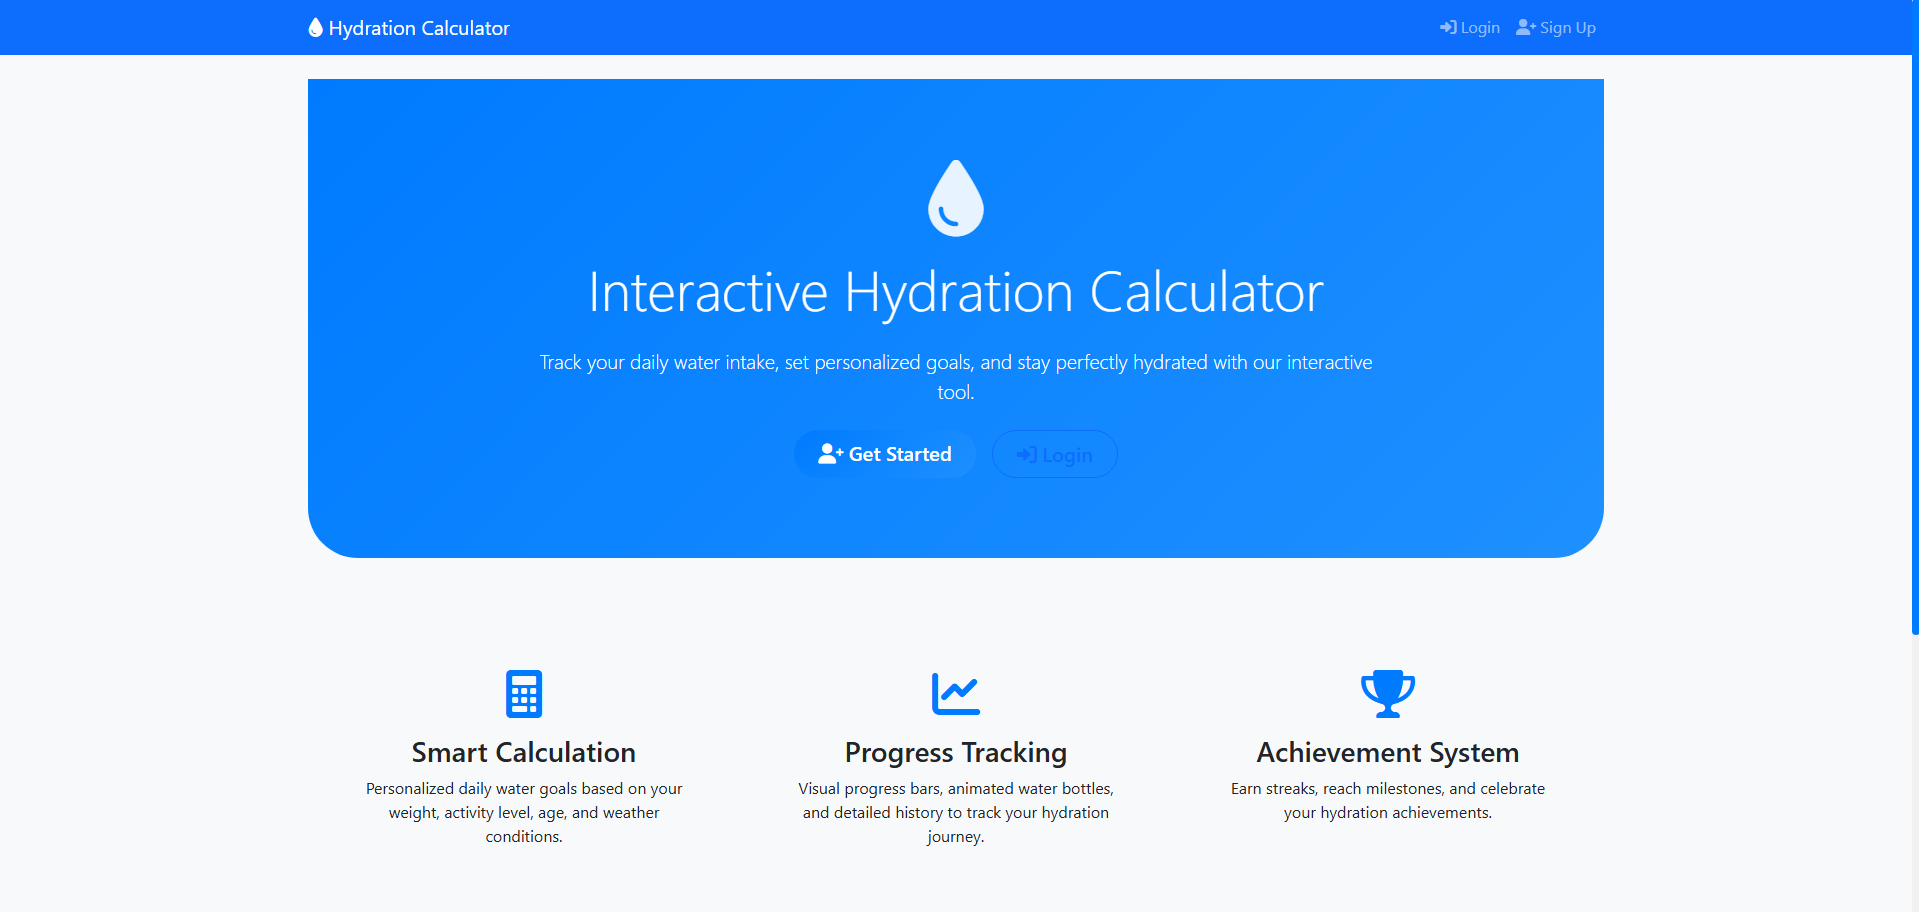
Home Page
-
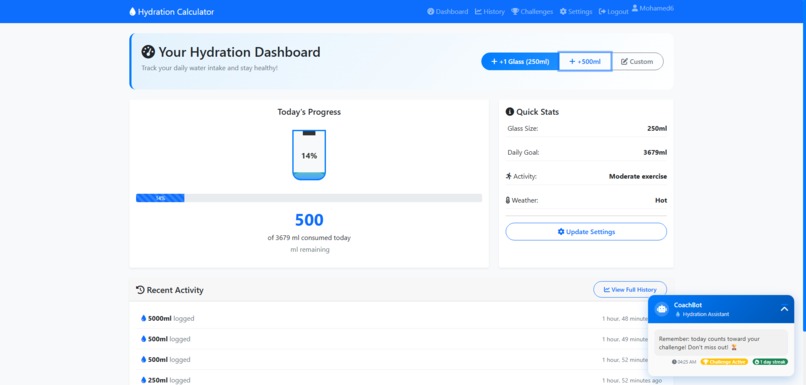
Dashboard
-
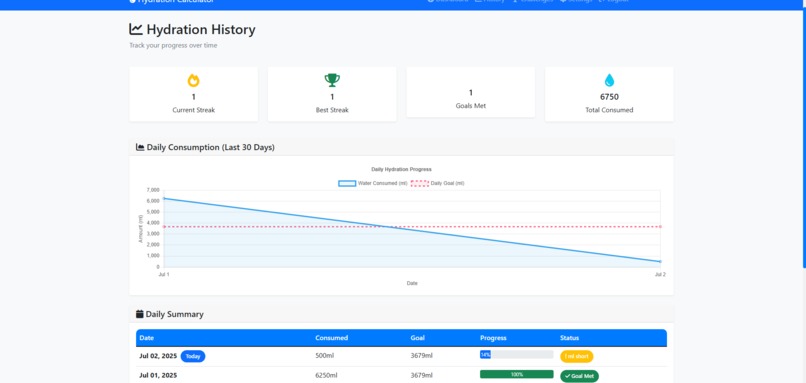
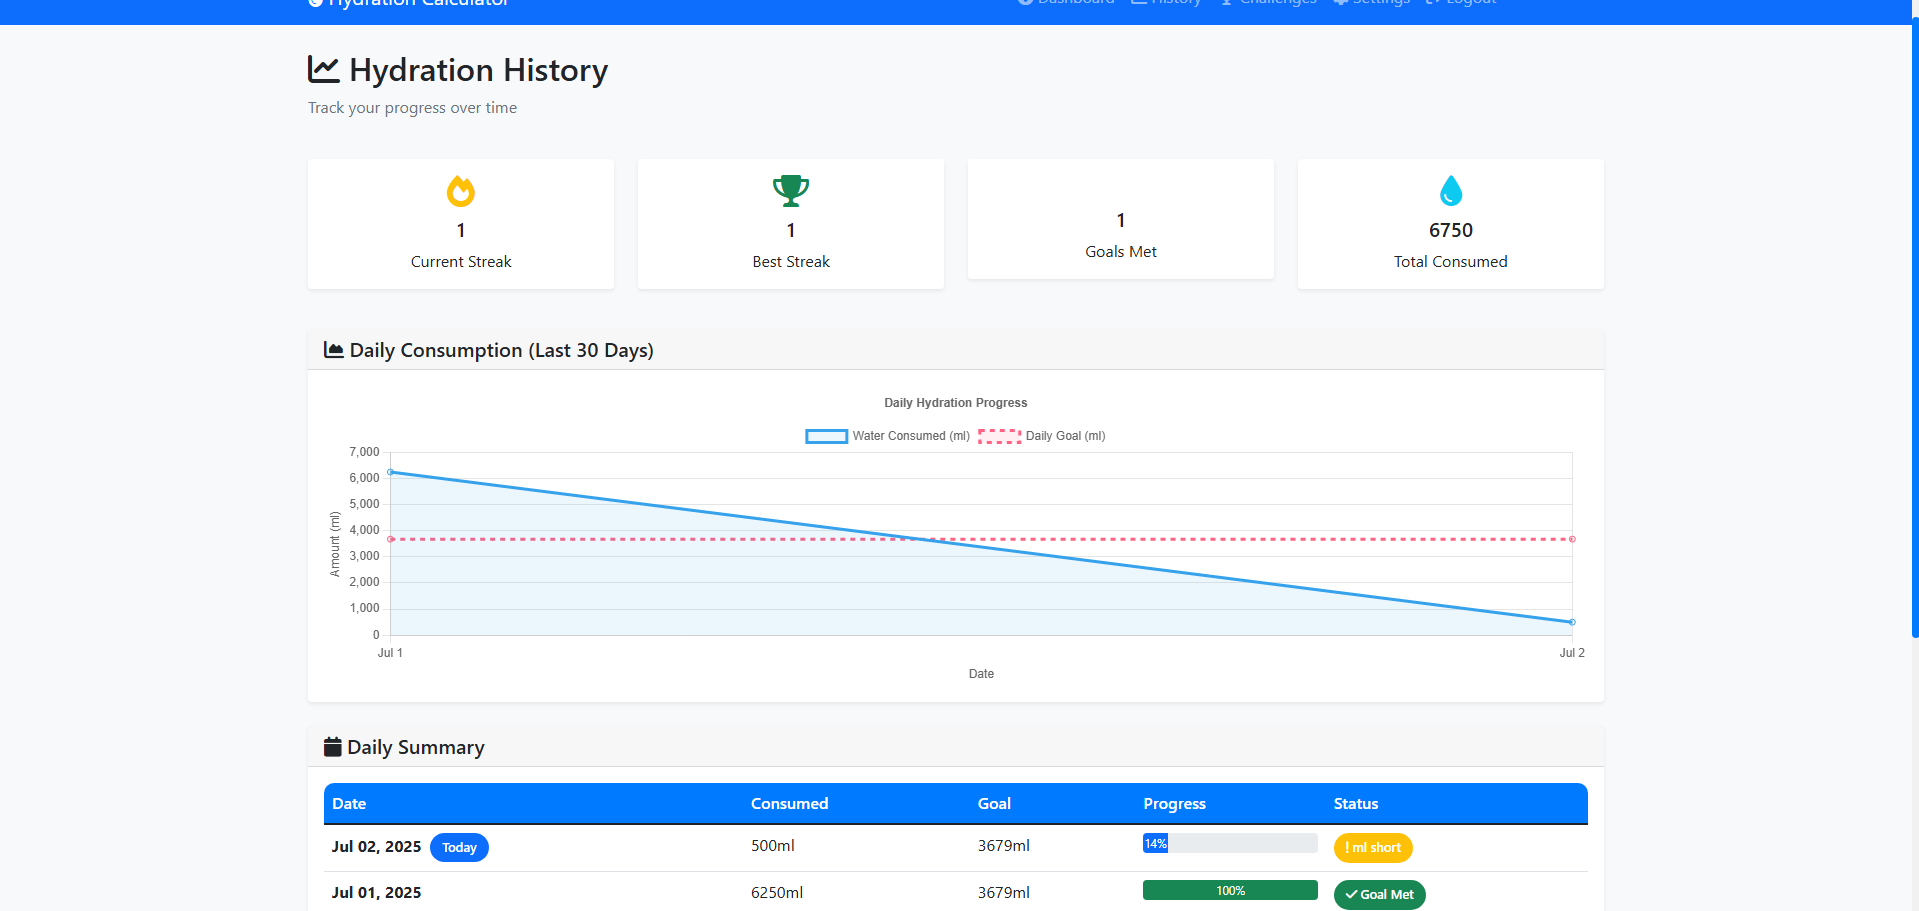
History Page
-

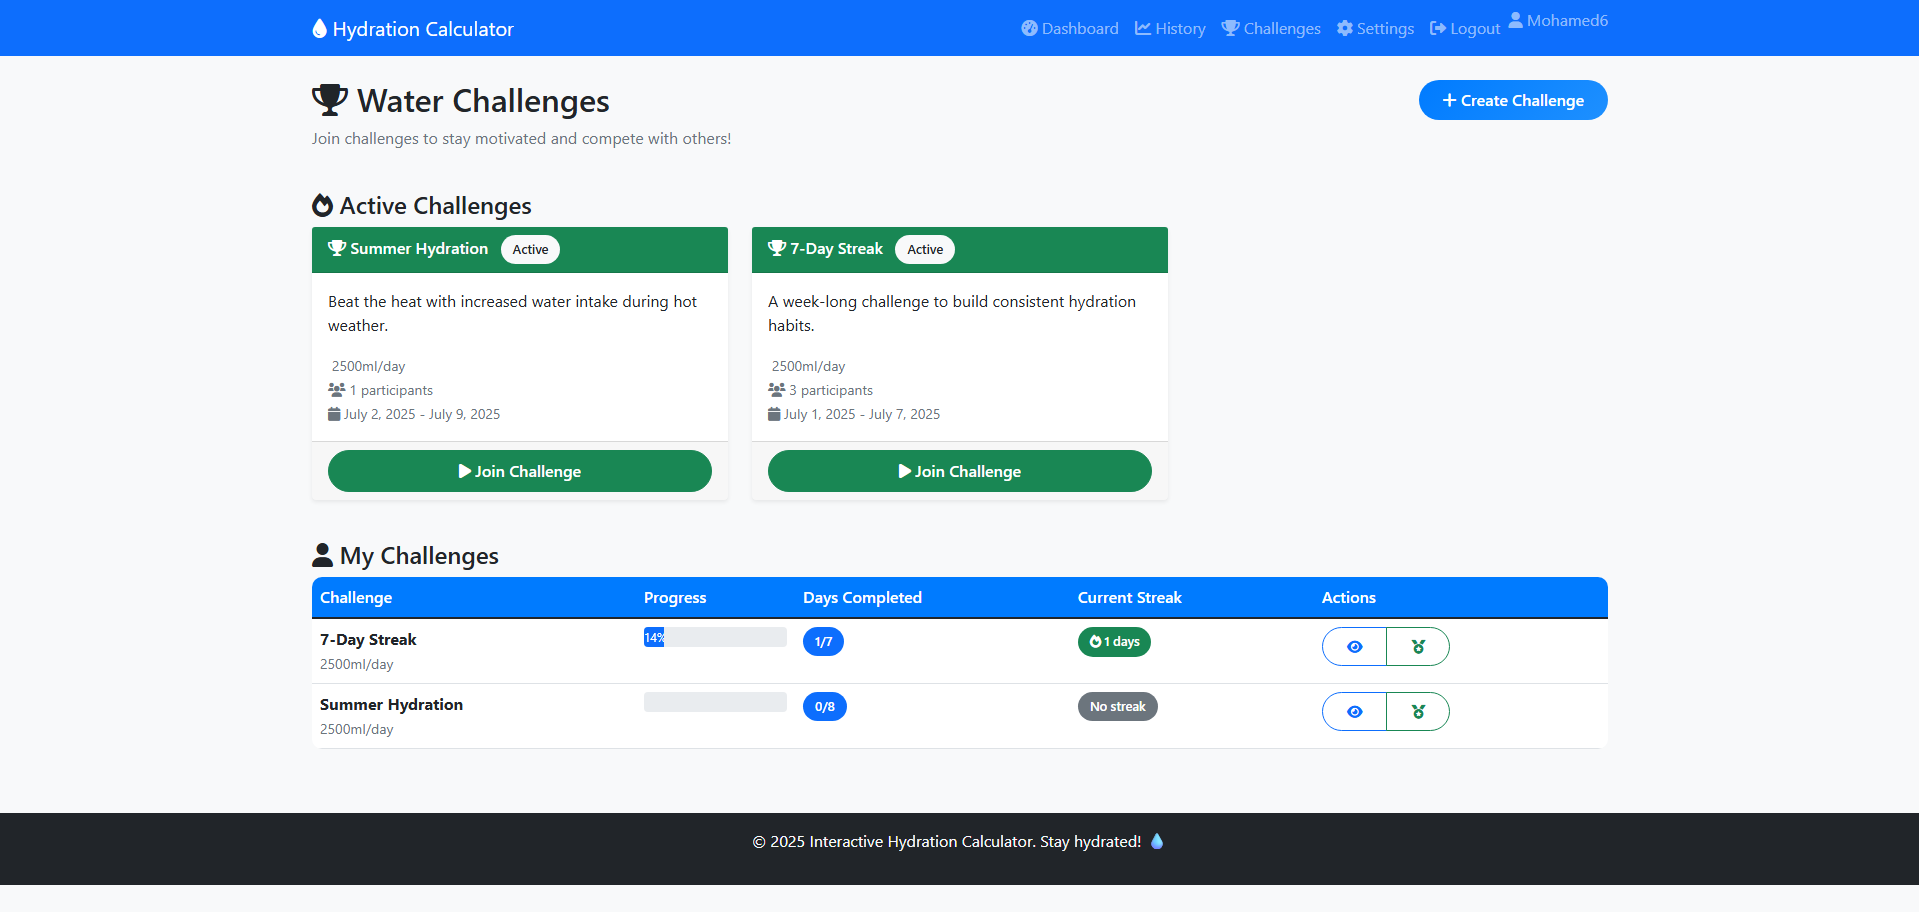
Challenges Page
-
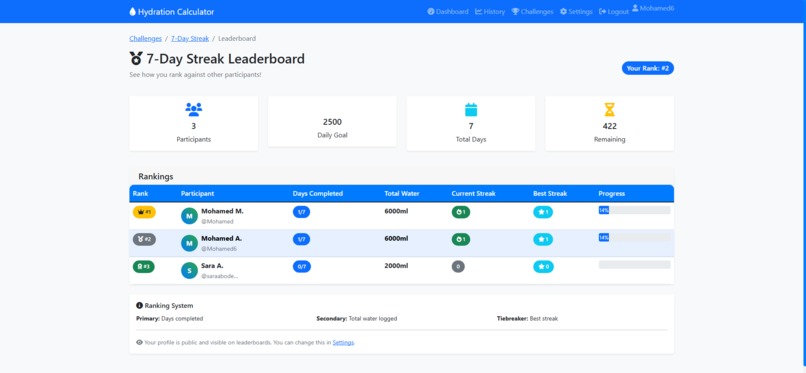
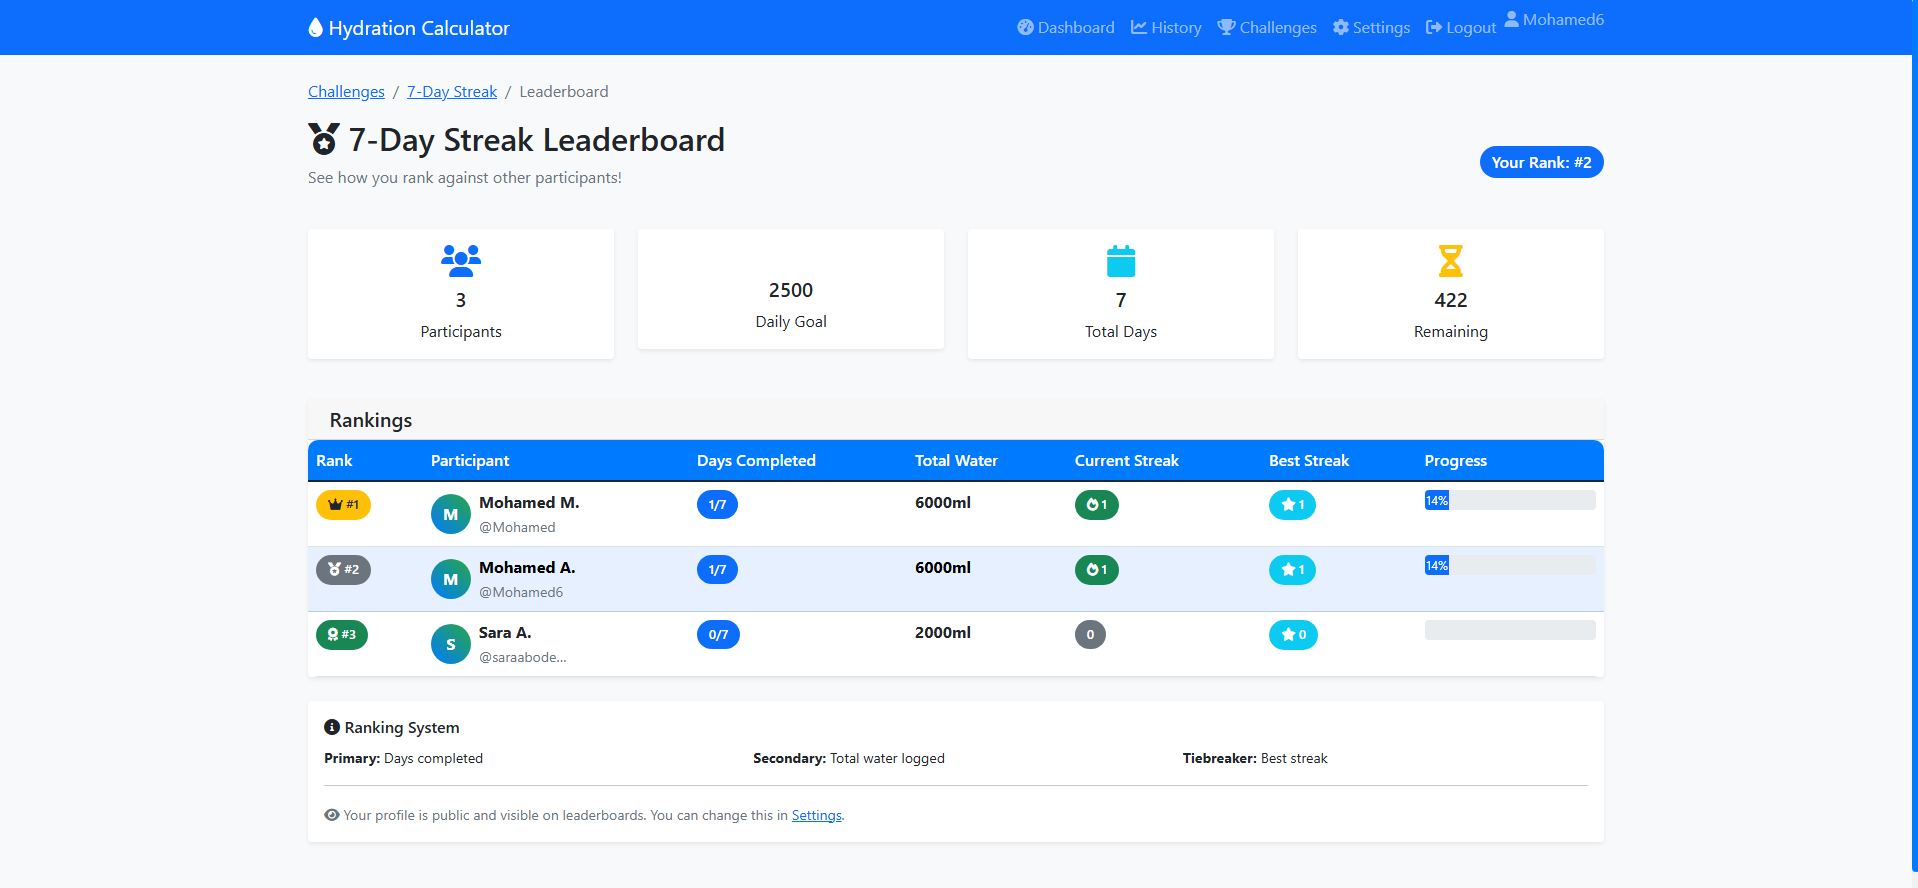
Leaderboard Page

Inspiration
I often found myself at the end of a long day feeling tired, headachy, and just... off. Then it would hit me that I hadn't had a single glass of water all day. It happened more often than I would like to admit. I would get so caught up in classes that I'd completely forget to drink, and I would pay for it later with a headache and zero energy. This experience made us think about how something so simple like drinking water is so easy to forget but at the same time so important. It affects our energy, our mood, and our overall health in countless ways. So we knew there had to be a better way to build this habit, something that felt more like a fun part of the day. That’s where this whole idea started.
What it does
So, we created the Interactive Hydration Calculator. Think of it less like an app and more like a friend for your water bottle. It starts by helping you figure out your personal water goal, so you know what to aim for. But the real fun begins on your dashboard, where you can watch an animated water bottle visually fill up with every glass you log. And To keep you going we built in some fun features:
- Water Challenges: You can join challenges with others to build a consistent habit together.
- Leaderboards and Badges: A little friendly competition never hurts. This lets you see how you stack up against others and earn cool badges for hitting milestones.
- Your Personal History: With some beautiful charts, you can actually see your progress over time.
- The CoachBot: This is our little chatbot friend. It pops up when you open the dashboard with an encouraging message like a “you're doing great!” or warning you in a friendly way if you're falling behind.
How we built it
The website is built with Django and hosted on PythonAnywhere. The frontend is built using HTML, CSS, and JavaScript, with Bootstrap for responsive design and Chart.js for data visualization. All user data is stored in a SQLite database.
Challenges we ran into
We ran into a challenge of making the dashboard feel instant. We had to learn how to use JavaScript to send data to our Django backend and update the page without a full reload which was key to making the water bottle fill up the moment you log a drink. Also deploying the app on PythonAnywhere for the first time was a bit challenging so we learned and made sure everything ran as smoothly online as it did on our computers.
Accomplishments that we're proud of
We are so proud of what we were able to do. And through this journey we learned so much more about just how critical drinking water is for our health and how deeply it affects our daily lives. On the technical side, we are so proud to be able to efficiently integrate the frontend with the backend and the database. But perhaps what we're most proud of is how well we learned to work together. We were able to understand each other even without meeting in person a single time during the entire project.
What we learned
We learned many things through the time we spent making this project. As we said earlier we knew we wanted the dashboard to feel instant but at first we didn't know how to update the water bottle without reloading the entire page. So we had to figure out how and learned more about asynchronous JavaScript. Also we learned the entire development lifecycle from designing the models and writing the backend logic to building the user interface and deploying the finished product for the world to see.
What's next for the Interactive Hydration Calculator
We have plans in our minds to make our project more advanced and more fun like:
- Sync data with applications like Google Fit and Apple HealthKit
- make the chatbot assistant smarter and give the user the ability to ask questions.
- Integrate OpenWeather API to adjust hydration needs based on actual temperature.
- Use a few more languages to support a wider range of users
The Team
- Sara Youssef: worked on both the frontend and backend, developed the django models, created the powerpoint used in the presentation, and video editing.
- Mohamed Mahmoud: also worked on both the frontend and backend, created the interactive user dashboard, integrated Chart.js for data visualization, and made deployment.


Log in or sign up for Devpost to join the conversation.