-
-
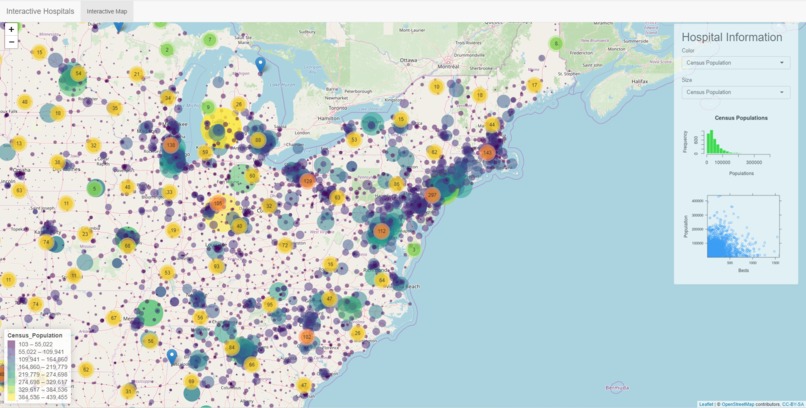
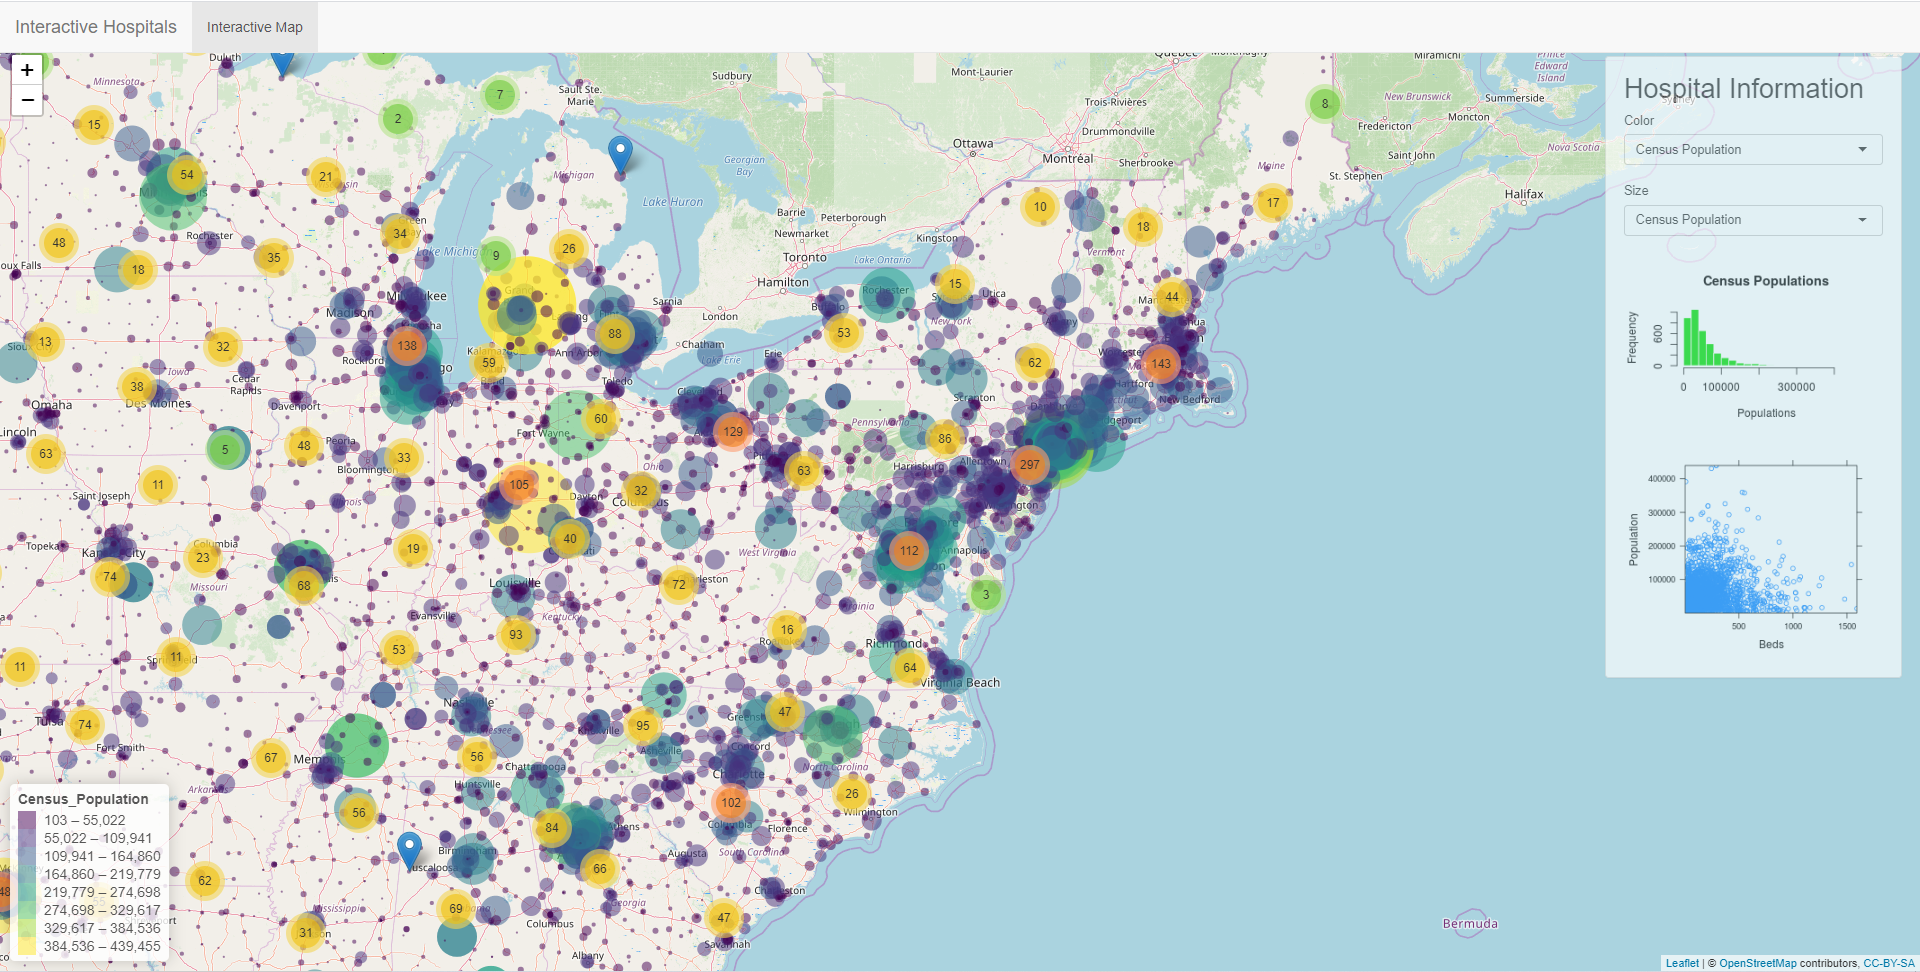
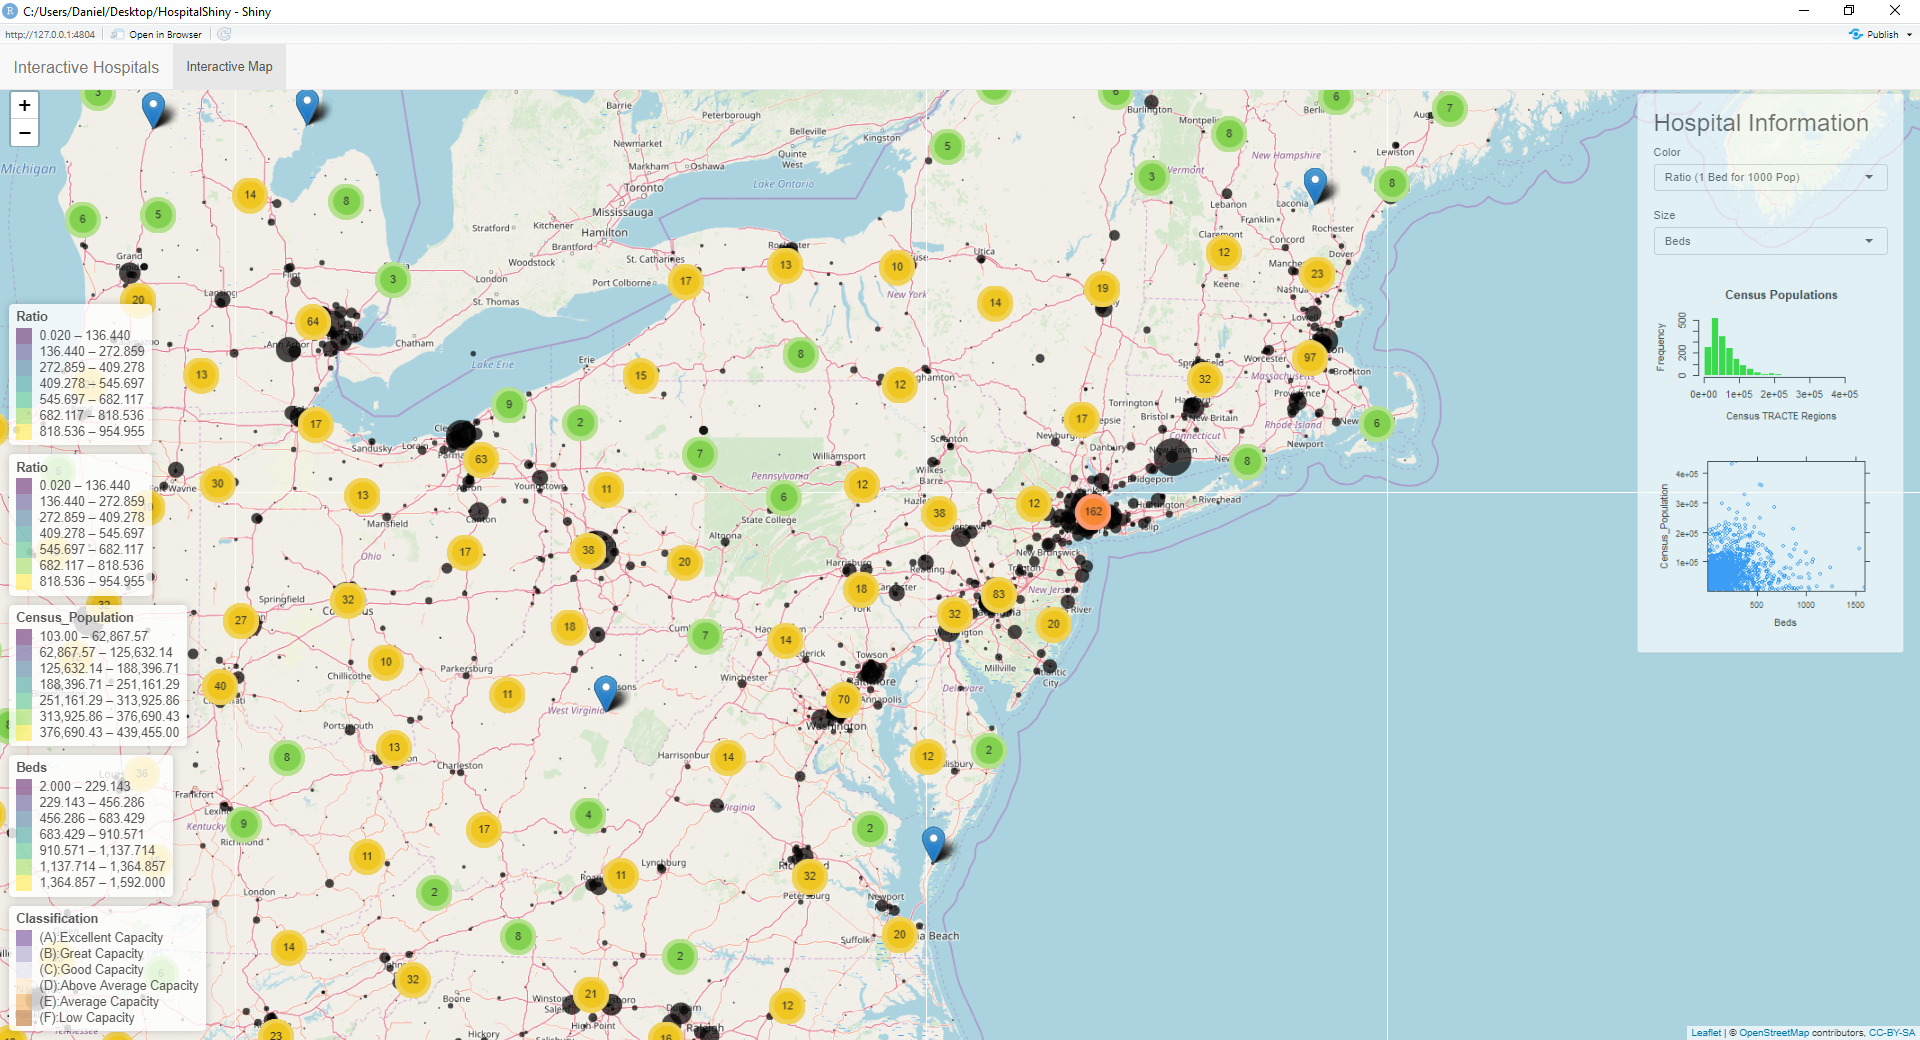
Final Product
-
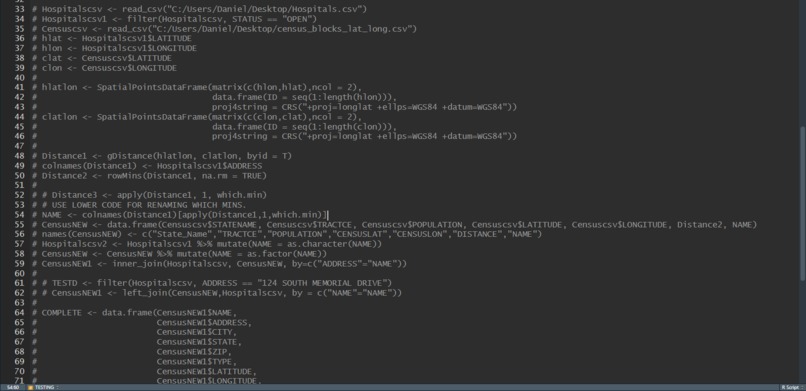
This is the testing field where I created the distance matrix between Lat and Long in both dataframes. I used inner_join by name
-
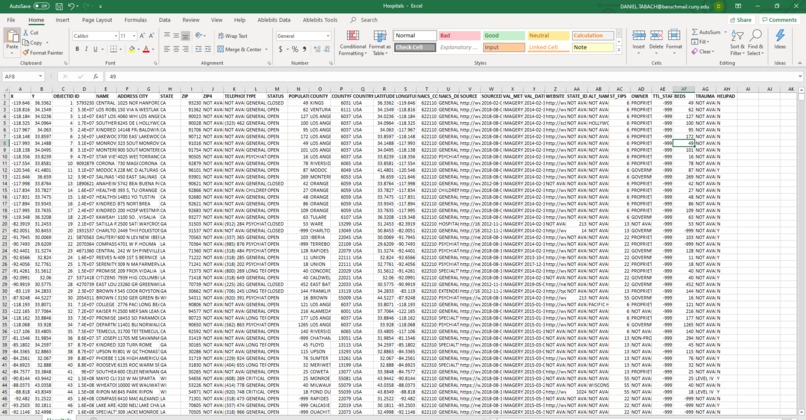
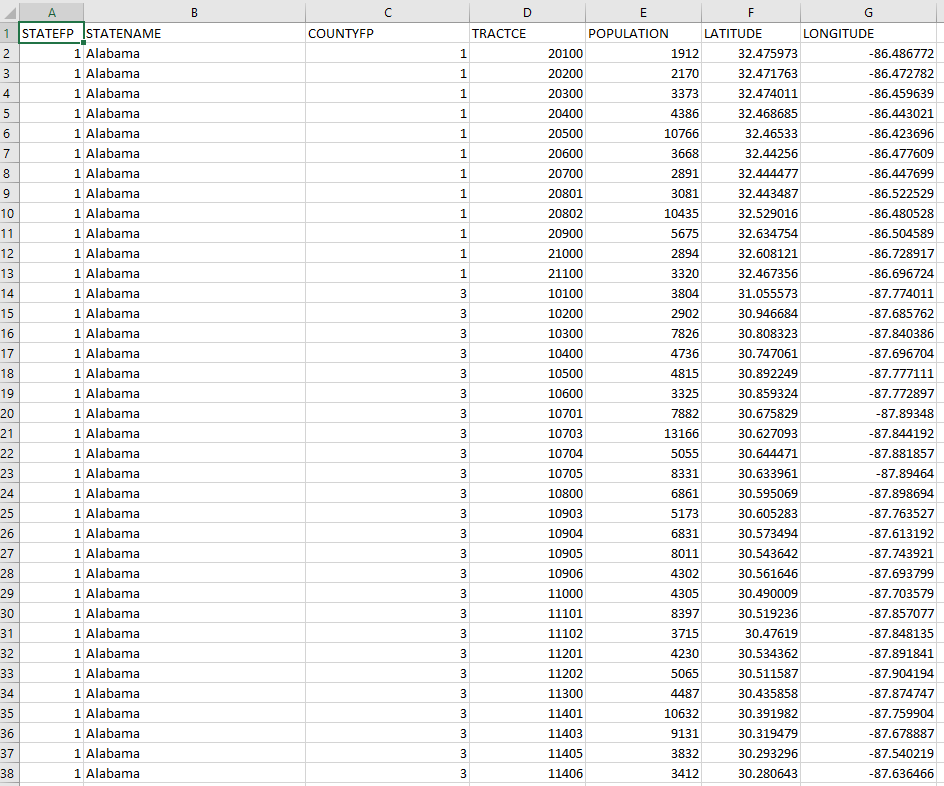
This is the hospital's dataframe. I removed extraneous columns from this set in R.
-
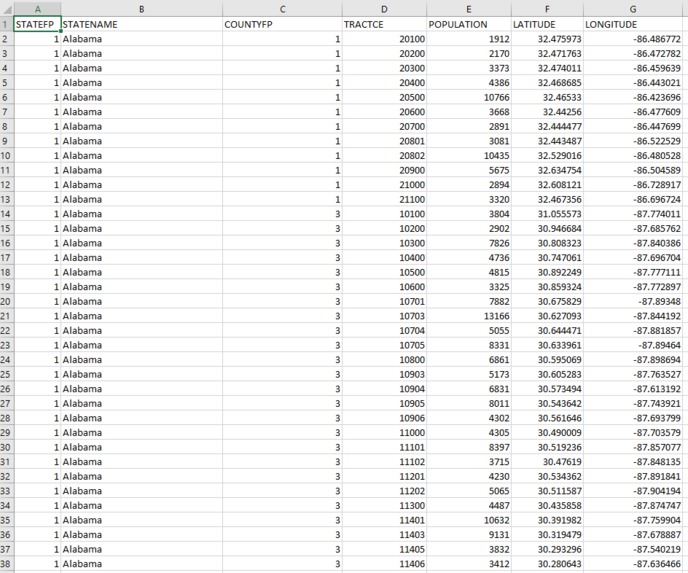
This is a sample of the Census dataframe. I averaged the distances from each lat and long to its closest hospital lat and long.
-
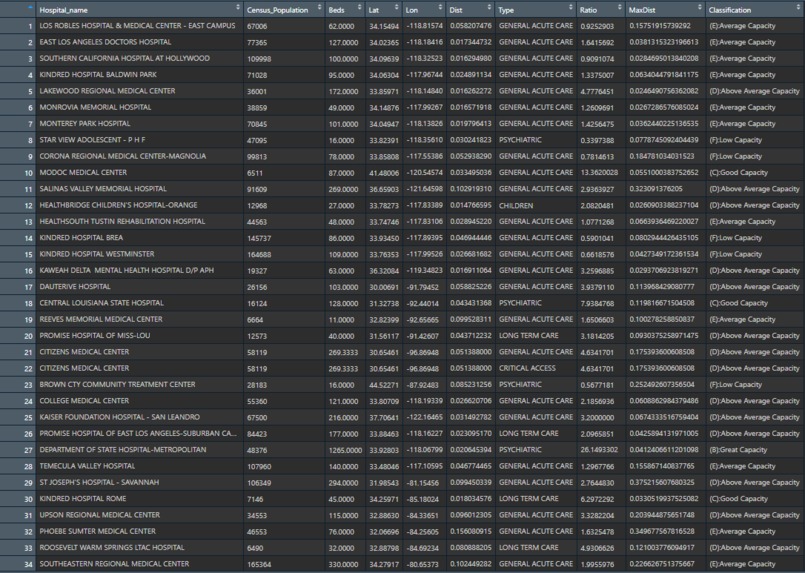
Final joined dataset.
-
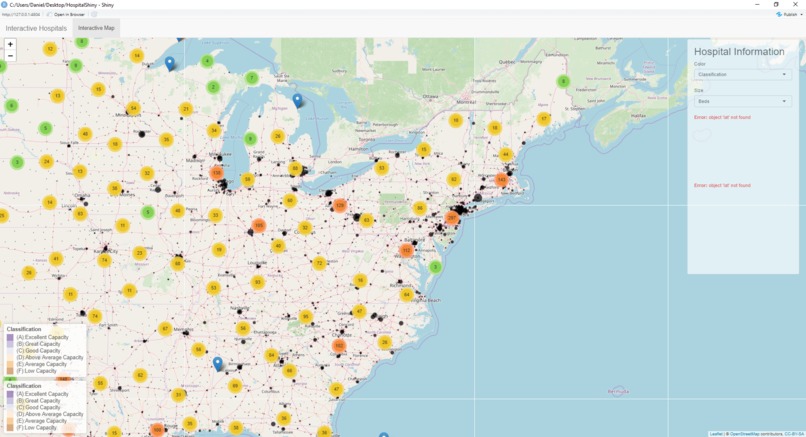
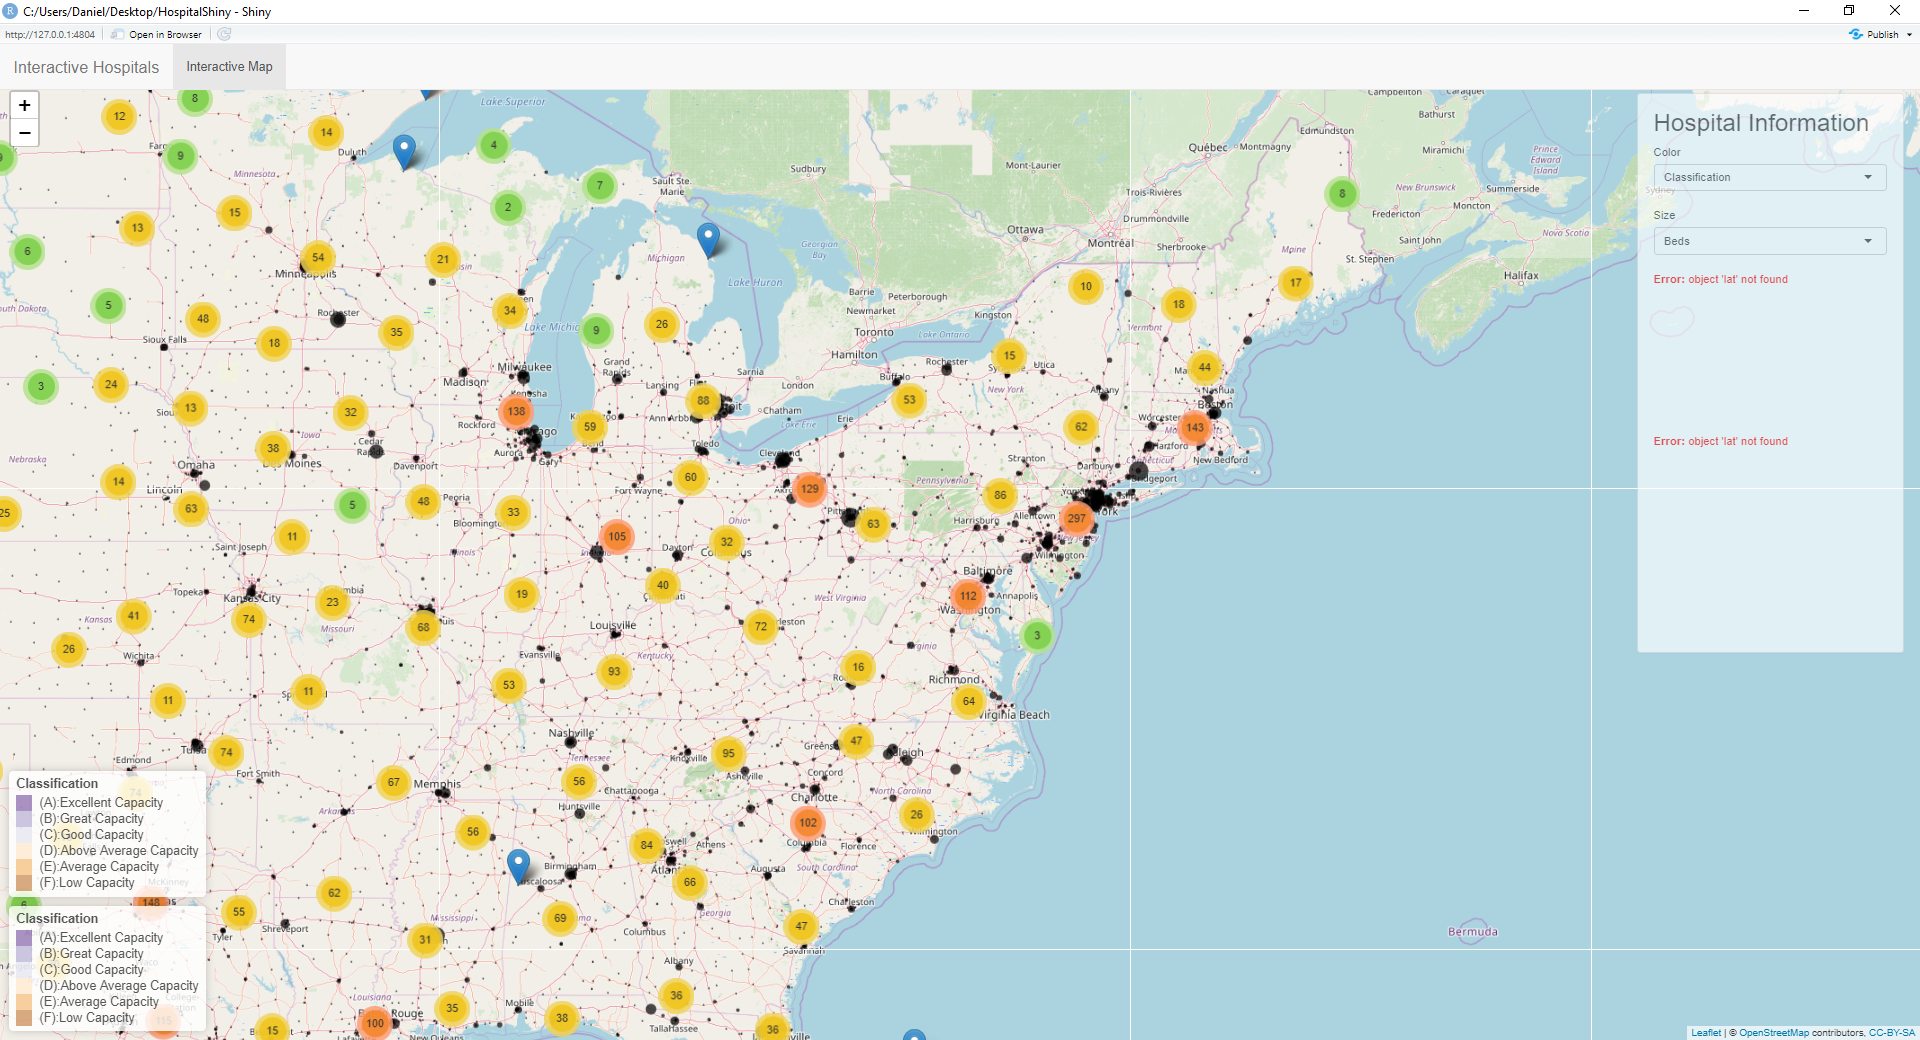
This was the output before. You can see errors on the sidebar with missing variables. The circle colors are also all black.
-
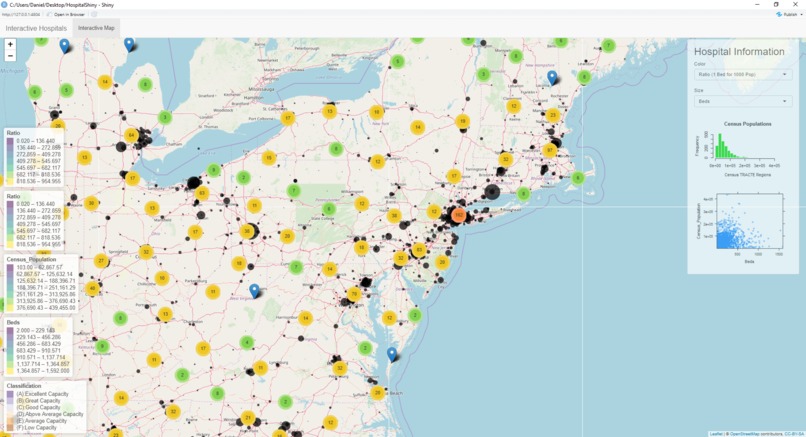
There was an issue with the legends stacking up until they longer fit in the page. I limited it to one legend per selection.


I wanted to see which hospitals would be impacted the most by a future influx of COVID-19 patients. I learned (from Google) that the average hospital has 1 bed per 1000 individuals within that area. Using this ratio, a hospital with 62 beds is meant to support a region with a population of 62000. This seems like a very small amount of beds for a population so large. So I decided to plot all the hospitals from a dataset (which you can find here at my website dannytabach.com under Rstudio). I wanted to see for myself just how incapacitated hospitals would be in the case of a massive outbreak.
For this project, I first inner-joined 2 separate data frames. One was a census that had census regions (TRACTE) with populations, latitude and longitude coordinates. The other data frame was a hospital dataset you can find here
https://hifld-geoplatform.opendata.arcgis.com/datasets/hospitals
I created a distance matrix between each of the census points to the closest hospital from the latitude and longitude points within the dataframes. I used a distance function provided by R called gdistance() and the geosphere package. The census Latitude and Longitude would be paired with the hospital latitude and longitudes. And I found the minimum distance and the closest hospital to each census point. I then summed all the census populations in each row for all unique census regions to get a total.
I also made a ratio column using the 1 to 1000 rule that hospitals generally use for determining bed amount. If the hospital had less than 1 bed per thousand people in the area, it would be categorized as "low capacity". If it has a higher ratio, the capacity rating increases the higher the ratio is. This ratio is in the dataset and helps with visualizing how much capacity a hospital has for the nearby population.
When I first played around with leaflet, I saw how much of a better improvement it was compared to the ggmap package I used in my previous project. I looked up youtube tutorials and scoured through stack exchange to use Leaflet, and exploited their HTML capabilities in R. Leaflet is a package for creating maps similar to ggmap, but this package has the added benefit of being interactive. I used their website https://rstudio.github.io/leaflet/ to learn about this package. And played around with it by incorporating the hospital data.
I worked with Shiny once as well at my current internship to create a dashboard, and I did research on ways to make the Shiny map more interactive with reactive() functions. The trickiest challenge was finding a creative way to make the histogram and scatter plot react to what the user is looking at. I had to figure out how to force the map bounds to react to the latitude and longitude lines of the user view. You can find the source code in the server.R file.
Finally I debugged some of the issues and inconsistencies with the variable names(See some of the problems in the pictures), and launched it on Shiny. I had to play around with the various buttons multiple times to make sure everything was functioning and the circle sizes did not cover the entire map.
In the future I will add a method for the user to filter out hospitals that do not meet a certain criteria. I also plan on adding an interactive data table to this app, and let the user explore the data for themselves. I think this is very bare-bones, and there is a lot of room for improvement and refinement. But I believe in such worrying times, having clear and available knowledge about hospital access is vital for saving lives and allocating hospital resources.
On the map you can zoom in and click on the circles for census information and hospital information. And you can click on the dots for more specific information about that hospital. The selections on the right are interchangeable to see how hospitals compare to each other in terms of capacity, population, beds, and the ratio. Check out the demo below!
Built With
- dplyr
- leaflet.js
- r
- shiny


Log in or sign up for Devpost to join the conversation.