-
-
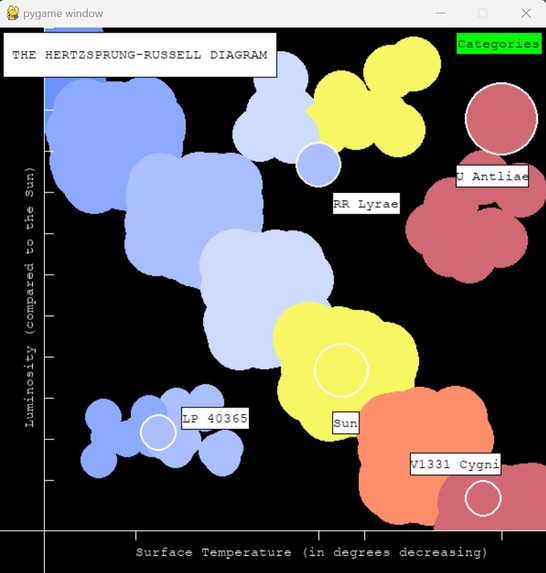
This is what the program looks like when you run it
-
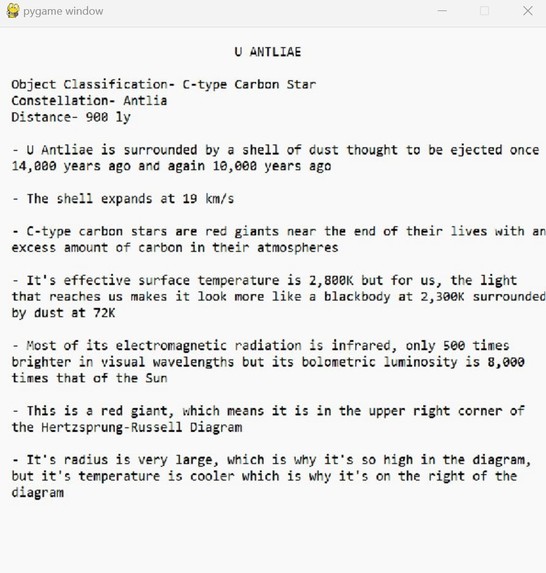
This is what one of the results is, all the stars outlined in white will give similar information.


NOTE FOR VISHNU: I DIDNT WANT TO RICK ROLL YOU SORRY I DONT HAVE A YOUTUBE LINK SO UNFORTUNATELY ALL I HAVE IS A RICK ROLL LINK HERE IS MY ACTUAL LINK FOR MY ACTUAL PROJECT: https://drive.google.com/file/d/1eEEEhaCLR53vYFzpdQjc6sqei1oK7UdD/view?usp=sharing
Inspiration --> I've studied a lot of astronomy things for Science Olympiad and I like stellar evolution a lot, and a really efficient representation of basic stellar evolution is the Hertzsprung-Russell diagram, so I wanted to make a program display an HR diagram and give some information on some of my favorite Deep Space Objects.
What it does --> It plots an HR Diagram which plots stars' luminosity against their temperature with relation to their size. The higher radius it is, the higher it is on the diagram. The stars that are outlined in white and are labeled are interactive, and you can click on them for information about them.
Challenges we ran into --> Figuring out the layers that different objects were drawing ontop of each other was difficult to keep track of.
How was it built --> I used pycharm and pygame and some classes I wrote either in class or completely on my own.
Built With
- pycharm
- pygame

Log in or sign up for Devpost to join the conversation.