Inspiration
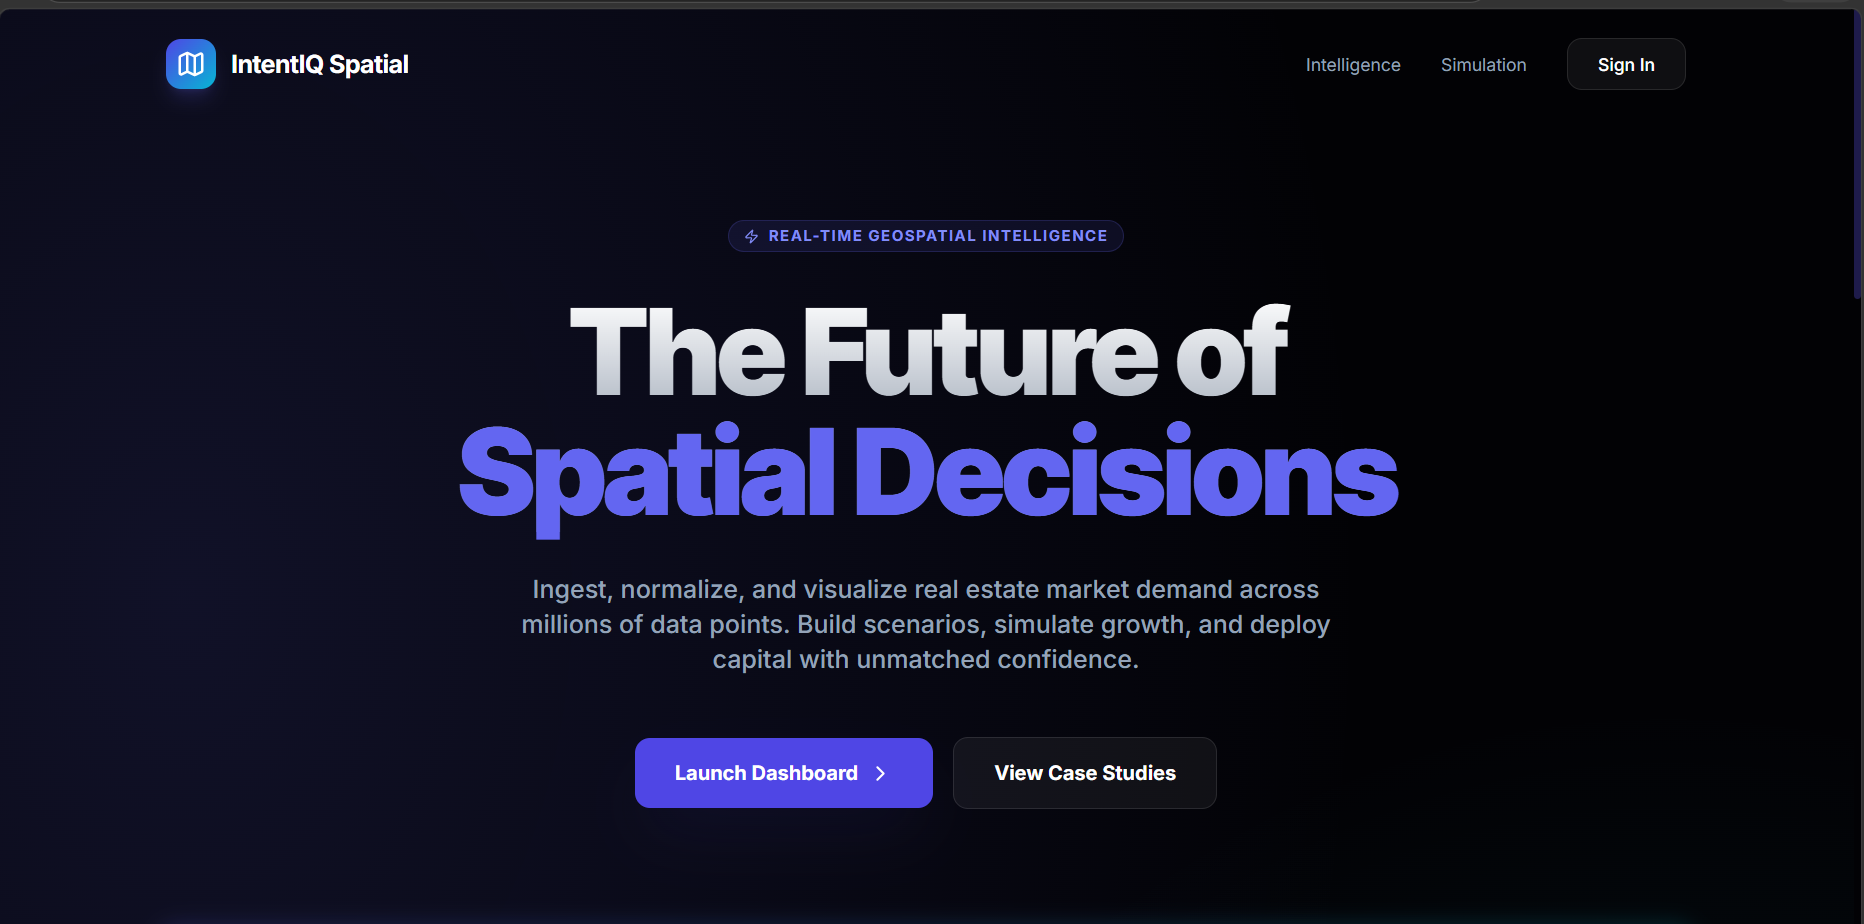
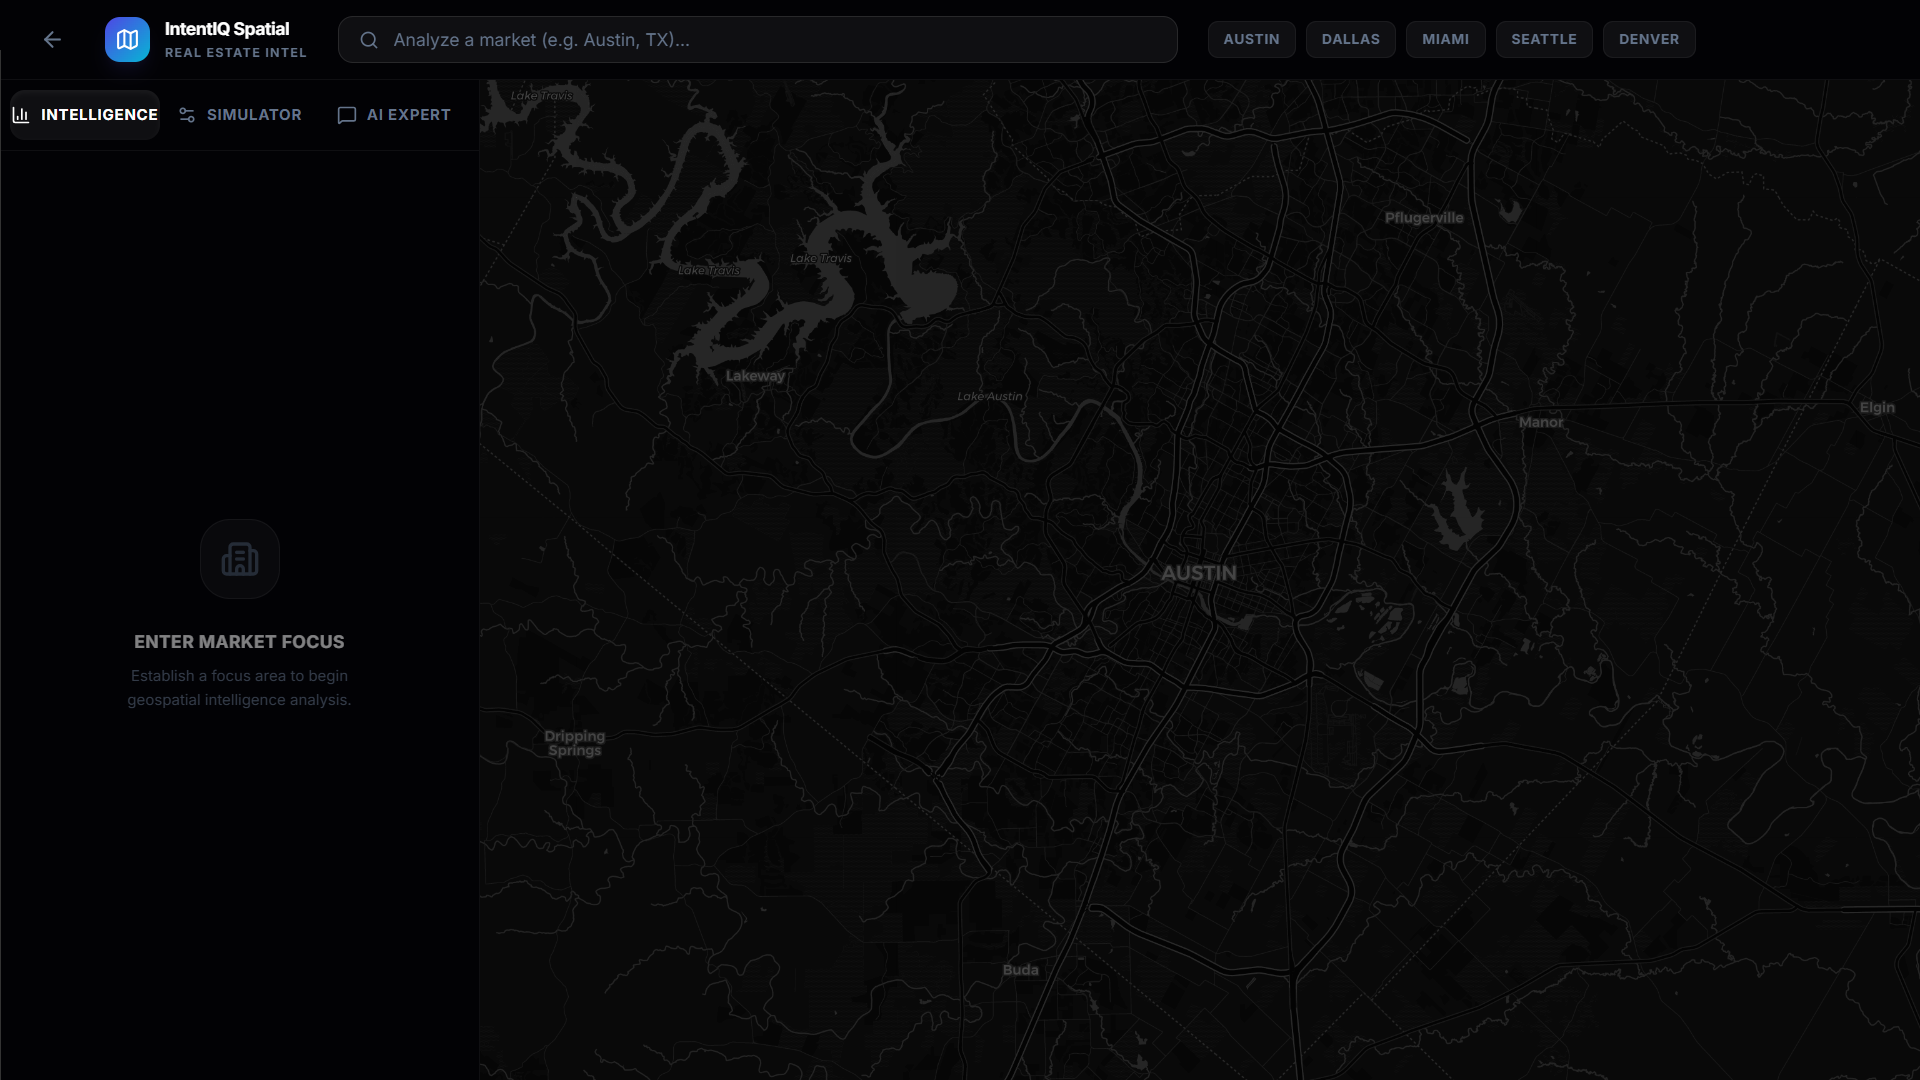
The commercial real estate industry still largely relies on static, retrospective reports to make multi-million dollar investments. We realized that true alpha doesn't come from knowing what happened last quarter, but from predicting what happens next quarter. We wanted to build a "Reality Engine" that fuses leading macro-economic indicators (like job growth and search momentum) with high-fidelity spatial data, allowing analysts to instantly visualize the geographical impact of an economic shock before it happens.
What it does
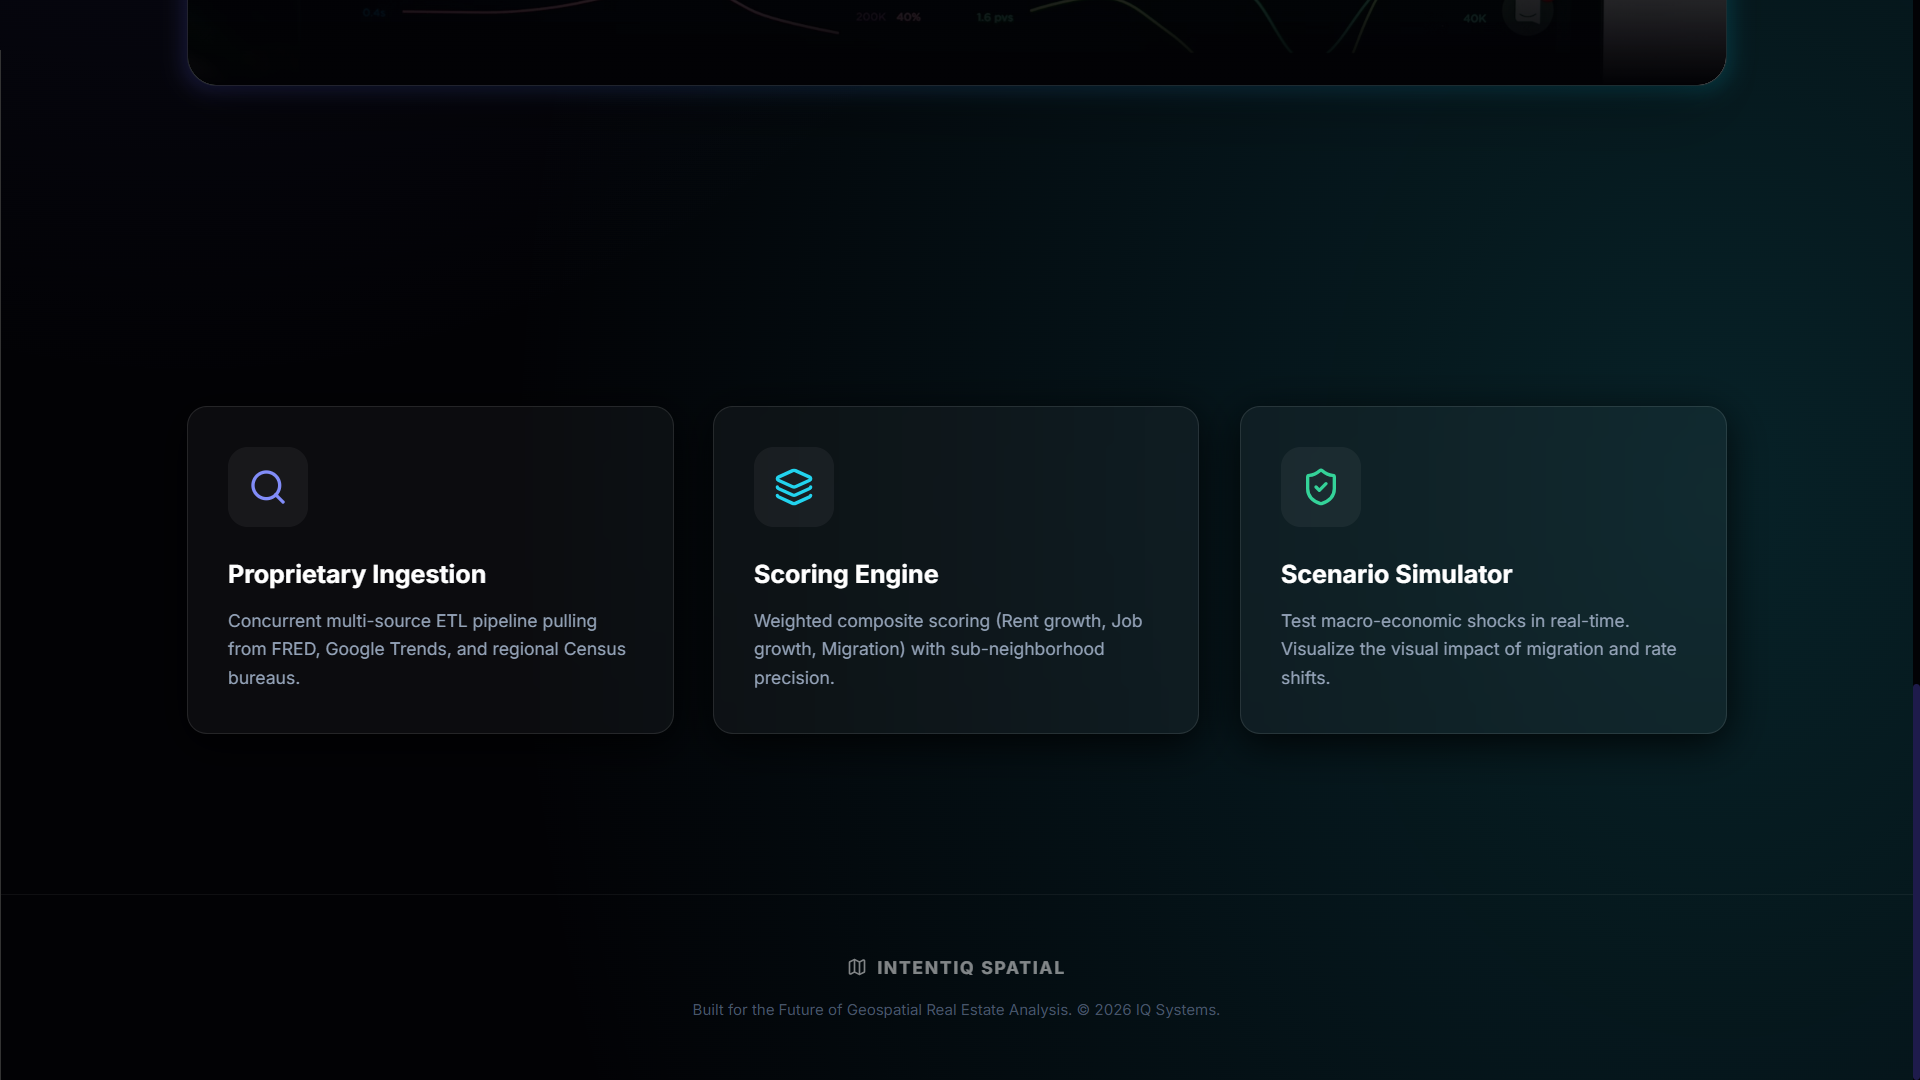
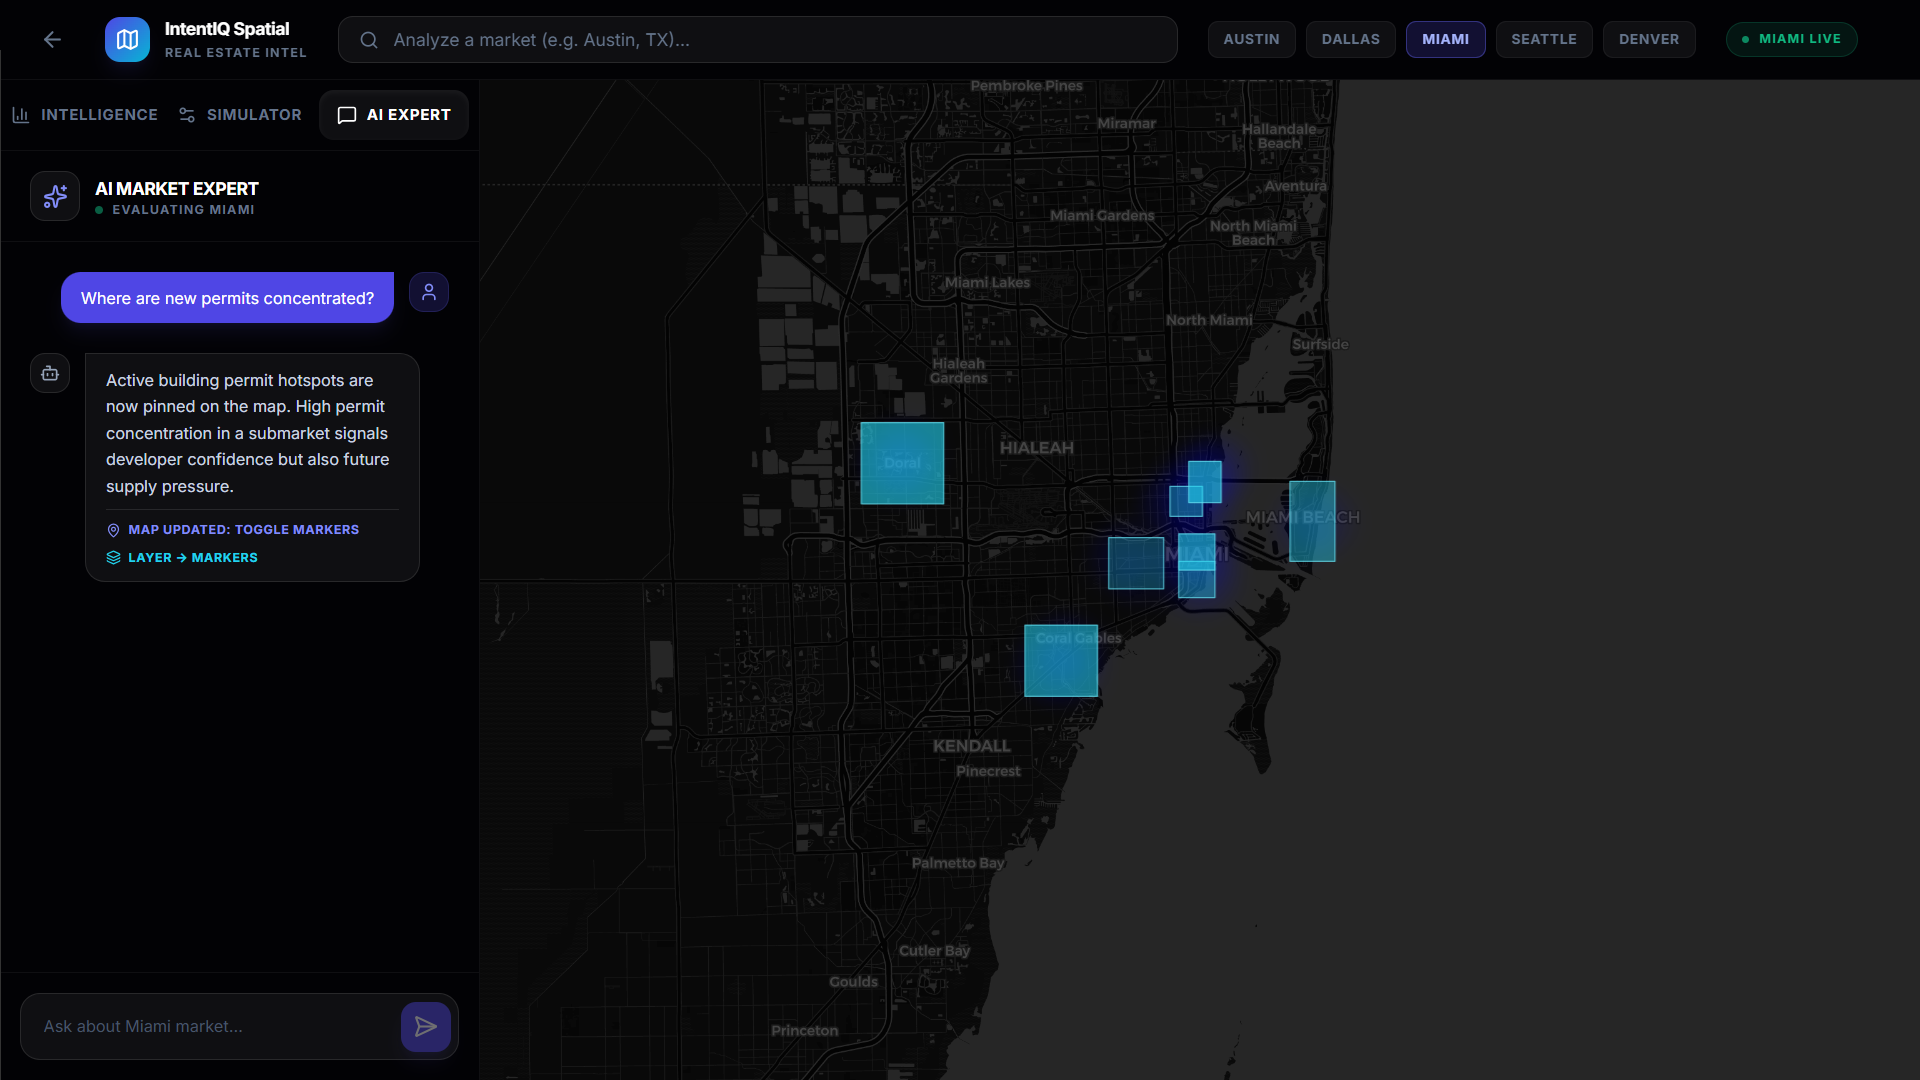
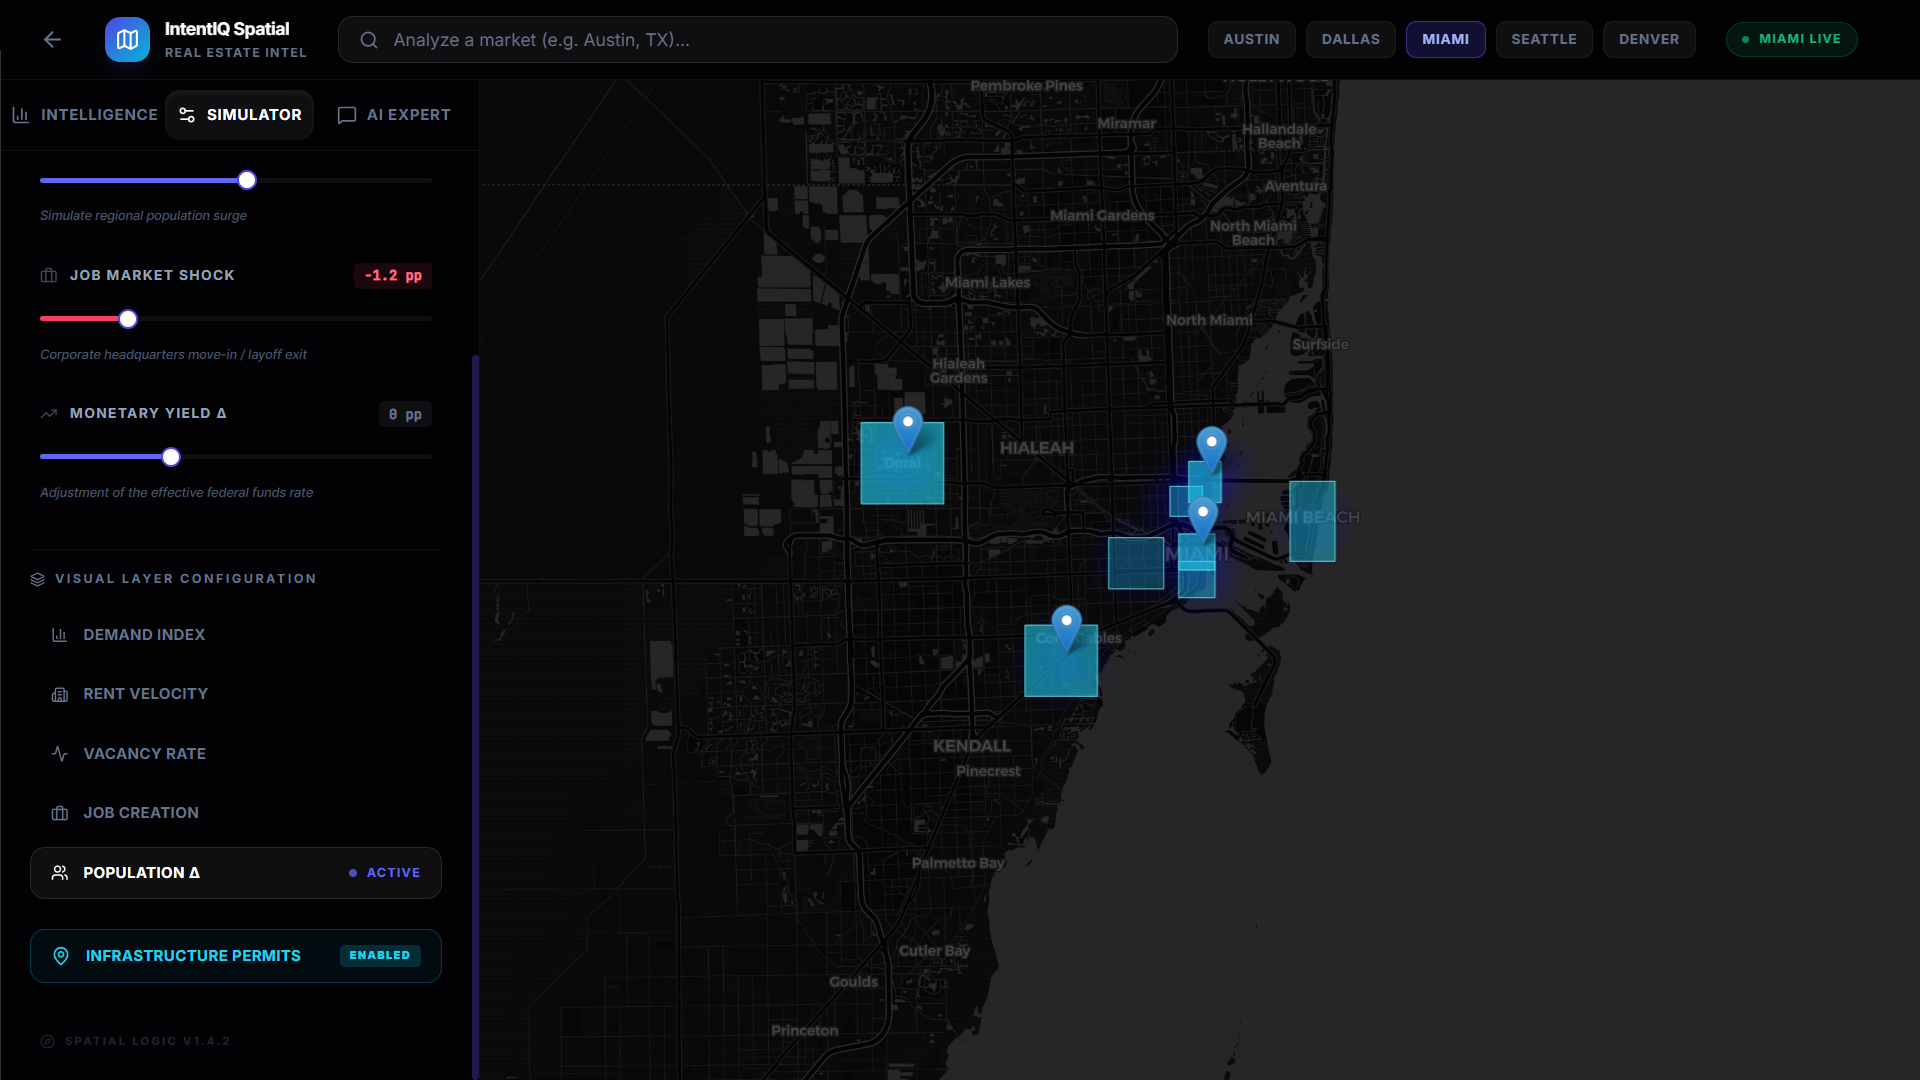
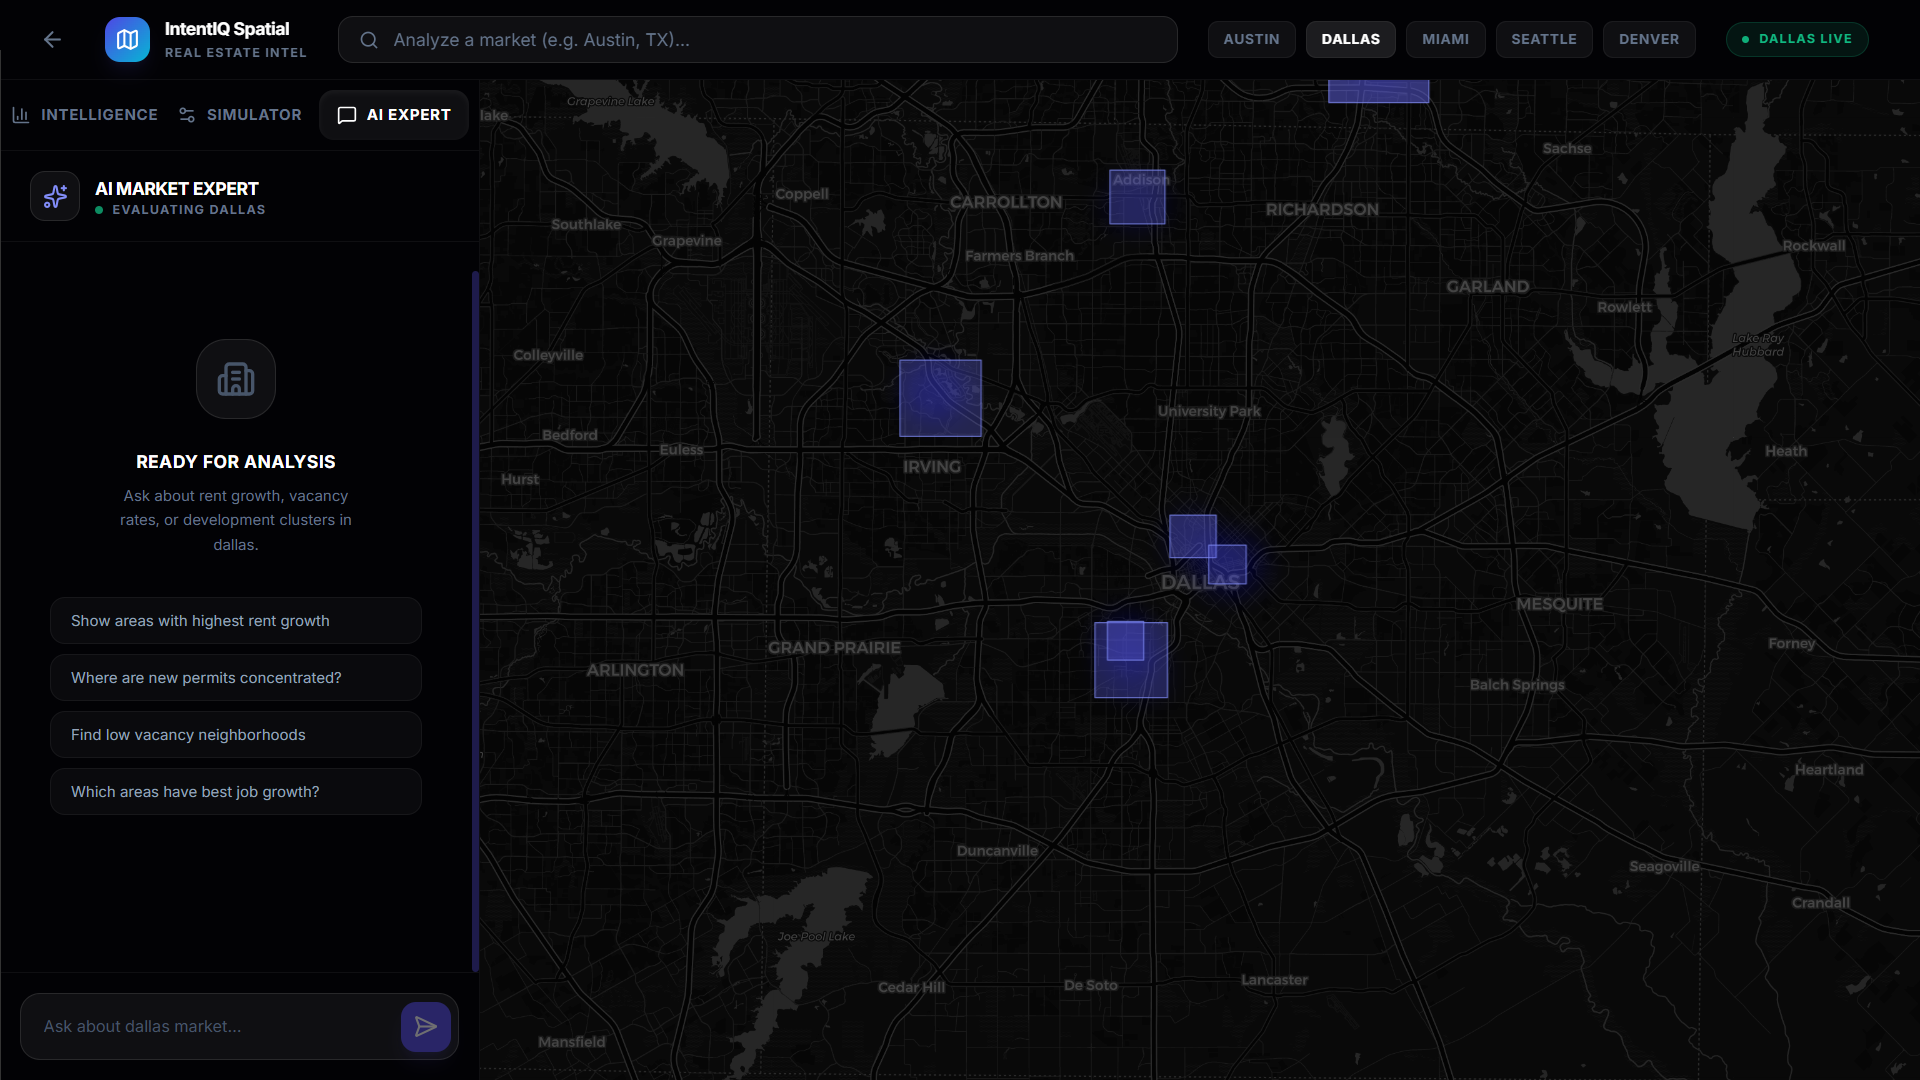
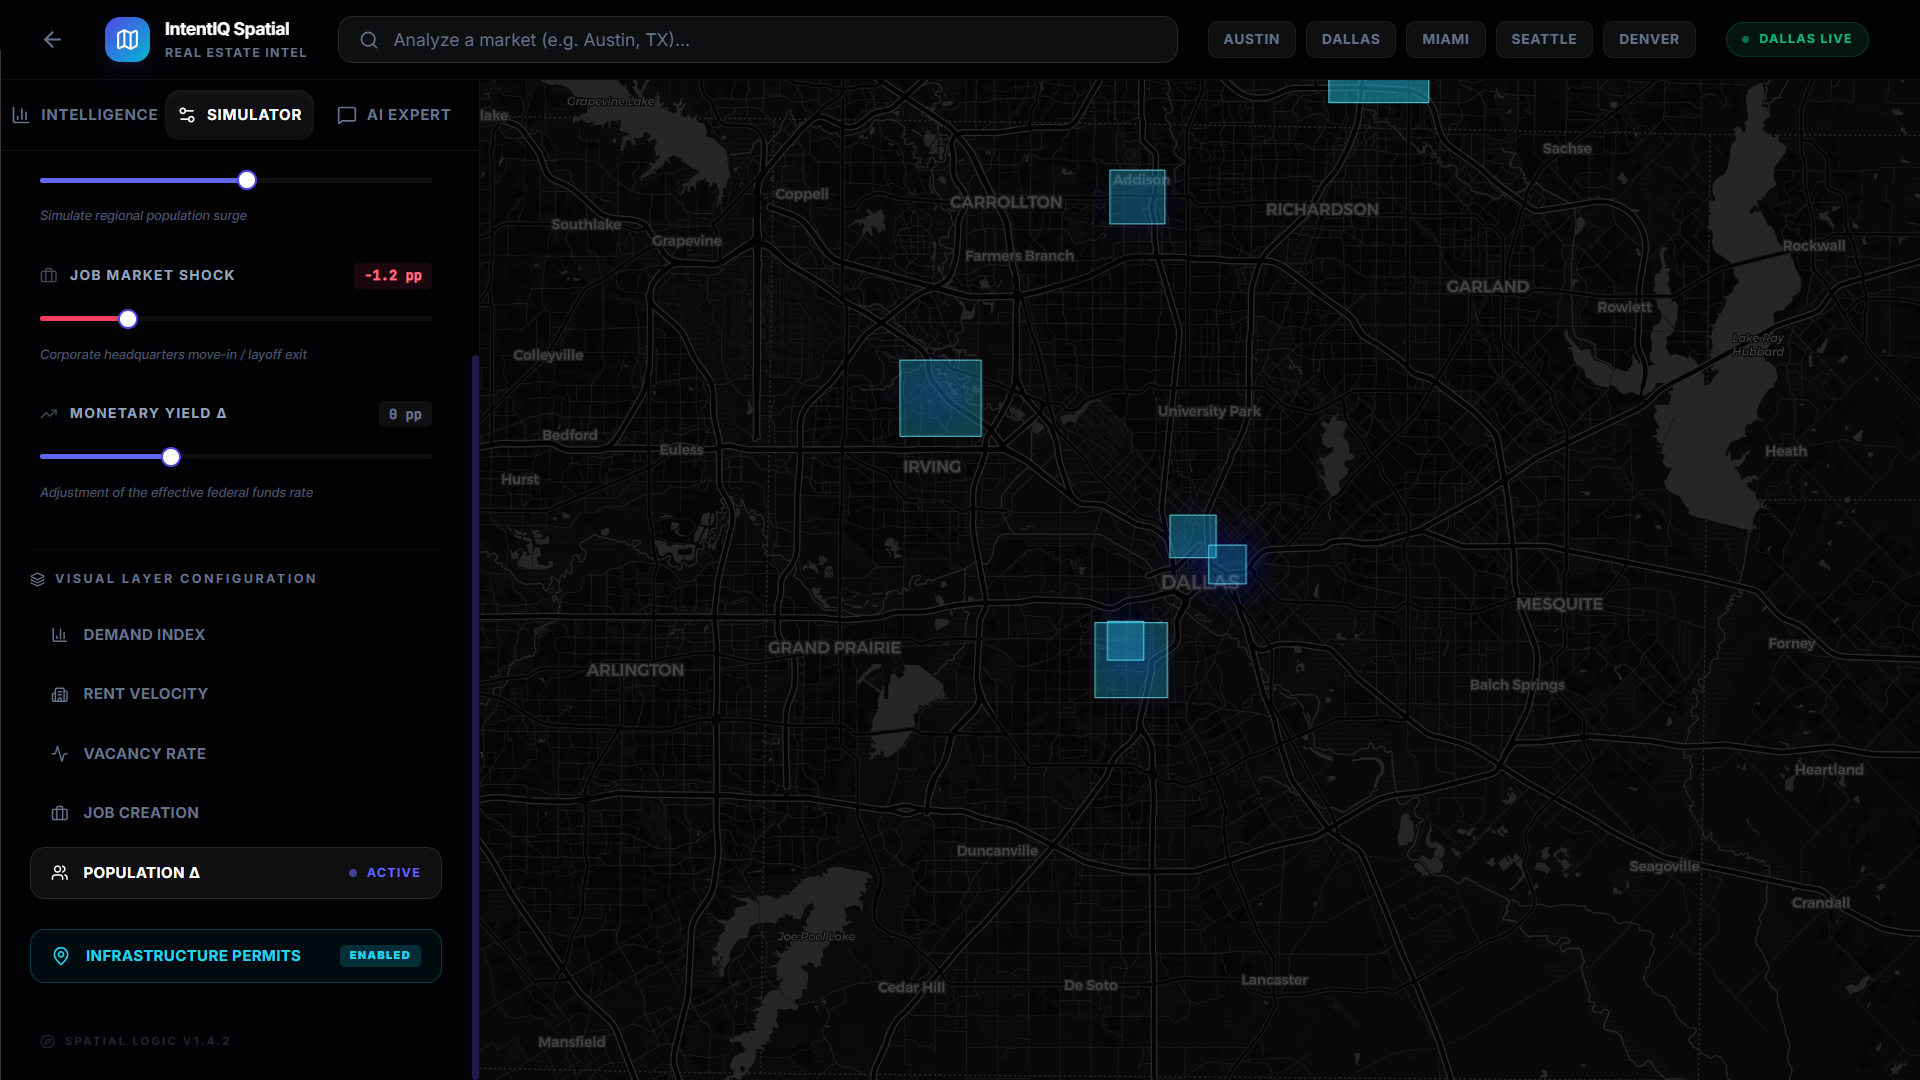
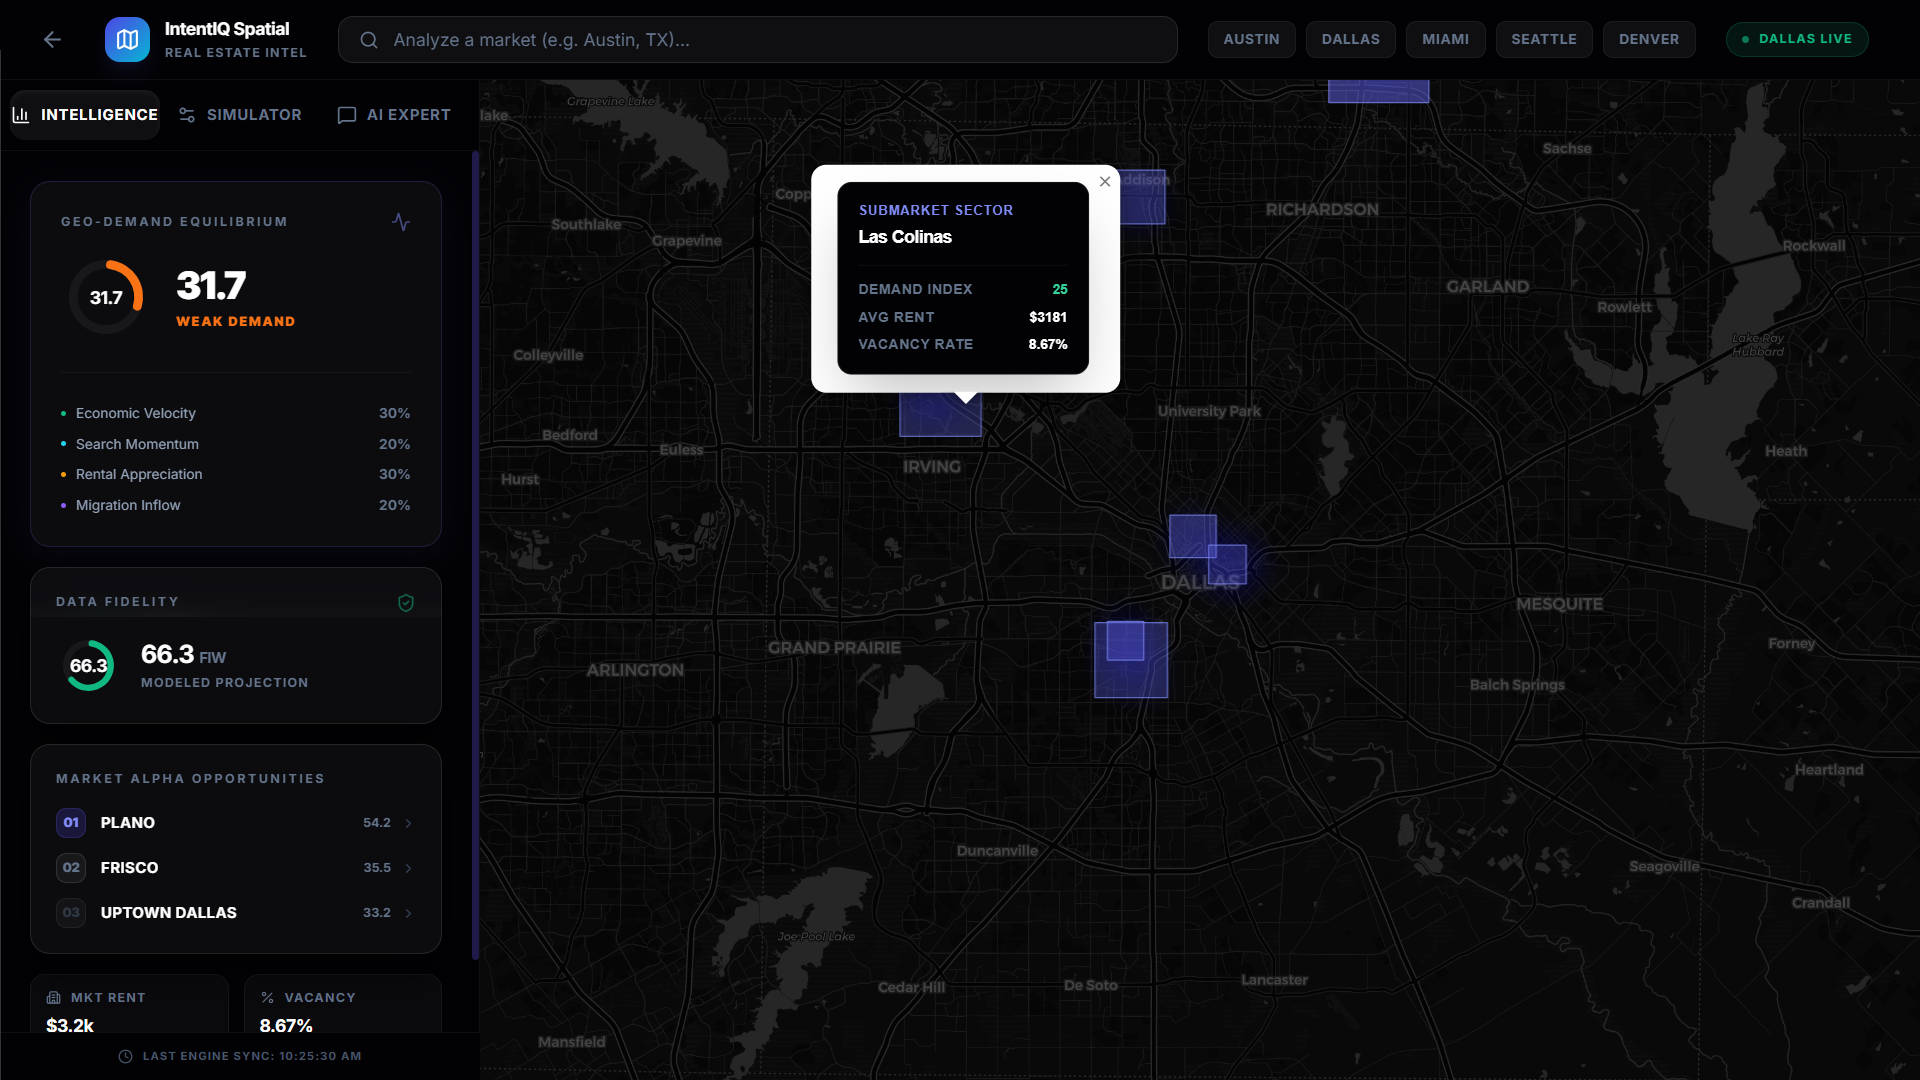
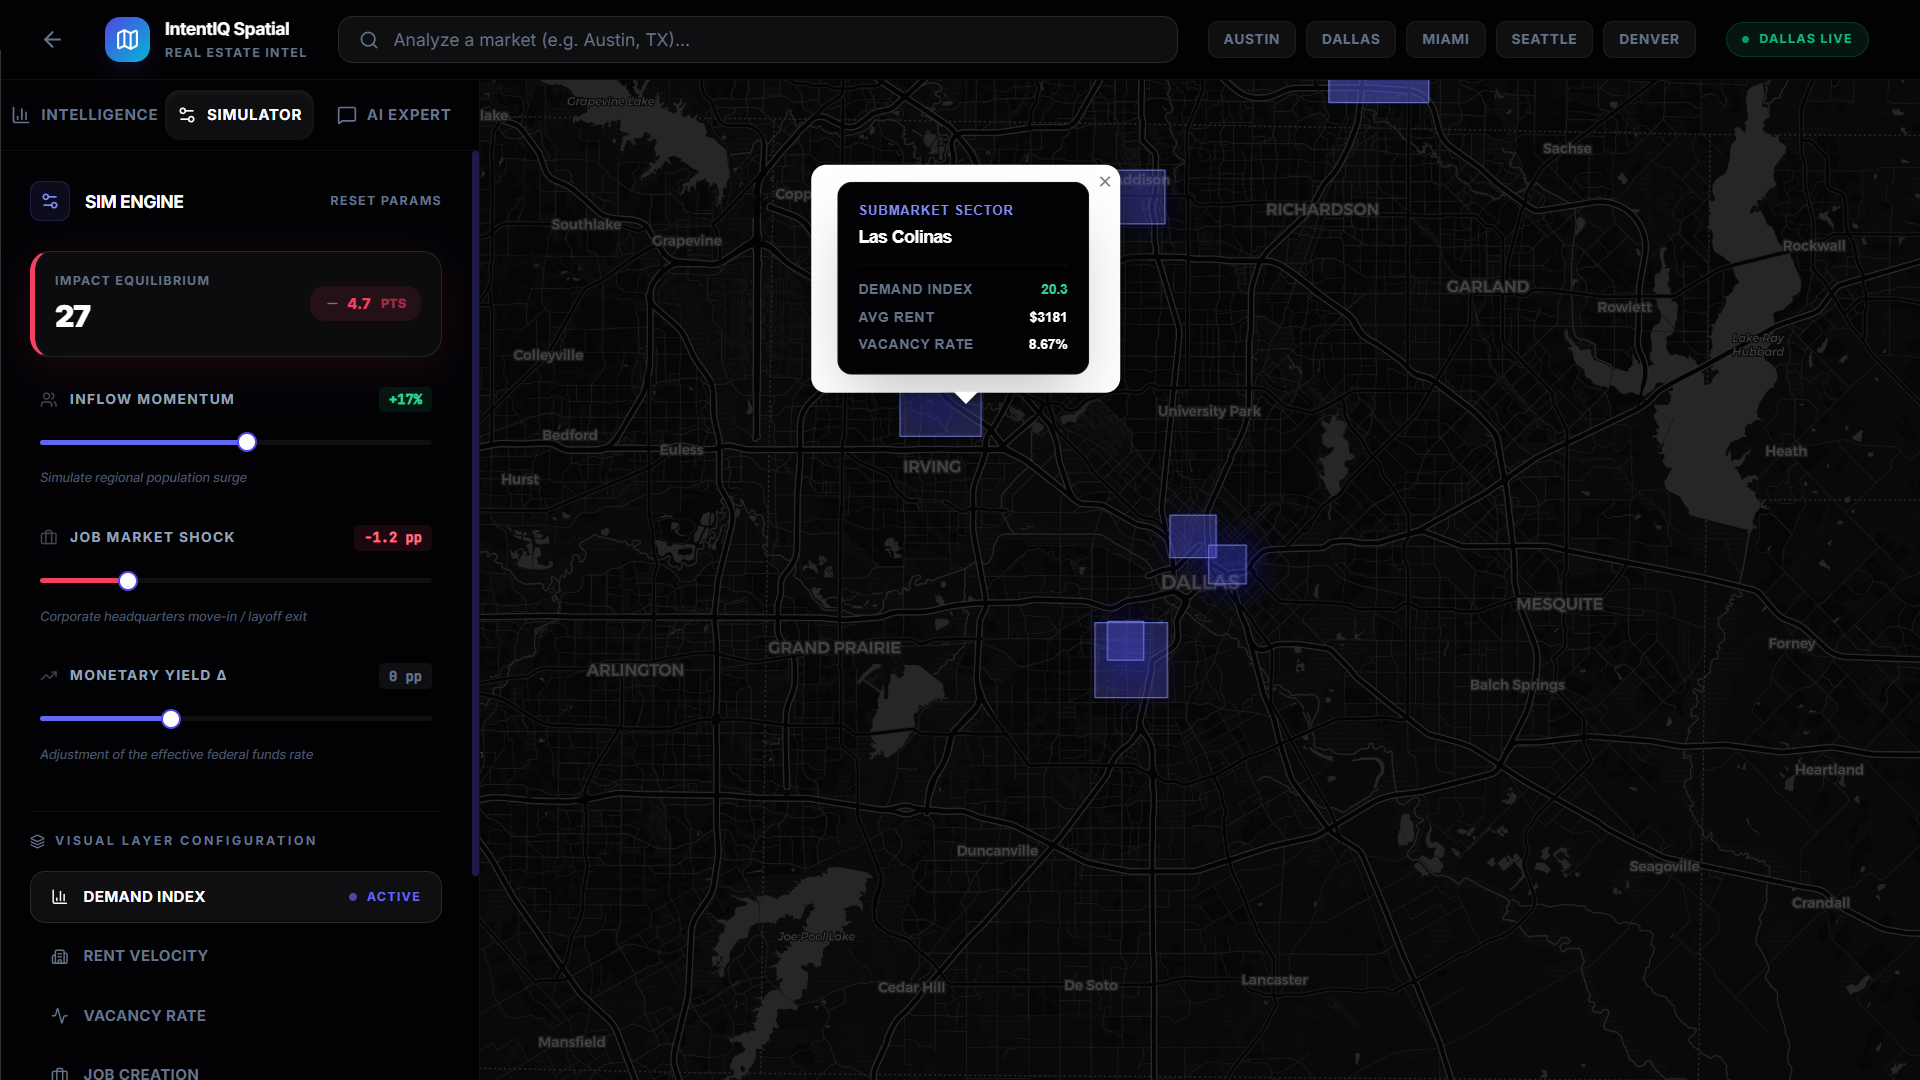
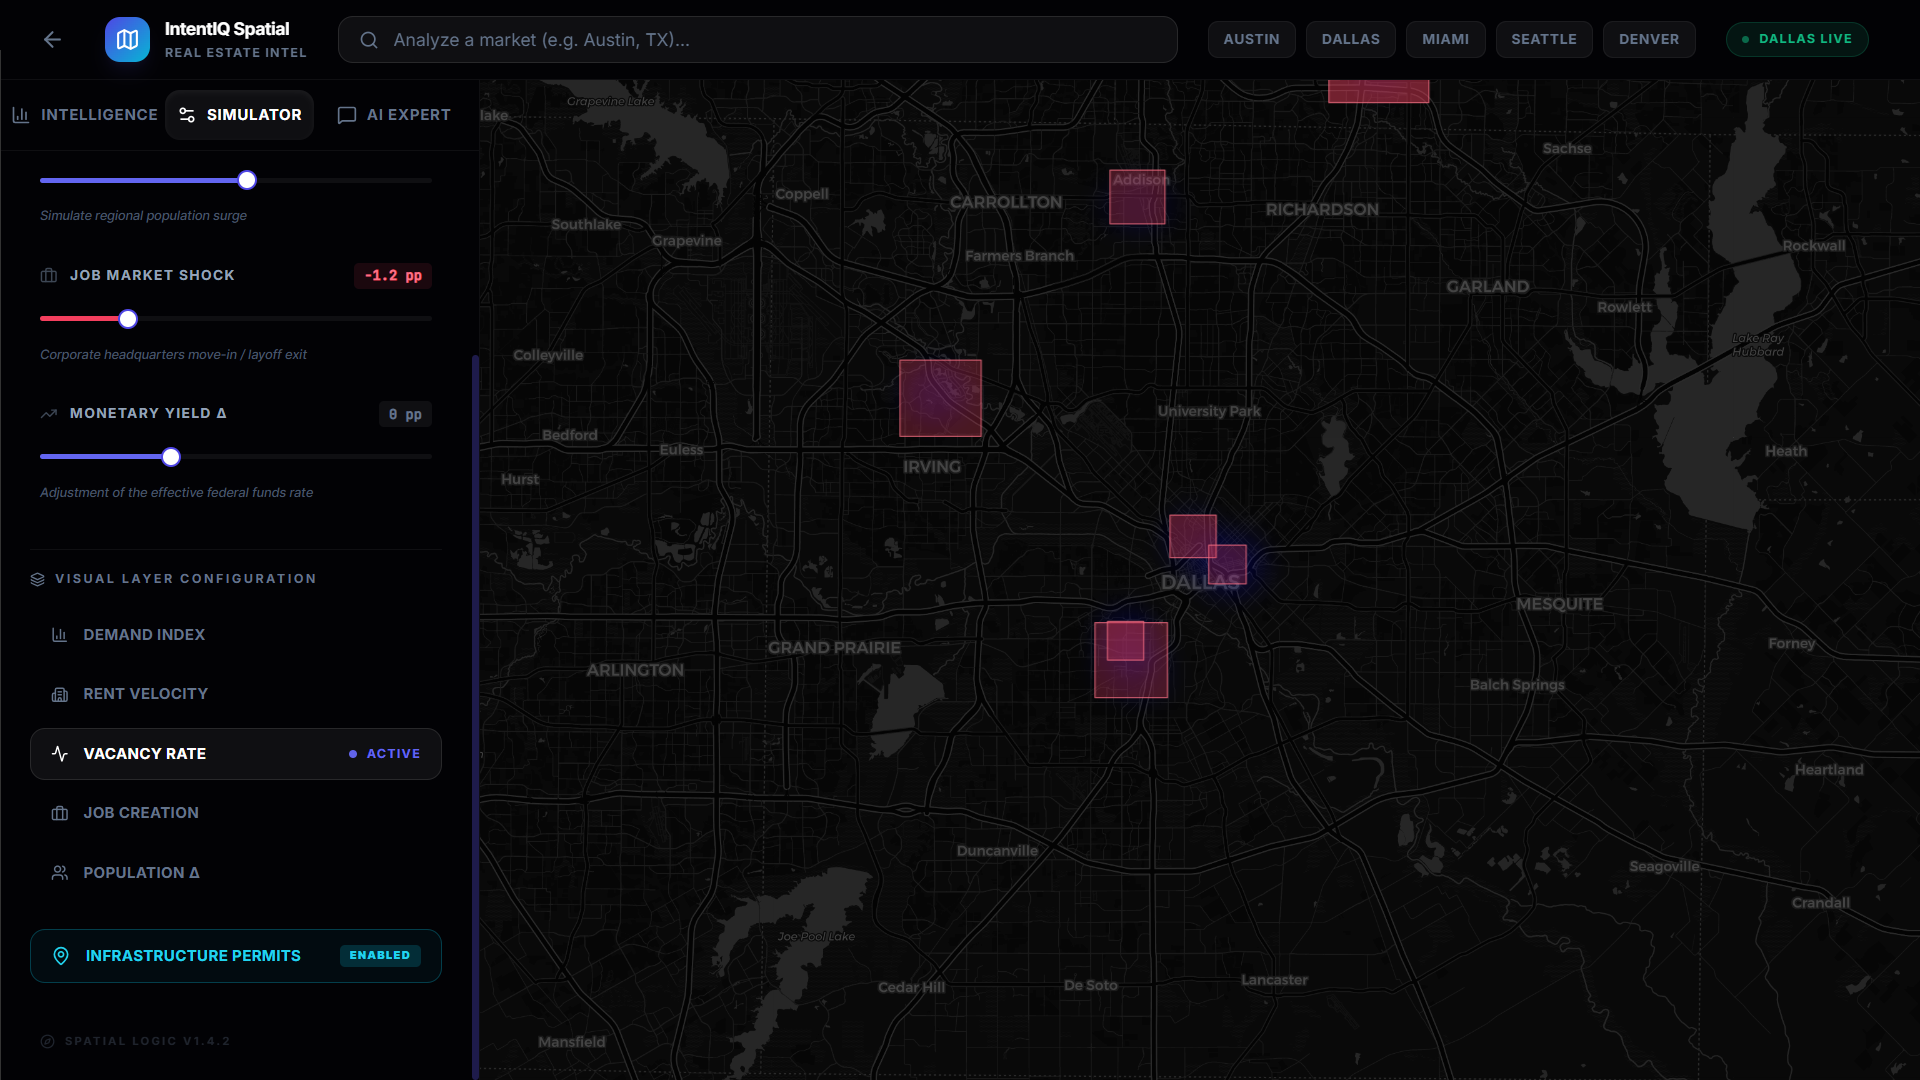
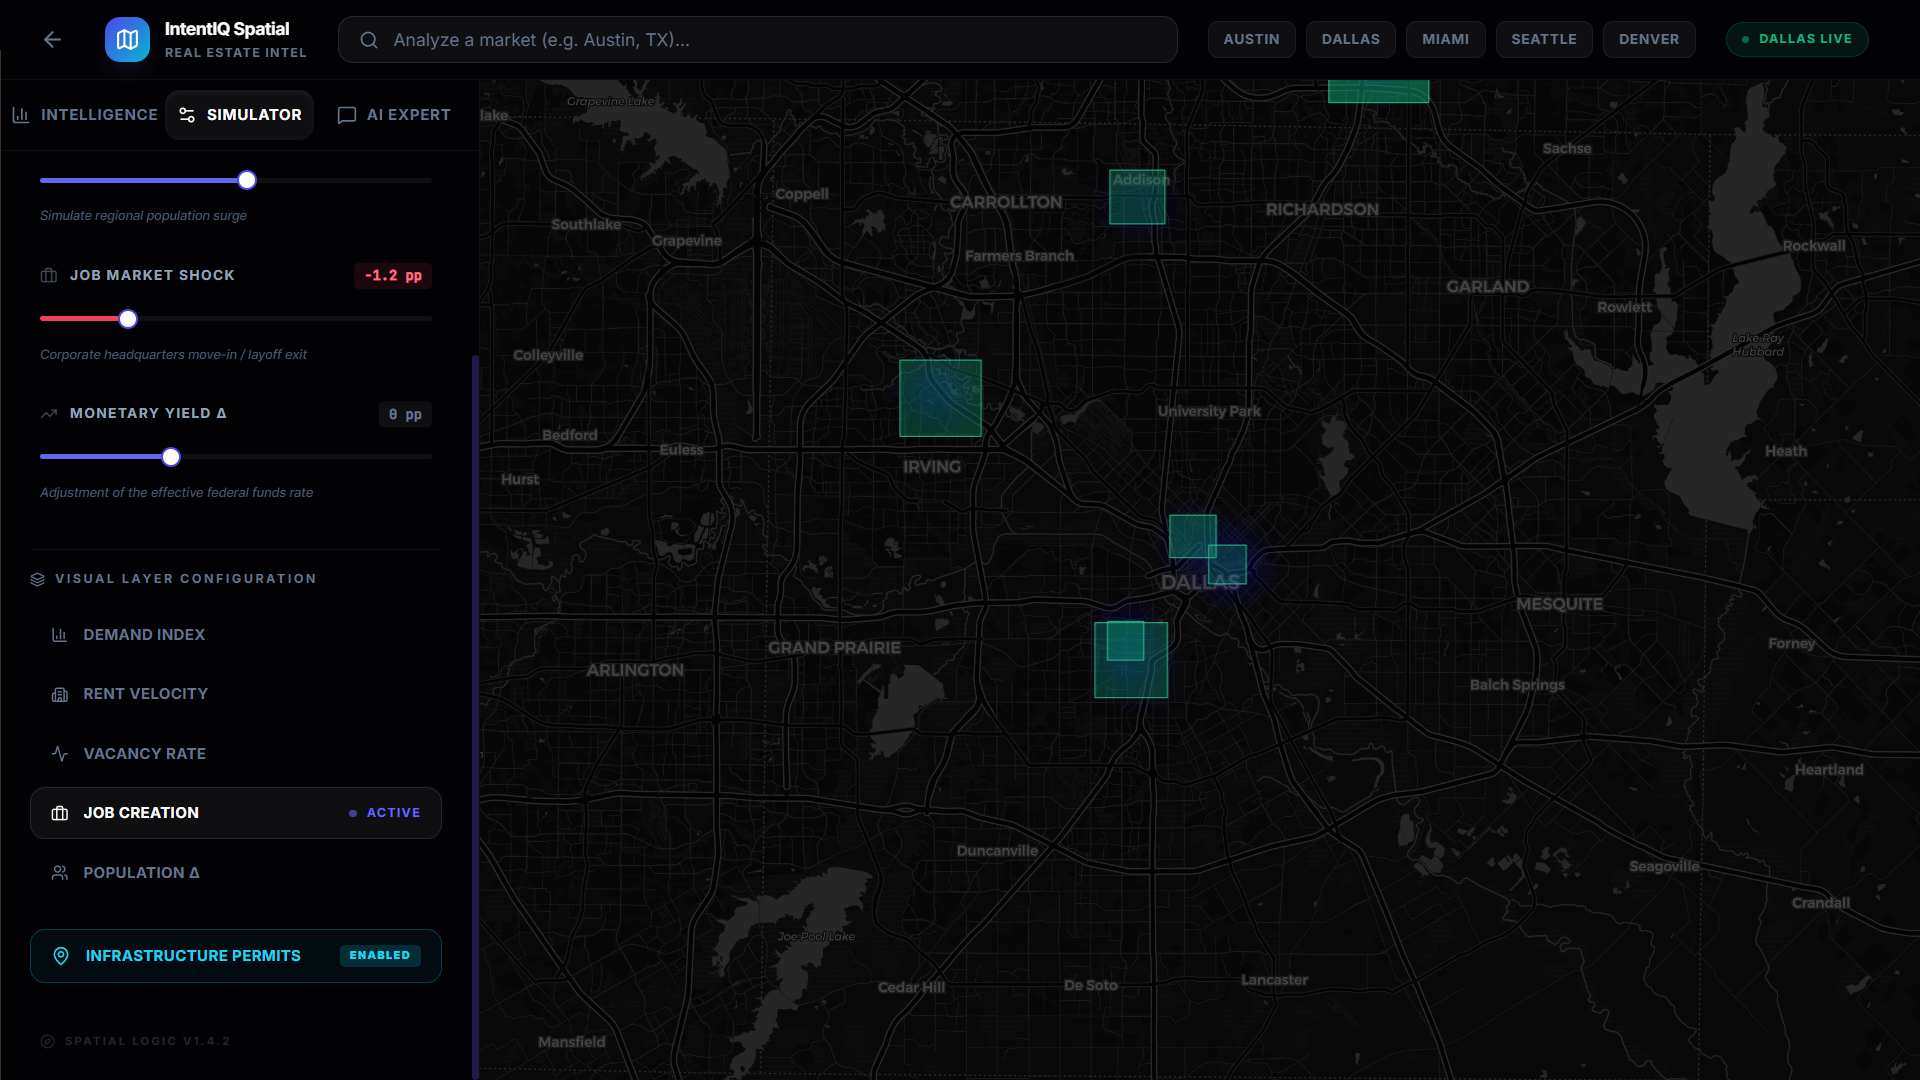
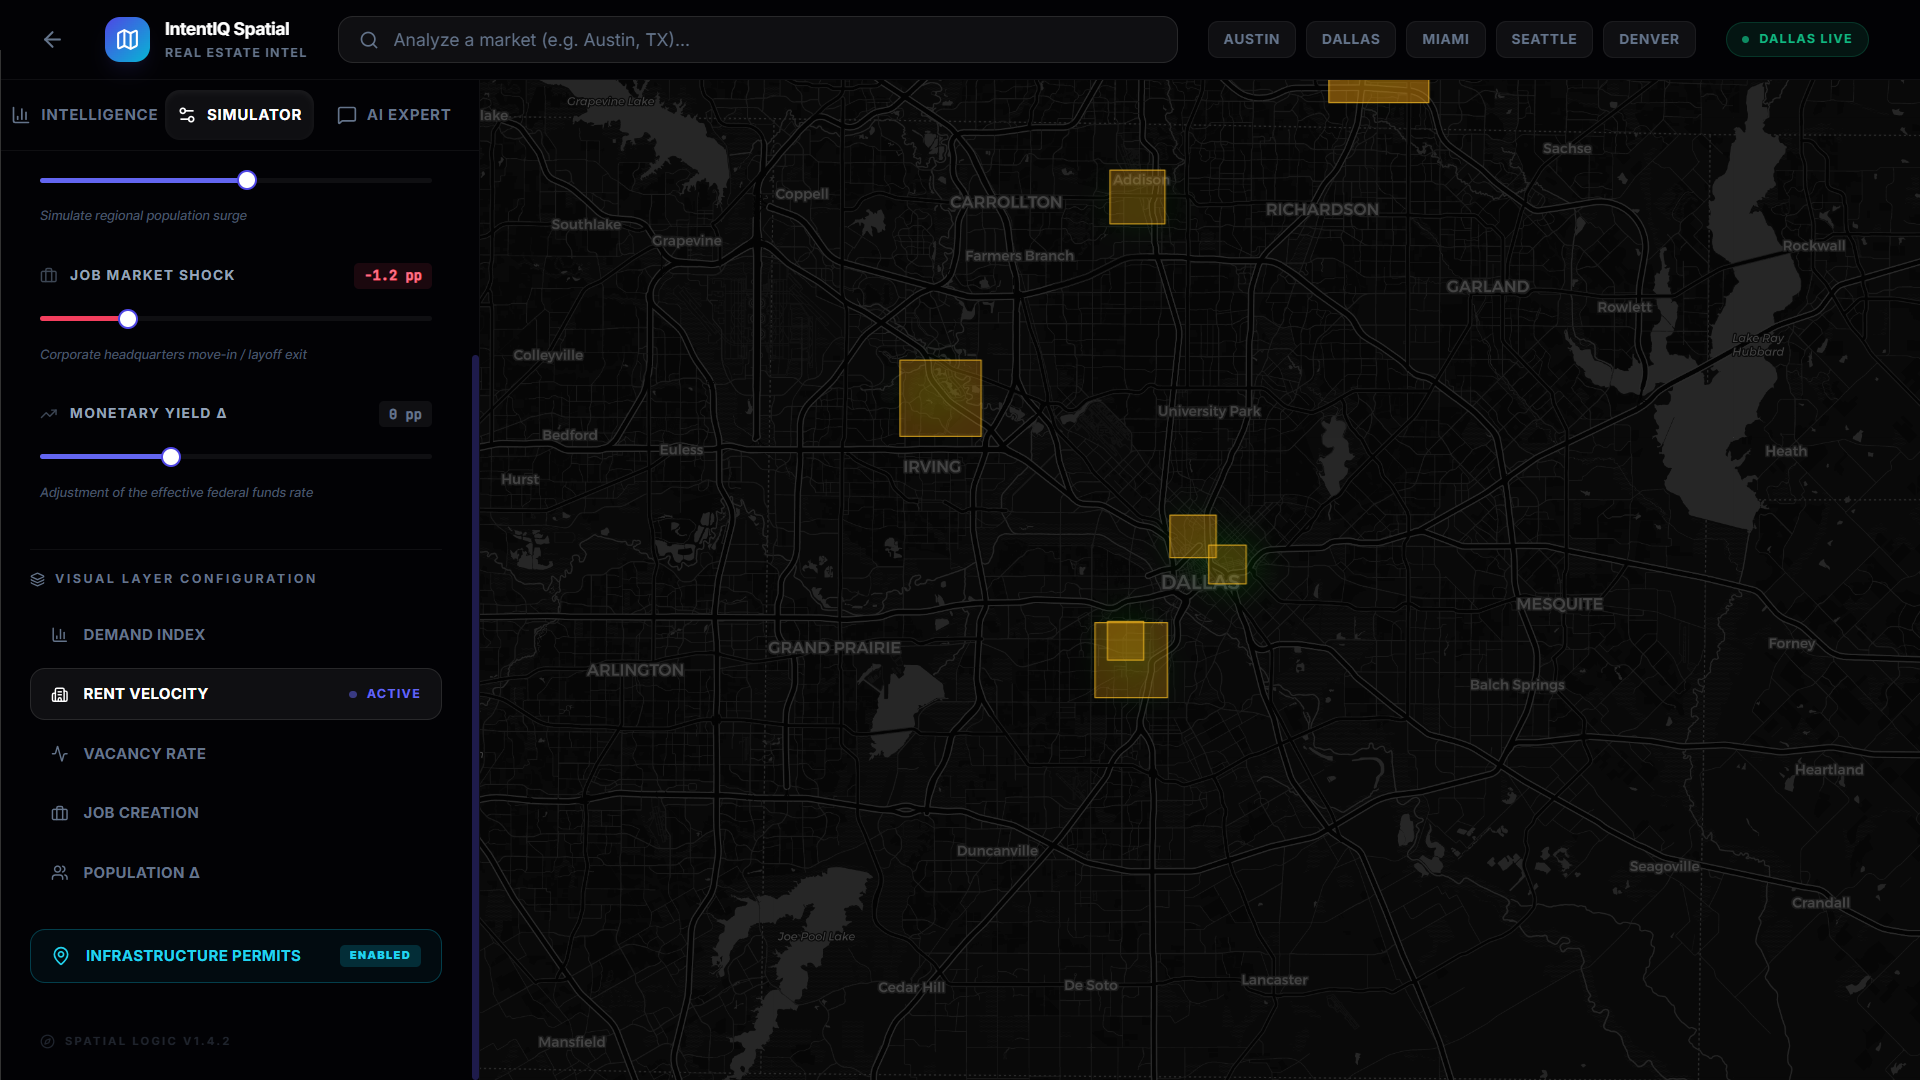
IntentIQ Spatial is a high-frequency predictive engine for real estate intelligence. Geospatial Equilibrium: It maps submarket-level "Demand Scores" by aggregating data points on rent velocity, vacancy rates, migration inflow, and job creation. Sim Engine: Users can interact with sliders to inject macro-shocks into a market (e.g., a +2% job shock or a +0.25pp Fed rate hike) and instantly see the map repaint with the newly simulated demand equilibrium. AI Expert: The native AI copilot acts as an embedded analyst, parsing natural language queries to instantly configure the visual layers of the dashboard to match the user's intent.
How we built it
We architected IntentIQ Spatial as a high-performance, full-stack platform: Frontend: React, Tailwind CSS (with a custom glassmorphism design system), and Recharts for premium data visualization. Spatial Layer: We pivoted entirely to an open-source mapping stack using React-Leaflet and CartoDB Dark Matter tiles. We built a custom WebGL heatmap layer to eliminate licensing costs while maintaining exceptional frame rates. Backend: Python FastAPI orchestrating an ETL (Extract, Transform, Load) pipeline using concurrency (asyncio) to fetch live data from the Federal Reserve Economic Data (FRED) API and Google Trends (pytrends). Scoring Engine: A custom Pandas-powered weighting algorithm that normalizes the unstructured data into institutional-grade "Market Alpha" indices.
Challenges we ran into
Integrating third-party proprietary map APIs initially introduced severe latency and complex billing/key management obstacles. We also faced the challenge of standardizing vastly different scales of data (e.g., raw Google search volume vs. granular vacancy percentages) without skewing the composite Demand Score. Lastly, synchronizing the debounced state of the Scenario Simulator with the heavy WebGL repaints required careful React lifecycle management.
Accomplishments that we're proud of
Zero-Dependency Mapping: Successfully migrating from Google Maps to a completely open-source Leaflet stack without sacrificing the premium aesthetic or any functionality (heatmaps, polygons, markers). The Sim Engine:The debounced architecture allows users to smoothly drag sliders for 'migration' or 'monetary yield', providing an immediate, tactical visualization of a theoretical market shock. Design Polish: Evolving the UI from a generic prototype into a truly professional, "institutional-grade" dashboard with bespoke gradients and micro-interactions.
What we learned
We learned that the visualization of geospatial data is just as critical as the underlying data science. Normalizing data is only half the battle; presenting it in a way that feels instantaneous and interactive completely changes how a user understands the market. We also mastered the integration of React-Leaflet with custom data layers, proving that enterprise-grade GIS doesn't always require expensive enterprise licenses.
What's next for IntentIQ Spatial
Our next phase includes replacing the simulated fallback housing data with live commercial API endpoints (like Zillow or Census APIs) as soon as rate limits allow. We plan to integrate Firebase Firestore to enable users to persist, share, and track their custom simulated scenarios over time. Finally, we want to expand the AI Copilot to handle generative market summaries based on the current map bounding box.
Built With
- fastapi
- framer-motion
- fred-api
- google-trends-api
- javascript
- leaflet.js
- lucide-icons
- pandas
- python
- pytrends
- react-leaflet
- react.js
- recharts
- tailwind-css

Log in or sign up for Devpost to join the conversation.