-
Grafana Dashboard

Inspiration
Our inspiration stemmed from the desire to visualize and analyze data collected from IoT devices in a user-friendly and customizable dashboard. We were motivated by the potential of Grafana to provide powerful data visualization tools and insights that could enhance our understanding of the information gathered by our IoT projects.
What it does
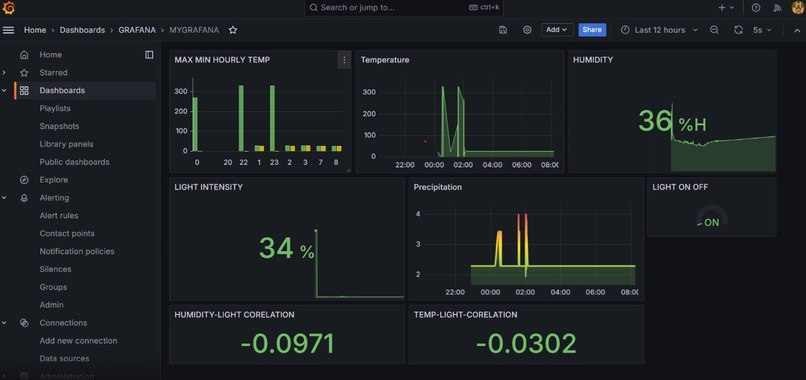
Our project focuses on integrating Grafana into localhost to create a centralized platform for monitoring and analyzing IoT data. By connecting Grafana to our local IoT environment, we can visualize real-time sensor data, track trends, and identify patterns with ease.
How we built it
We began by setting up a local environment for IoT data collection using MicroPython. We configured sensors, such as the DS18B20 temperature sensor, to collect relevant environmental data. Next, we installed and configured Grafana on our local machine, leveraging its powerful features to design custom dashboards tailored to our specific needs. We established communication between Grafana and our IoT devices using appropriate protocols and APIs, ensuring seamless data integration.
Challenges we ran into
Throughout the project, we encountered various challenges that tested our skills and problem-solving abilities. One of the main challenges was configuring Grafana to communicate with our local IoT environment effectively. We had to overcome compatibility issues, debug connectivity errors, and fine-tune data visualization settings to achieve optimal results. Additionally, integrating different data sources and formats presented its own set of challenges, requiring careful planning and implementation.
Accomplishments that we're proud of
Despite the challenges, we're proud to have successfully integrated Grafana into our localhost environment and created dynamic dashboards that provide valuable insights into our IoT data. We're particularly proud of our ability to design visually appealing and informative dashboards that enhance data visualization and facilitate decision-making.
What we learned
Through this project, we gained valuable experience in setting up and configuring Grafana for IoT applications. We learned about the importance of data visualization in extracting meaningful insights from raw data and the potential of Grafana to streamline the process. Additionally, we expanded our knowledge of IoT protocols, APIs, and data integration techniques, deepening our understanding of the intersection between technology and data analytics.
What's next for Integrate Grafana in localhost
We have integrated Grafana in localhost using http get , post. now We would like to publish our dashboard online.
Built With
- esp32
- fastapi
- grafana
- micropython
- mysql
- sensors


Log in or sign up for Devpost to join the conversation.