Inspiration
Insituto de Estadistica's challenge.
What it does
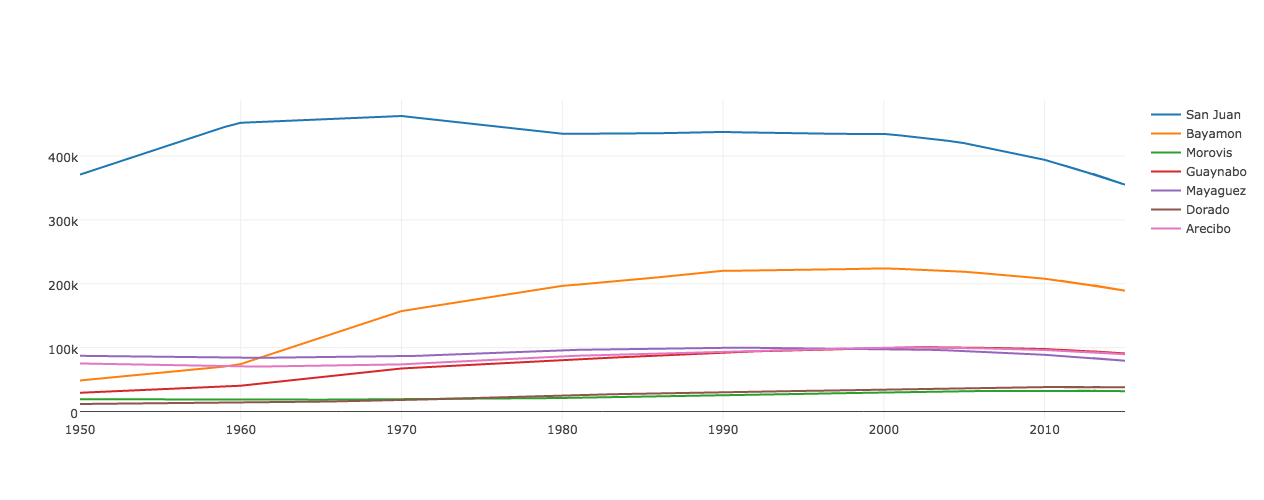
Graphs the population data for a specific town per year.
How we built it
Dedication.
Challenges we ran into
Some graphing libraries didn't accept datasets as large as the one used in this project.
Accomplishments that we're proud of
We were able to graph the population data.
What we learned
Graphing large datasets is no easy task.
What's next for InstiGraph
Adapt it to the rest of the data available on Indicadores PR

Log in or sign up for Devpost to join the conversation.