-
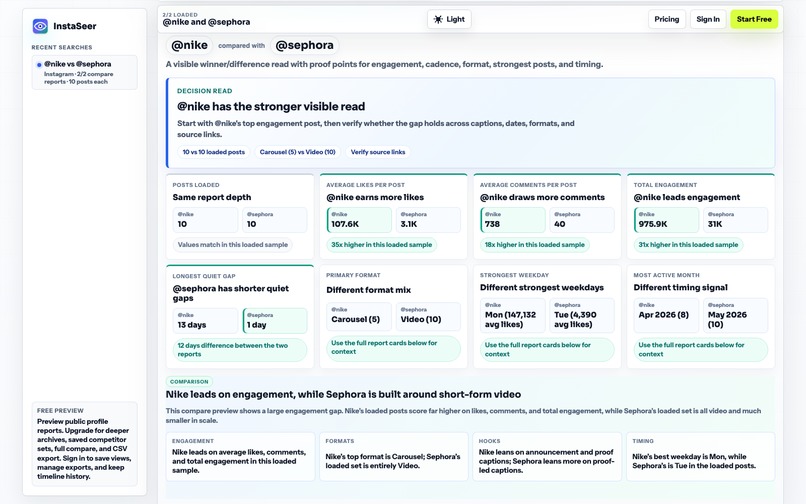
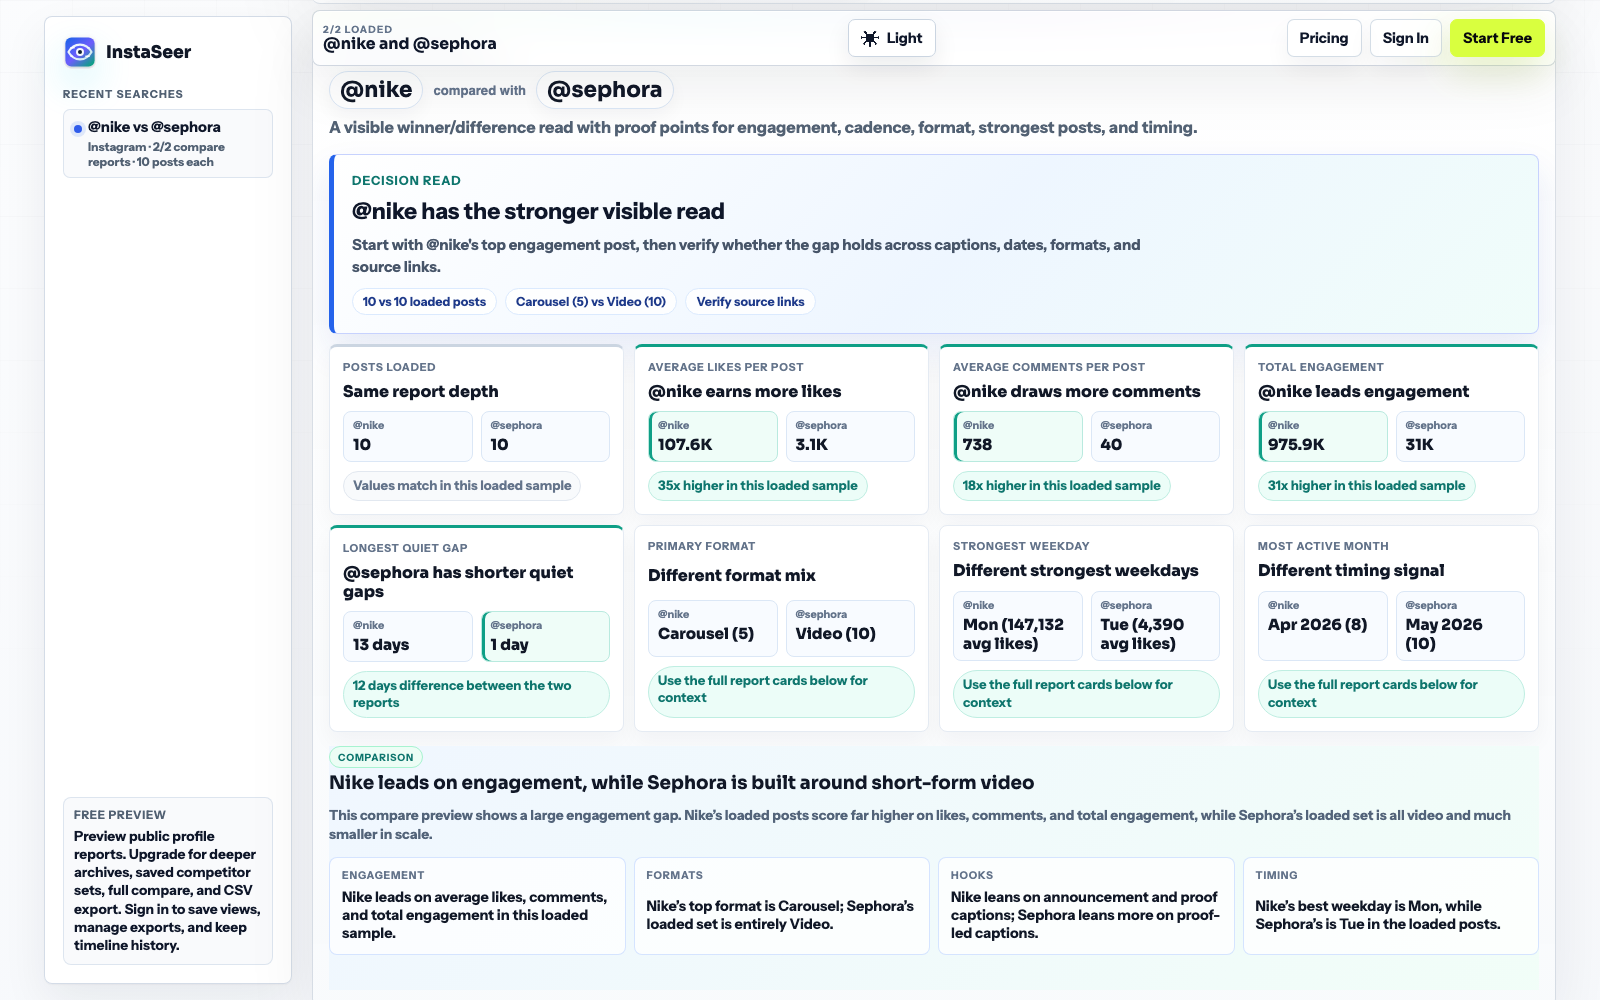
Instaseer compare report
-
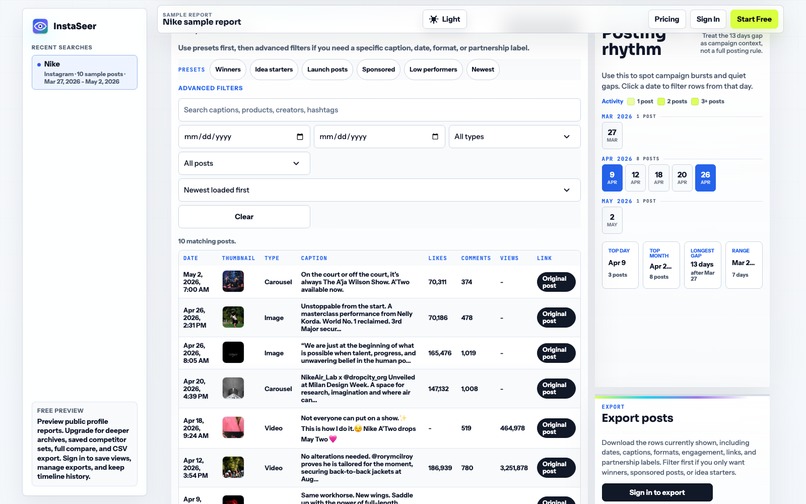
Instaseer detailed post list (Instagram)
-
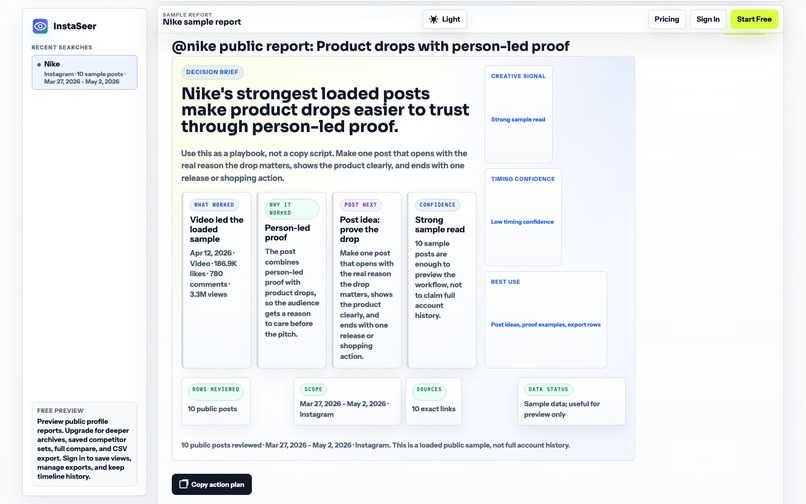
Instaseer sample report
About InstaSeer
InstaSeer was inspired by the slow, messy way social media research usually happens: opening a public Instagram profile, scrolling endlessly, copying dates and captions by hand, and trying to turn that into something useful for a content strategy or client audit. I wanted to build a tool that turns that manual research loop into a clear, repeatable workflow.
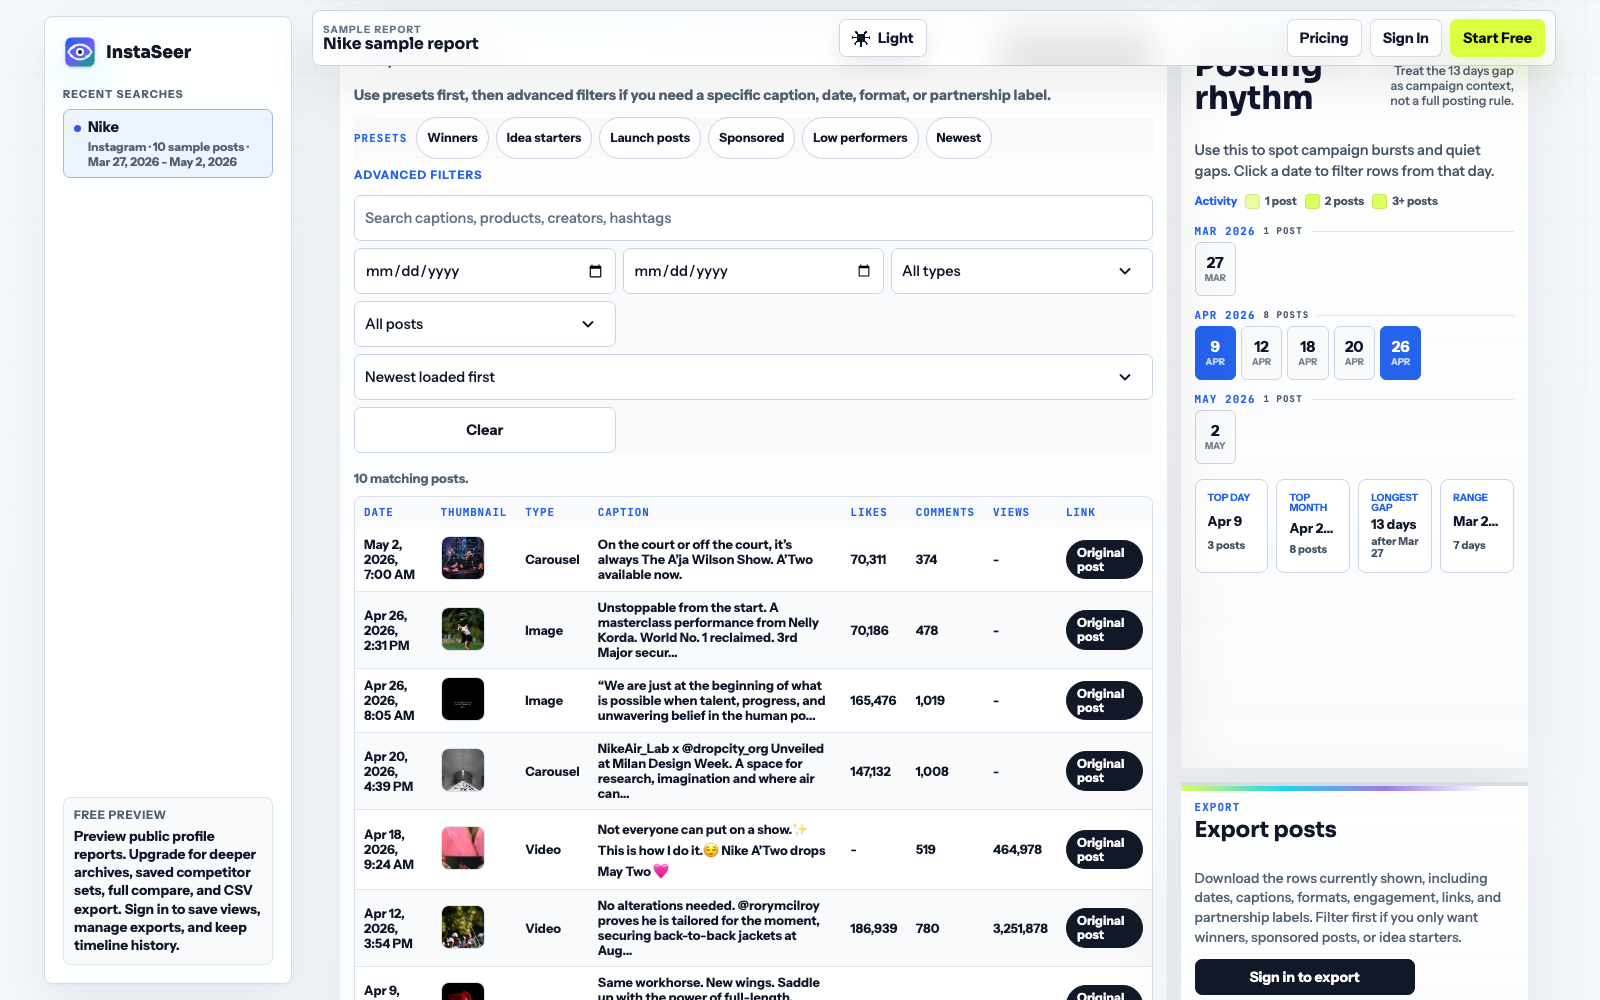
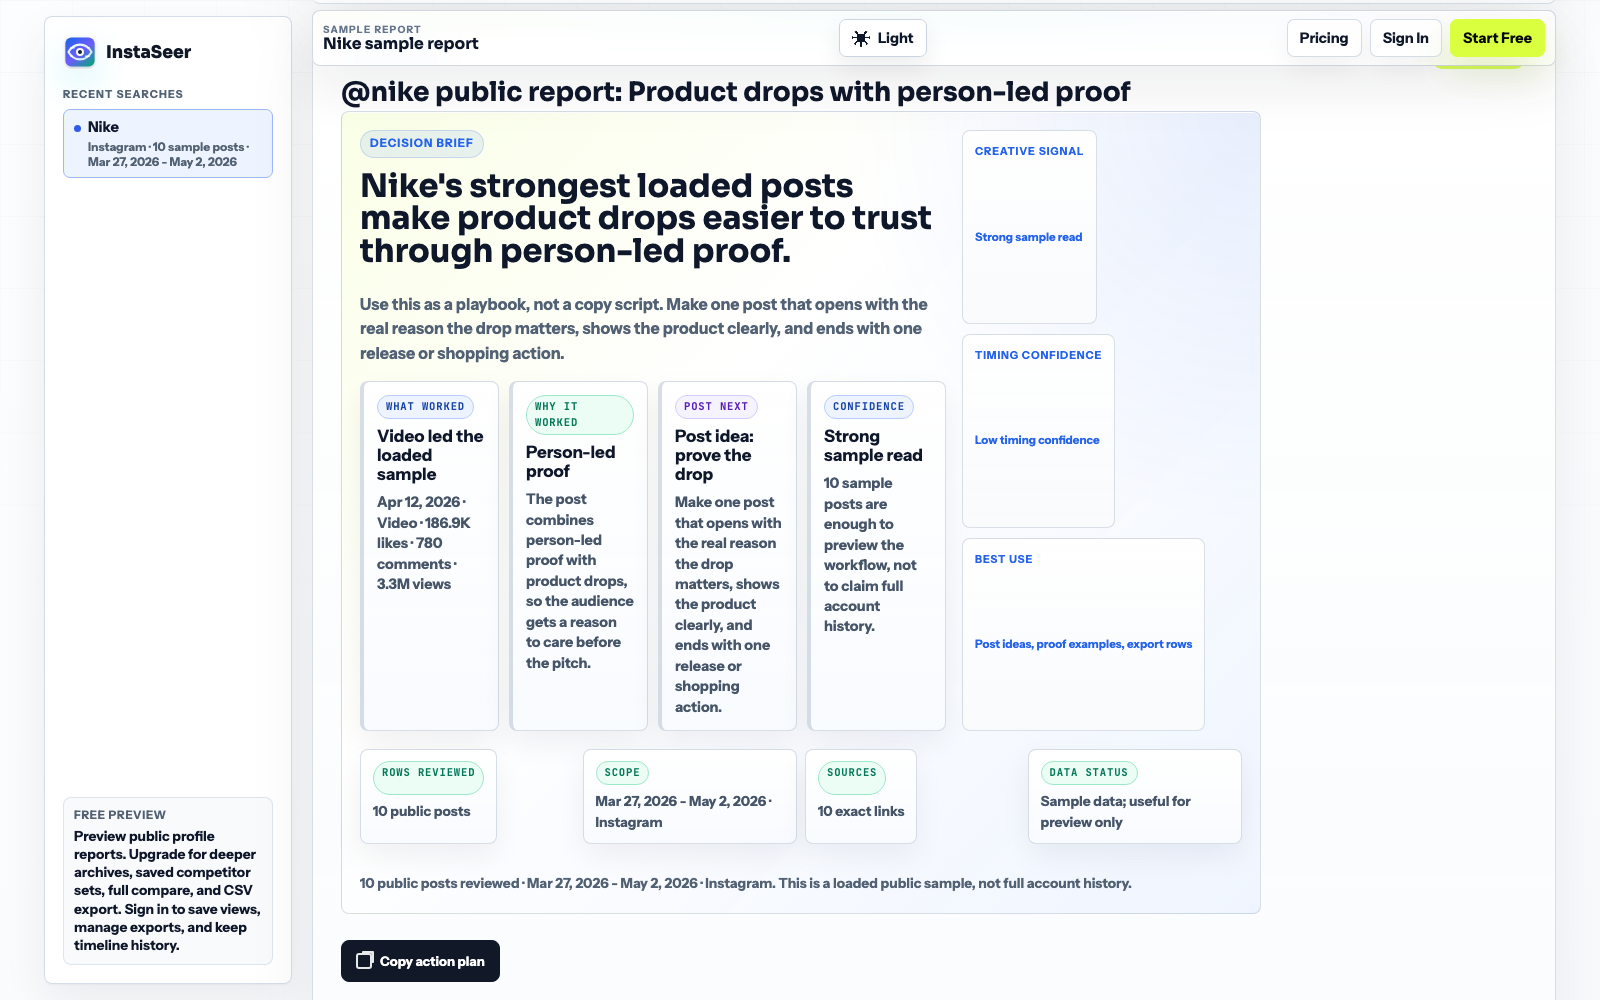
InstaSeer lets users search public Instagram profiles, view loaded posts and reels as dated rows, inspect posting calendars, compare competitors, tag creative patterns, and export research-ready CSVs. The goal is not to replace creative judgment, but to make the evidence easier to see.
How I Built It
I built the project as a Node.js and Express app with a responsive frontend, local SQLite for development, and production-ready support for Postgres/Neon on Vercel. Public social data is normalized through server-side services, then transformed into reports with captions, dates, media previews, source links, posting cadence, format mix, and engagement signals.
One important feature is baseline scoring, which compares a post against its own account’s normal performance instead of only ranking by raw likes:
$$ E = likes + 4 \cdot comments + 0.02 \cdot views $$
$$ baselineScore = \frac{E_{post}}{median(E_{handle})} $$
That way, a smaller brand with one unusually strong post can still stand out next to a much larger competitor.
I also added saved competitor projects, manual and heuristic tags for hooks/CTAs/themes, shared report snapshots, CSV export, authentication, Stripe billing, admin diagnostics, and Playwright smoke tests.
What I Learned
I learned how much product value comes from careful data shaping. The raw post list is useful, but the real insight appears when the app groups posts by time, compares each account to its own baseline, and gives users a place to tag patterns like hook, CTA, content pillar, offer angle, and emotional angle.
I also learned the importance of designing around limits: provider cost, missing fields, public-data coverage, rate limits, paywalls, and privacy expectations. A research tool has to be useful while staying honest about what it can and cannot guarantee.
Challenges I Faced
The biggest challenge was turning inconsistent public social data into a stable user experience. Some posts have missing metrics, dates can arrive in different shapes, media links vary, and provider errors need to be handled without breaking the report.
Another challenge was balancing depth with speed. Marketers want rich analysis, but they also need the workflow to feel fast. I handled this with caching, sample reports, capped searches, progressive UI states, and server-side guardrails.
The final challenge was making the project feel like a real SaaS product rather than a demo. That meant adding secure auth, billing, legal pages, admin tooling, responsive layouts, export gating, and automated tests.
What’s Next
Next, I would expand the insight layer: stronger AI-assisted tagging, monthly summaries, richer competitor benchmarks, scheduled refreshes, and support for more public platforms. The long-term vision is a research workspace where marketers can move from “what are competitors posting?” to “what should we test next?” in minutes instead of hours.
