Inspiration
The inspiration behind Insightpulse came from a growing need to analyze and interact with real-time sensor data in a way that's both accessible and actionable. I wanted to create a tool that would allow users to query sensor data intuitively, without needing advanced technical skills. As environmental data becomes increasingly important in monitoring climate change and improving decision-making, I aimed to provide a user-friendly interface that makes this data more accessible. The integration of advanced natural language processing (NLP) using AWS Bedrock and LangChain was motivated by the desire to build an intelligent assistant capable of generating meaningful insights from raw sensor data.
What it does
Insightpulse is an interactive application that provides two primary features:
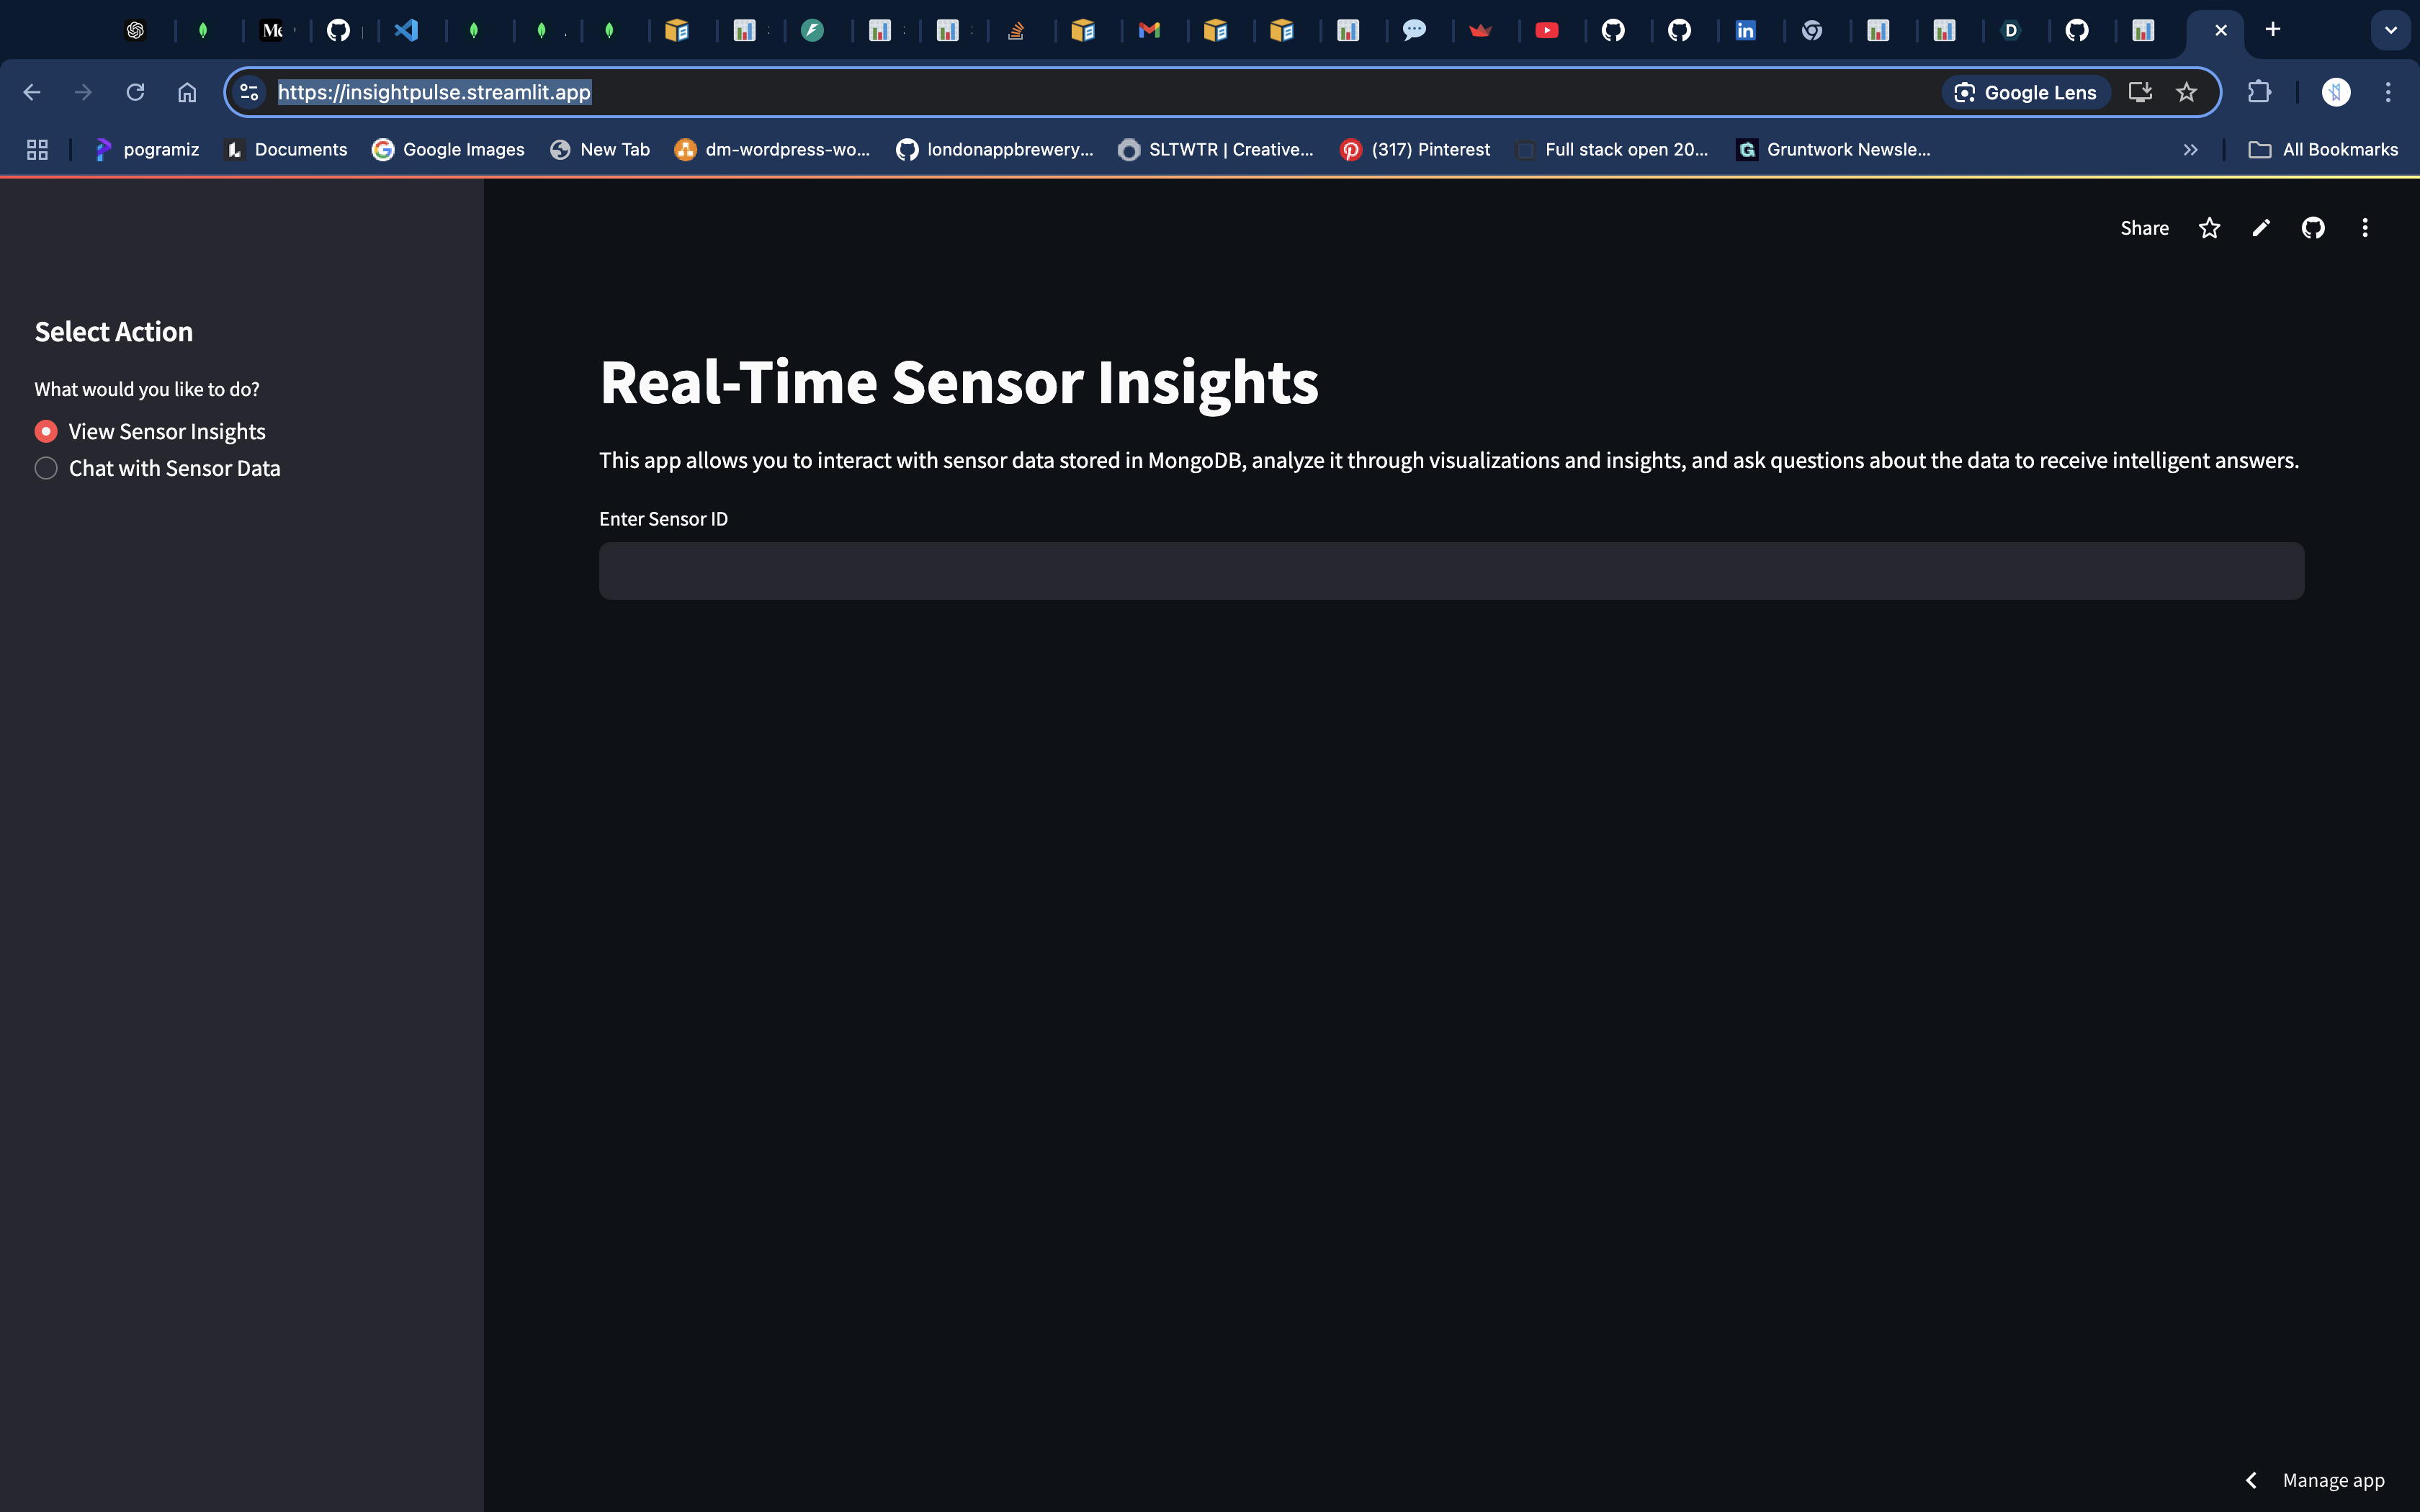
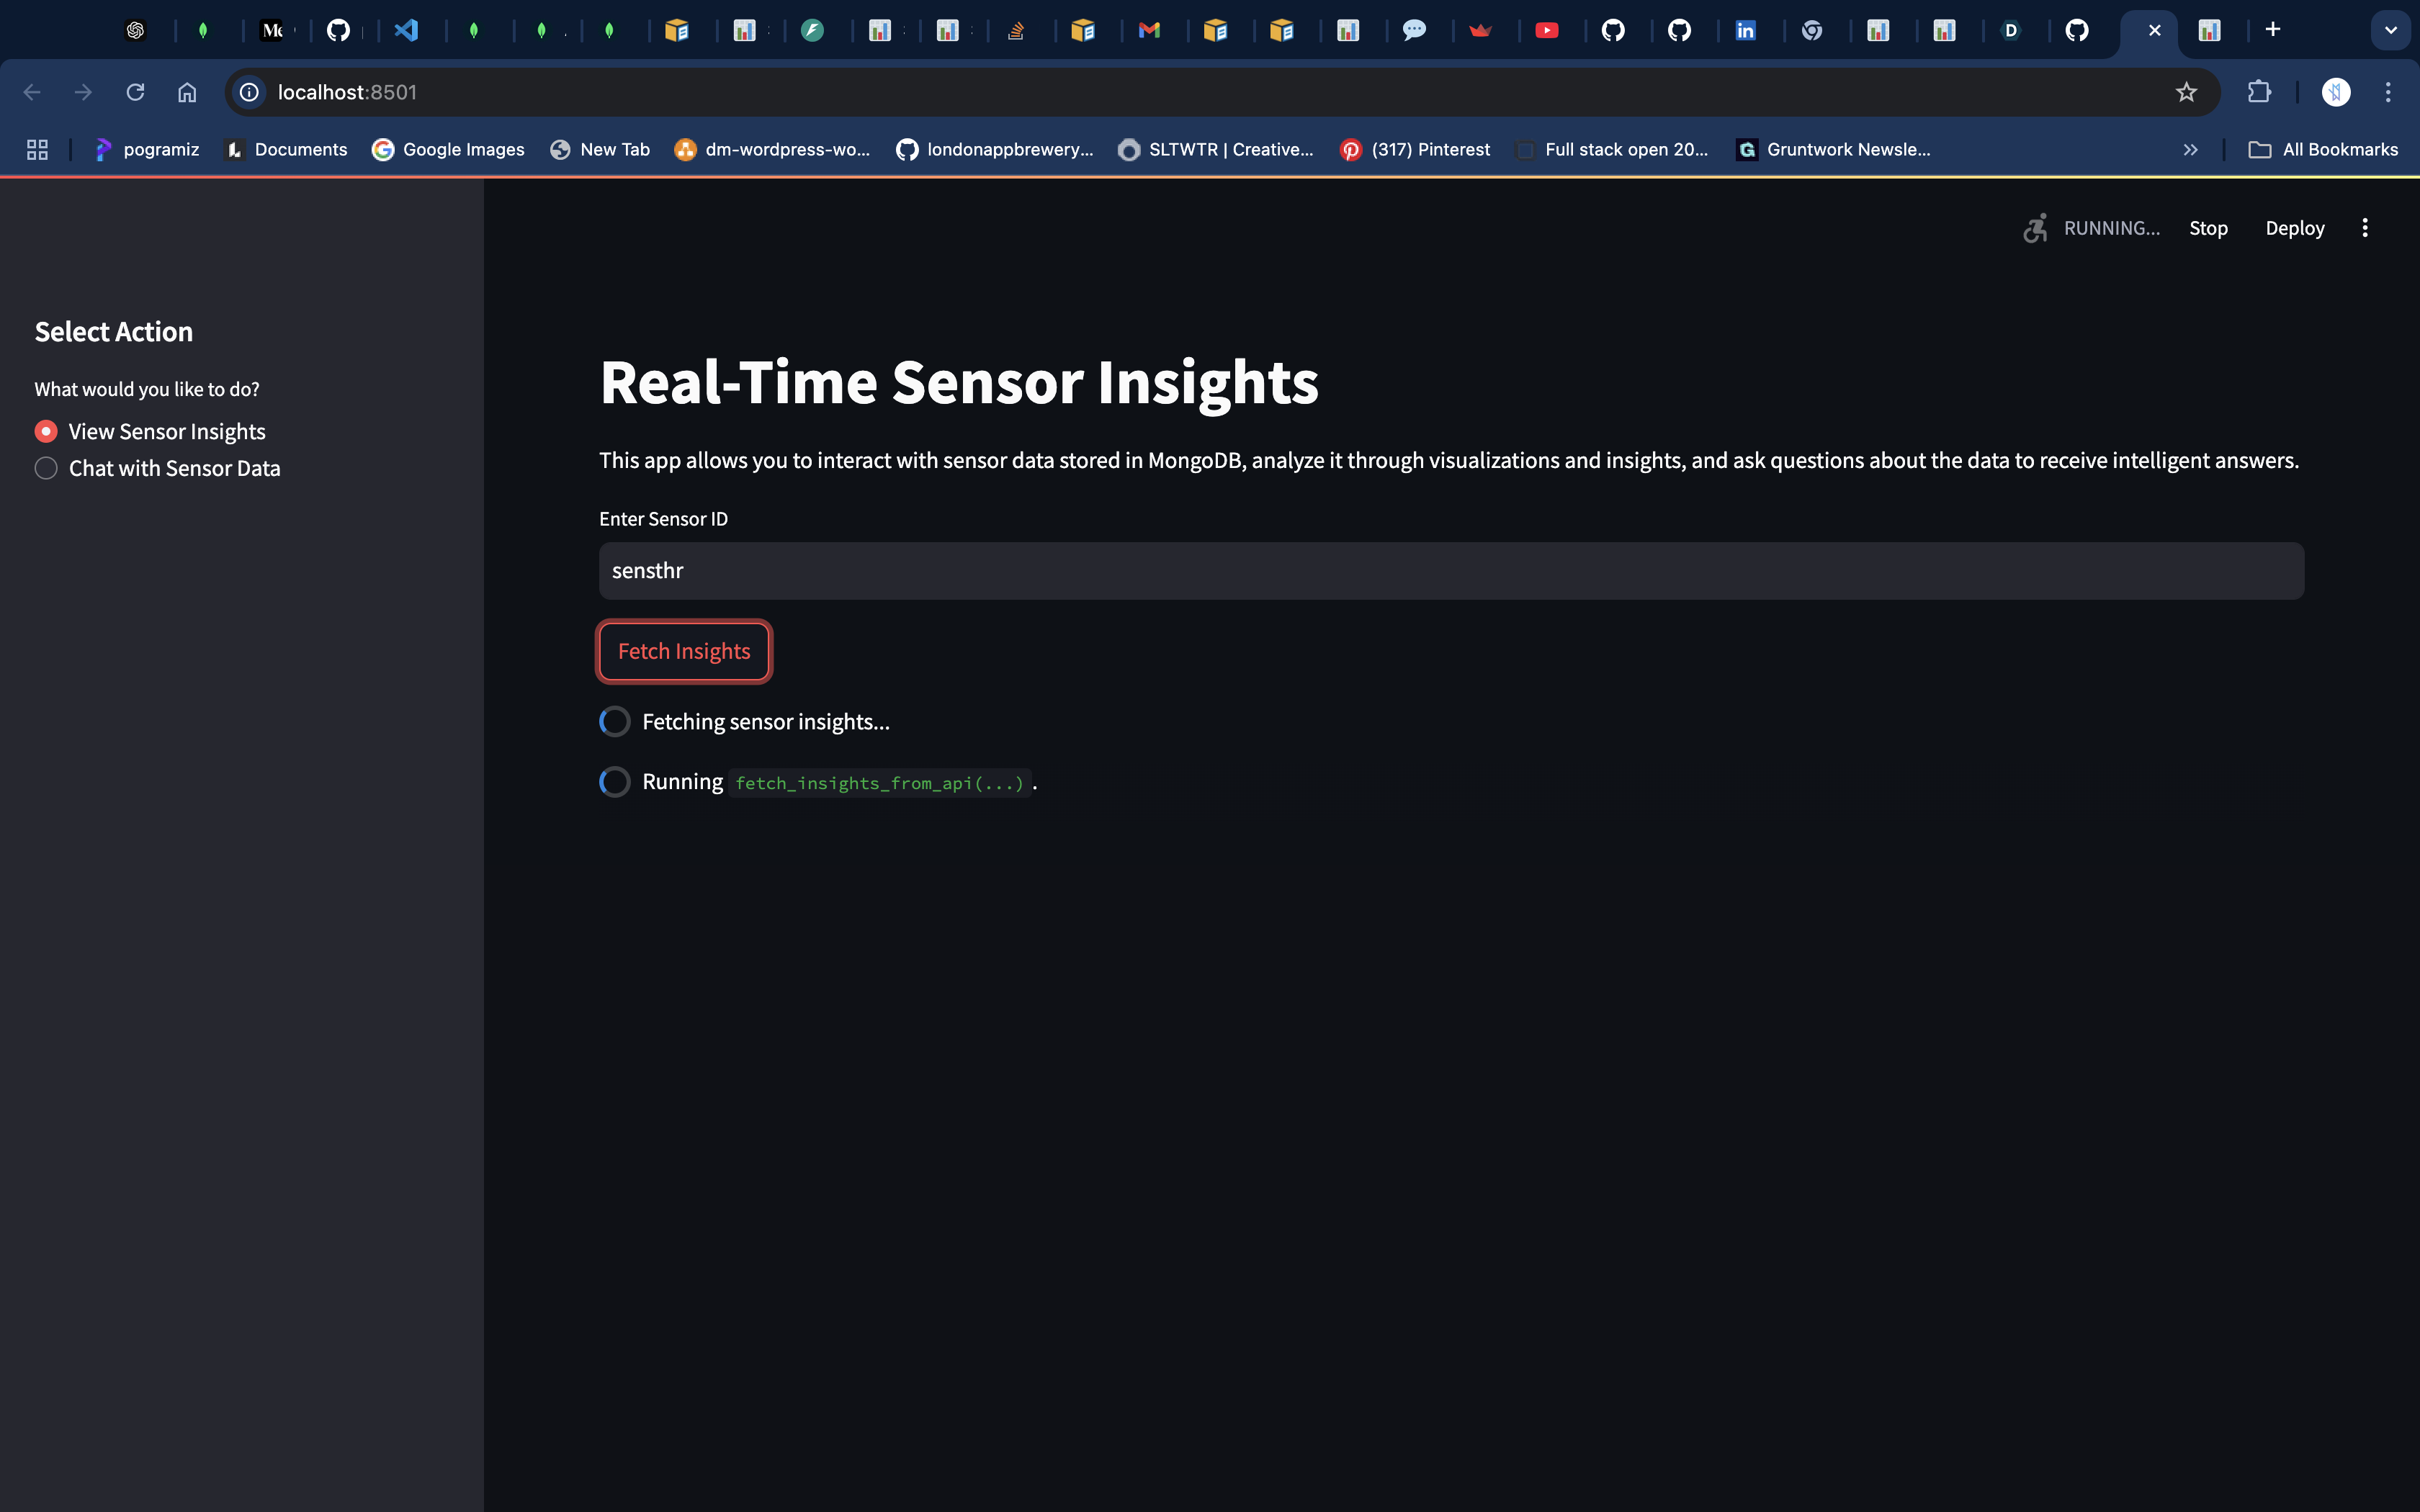
Insight Generation: The app visualizes real-time sensor data in dynamic charts and graphs, offering a clear view of trends and patterns across multiple environmental metrics. It allows users to explore different sensor readings, such as temperature, humidity, and air quality, in an easy-to-understand format.
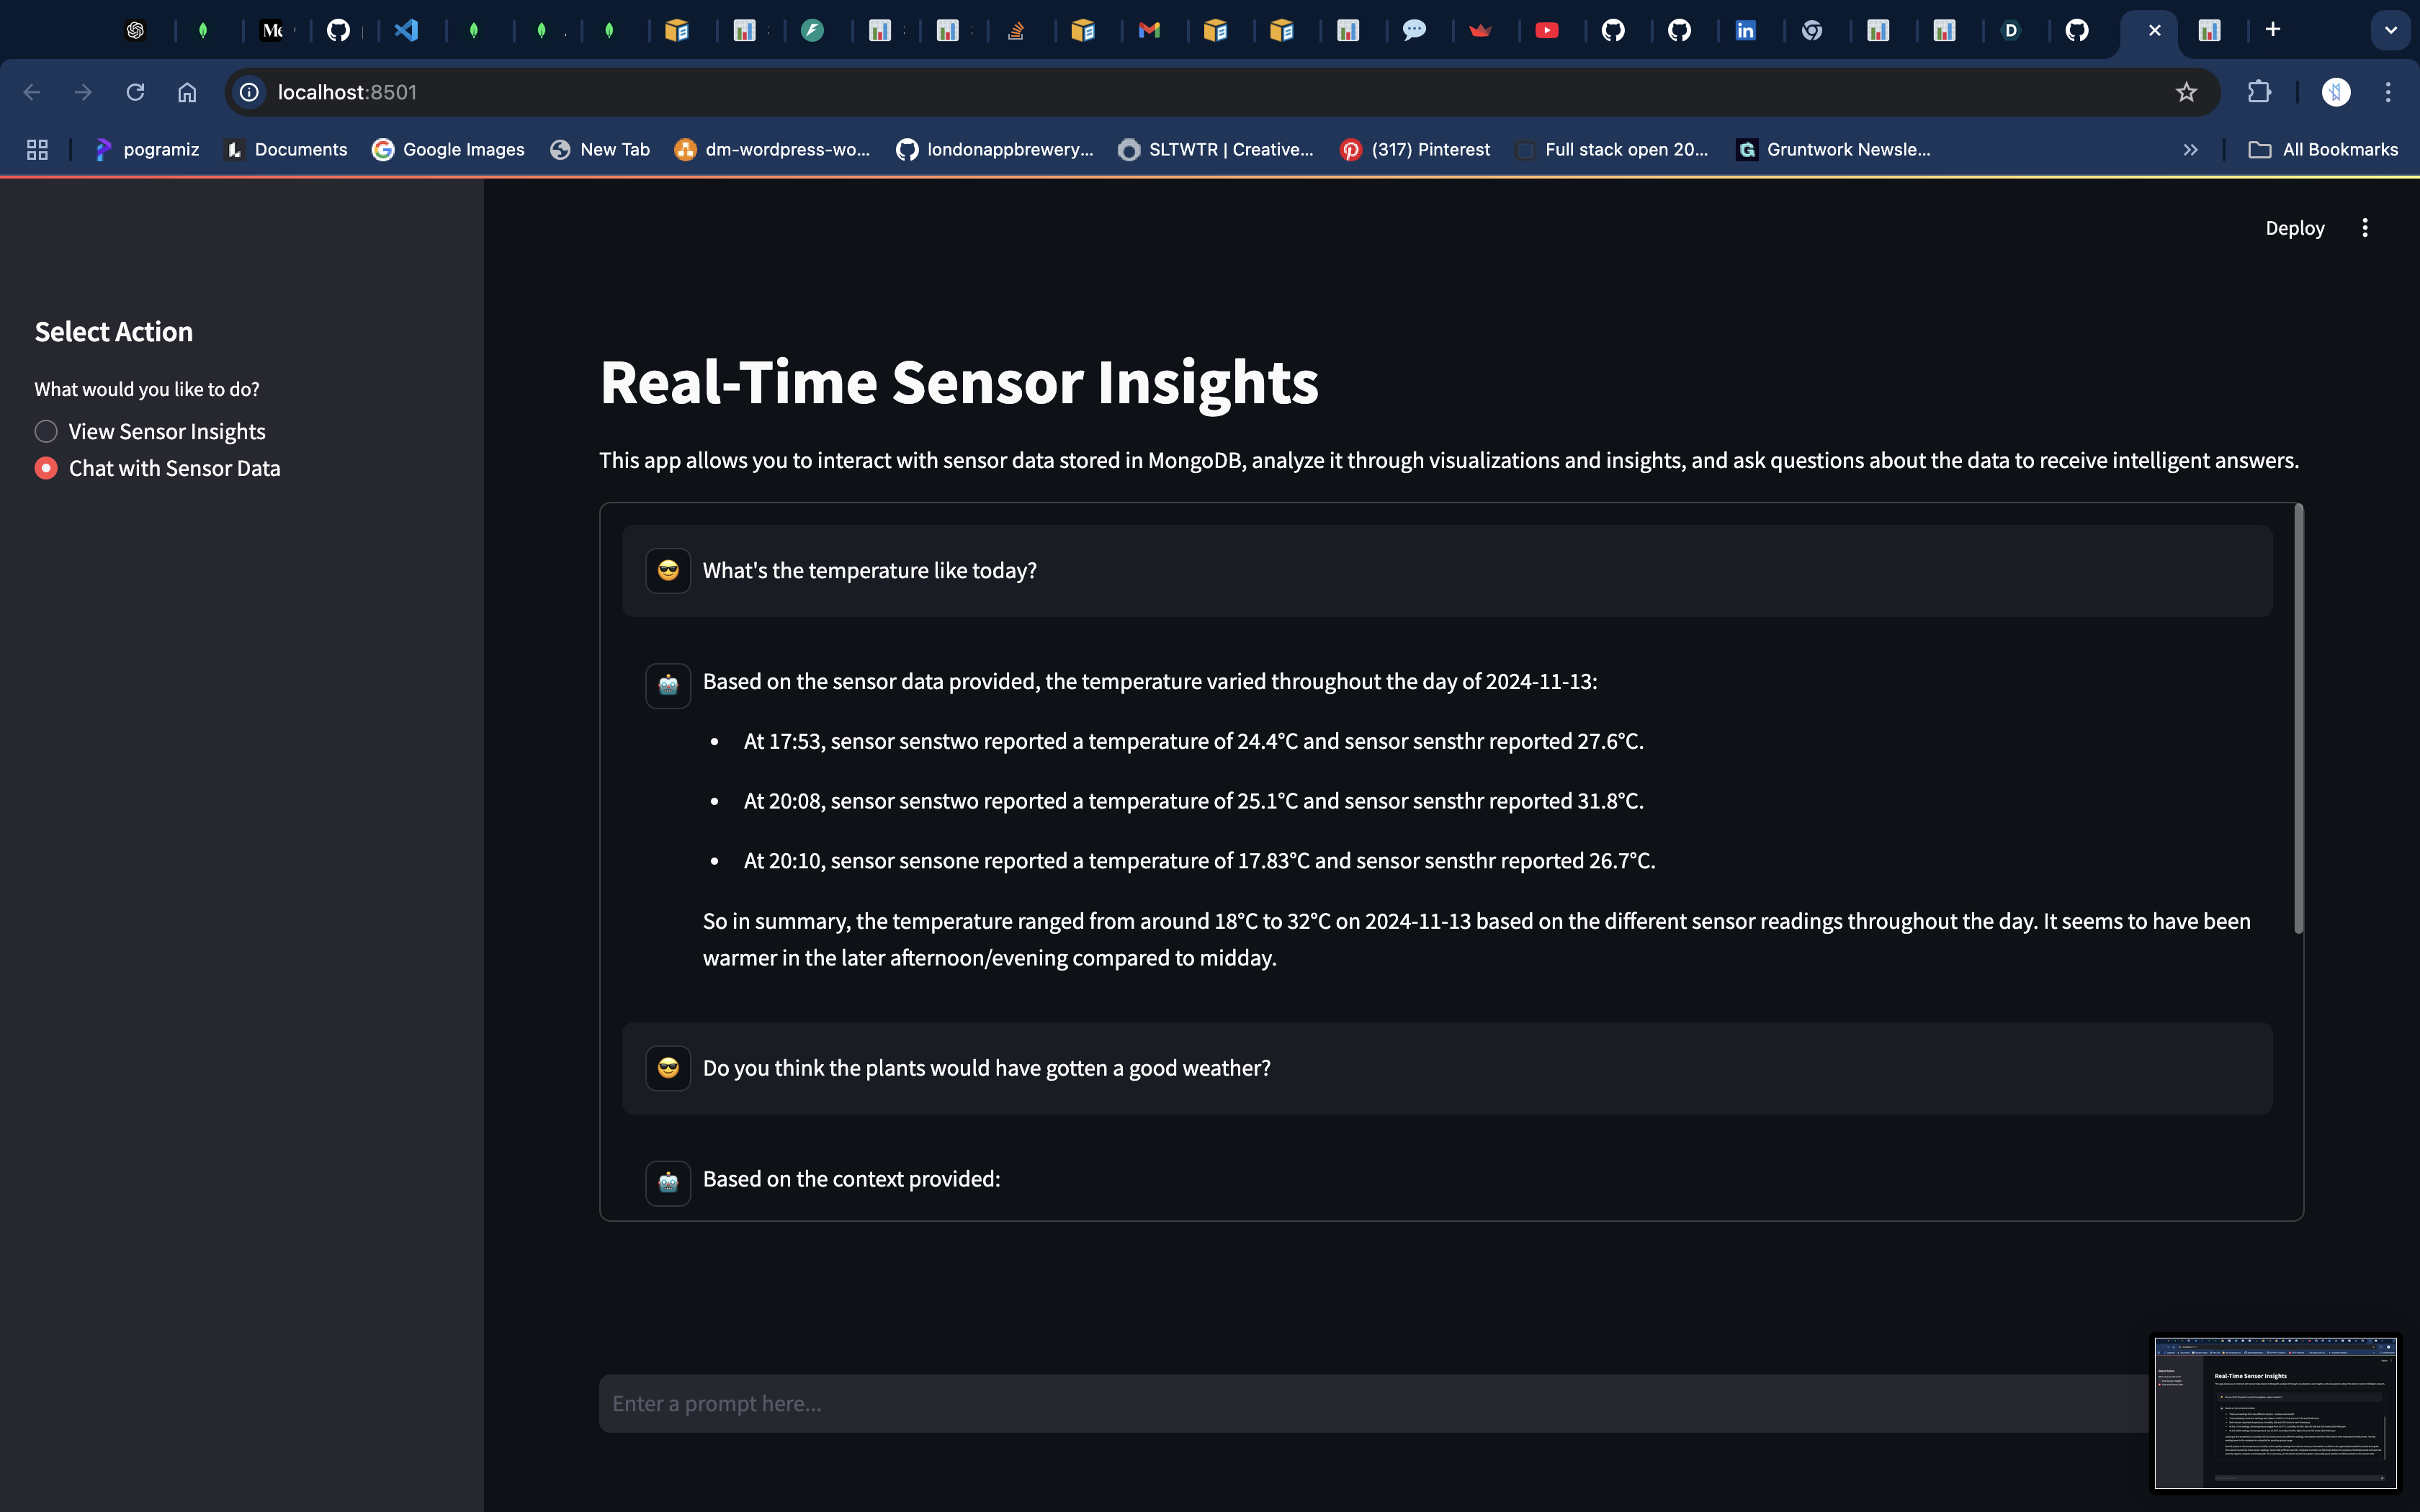
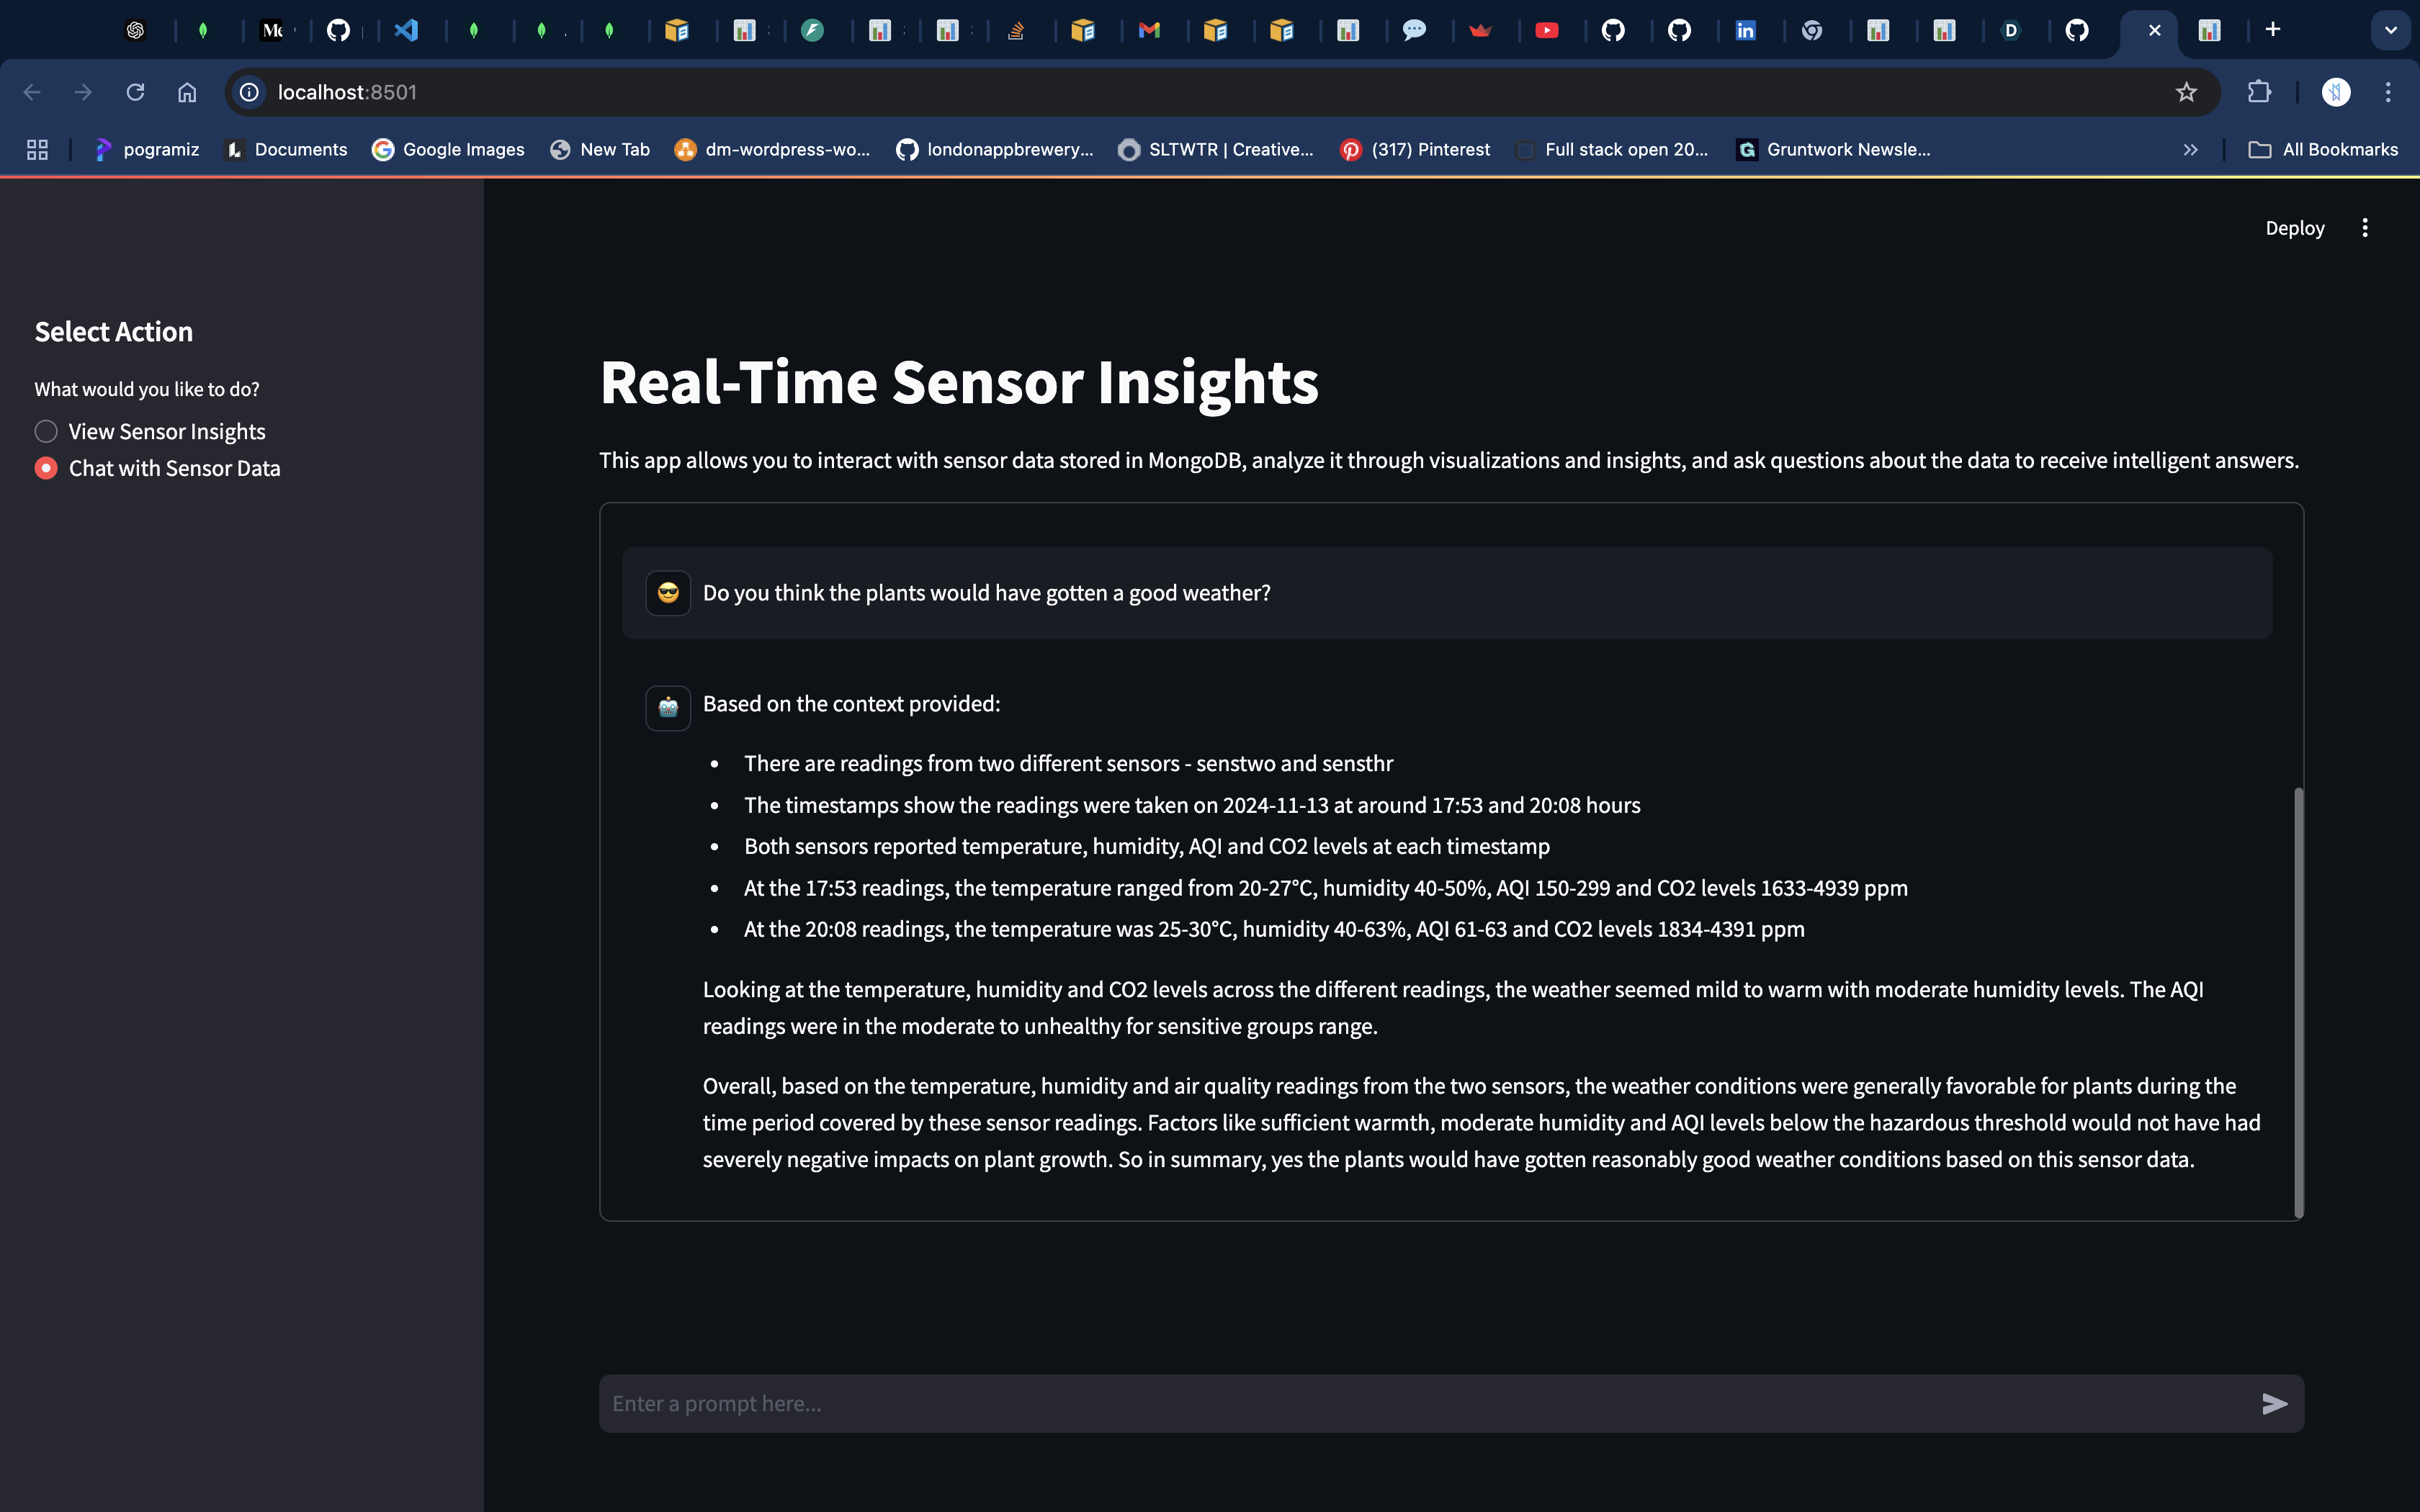
Retrieval-Augmented Generation (RAG): Using AWS Bedrock and LangChain, the app supports a RAG-based chat interface, where users can ask questions about the sensor data. The app answers questions based on both pre-existing knowledge (from the models) and real-time queries pulled from the MongoDB Atlas database, providing contextually relevant and accurate answers.
How I built it
The project was developed in several key phases:
Backend Setup: The app's backend is powered by FastAPI, which serves as the primary API to handle data requests and responses. MongoDB Atlas was used to store historical sensor data, which was indexed using MongoDB's Vector Search for efficient retrieval based on relevance.
Data Visualization: The front-end is built using Streamlit, which allowed rapid prototyping and easy integration with Python. I created components such as sensor charts, forms, and a chat interface to make the app interactive. Real-time sensor data can be visualized through dynamic charts that update as new data comes in.
Integration with AWS Bedrock and LangChain: AWS Bedrock powers the natural language generation (NLG) capabilities of the app. I used LangChain to manage the interaction between the database (MongoDB Atlas) and the language models, enabling the app to retrieve data and provide accurate answers in natural language.
Deployment: After developing the core functionality, I deployed the app using Streamlit Cloud, allowing for quick and easy sharing of the app with users.
Challenges I ran into
Database Query Optimization: Initially, fetching and processing large amounts of sensor data from MongoDB Atlas was slow. I had to optimize the queries and utilize MongoDB’s Vector Search to ensure the data retrieval process was efficient and fast, especially when responding to queries in the chat interface.
Integrating AWS Bedrock and LangChain: Getting AWS Bedrock and LangChain to work together was a complex task. I faced challenges in setting up the appropriate APIs, managing the credentials, and integrating the data retrieval pipeline to generate meaningful responses based on sensor data.
Real-Time Data Visualization: Ensuring that the data visualizations in Streamlit updated in real-time as new sensor data arrived was tricky. I needed to configure the app to handle dynamic updates without crashing or introducing significant latency.
Scaling the Application: Ensuring that the app could handle concurrent user requests without performance degradation was another challenge. This was resolved by implementing asynchronous requests and optimizing database queries.
Accomplishments that I'm proud of
Real-Time Chat and Insights: The successful integration of RAG into the chat interface, where users can ask questions and get accurate, data-driven answers from the historical sensor data, was a major accomplishment. This feature adds real value to users by transforming raw data into actionable insights.
Scalable Data Management: Setting up MongoDB Atlas with Vector Search and optimizing it for efficient data retrieval was a crucial achievement. This scalability allowed for fast responses and a smooth user experience.
Streamlined Deployment: Deploying the app on Streamlit Cloud allowed me to easily share the tool with users and gather valuable feedback. The deployment process was straightforward, and the app is now accessible to a wide audience.
What I learned
Cloud Integration: Working with AWS Bedrock and MongoDB Atlas taught me how to integrate cloud-based services to manage large datasets and leverage powerful language models for real-time processing.
Real-Time Data Processing: I learned the importance of optimizing database queries for real-time applications and handling concurrent requests in an efficient manner to maintain a responsive user interface.
User Interface Design: Although Streamlit is easy to use, designing a smooth and intuitive UI for a real-time data app was challenging. I learned how to structure the app layout, handle data visualizations, and create seamless interactions between users and the system.
LangChain Integration: Using LangChain to manage the interaction between different systems (database and language model) was an invaluable learning experience, allowing me to build more robust and dynamic AI-powered applications.
What's next for Insightpulse
Looking ahead, there are several exciting enhancements I plan to implement:
Expanded Data Sources: I intend to integrate additional types of sensor data, such as weather forecasts, air quality indices, and other environmental parameters to provide a more comprehensive set of insights.
Mobile App Integration: Developing a mobile version of Insightpulse would make it more accessible to users on the go, enabling them to interact with real-time sensor data anytime, anywhere.
AI-Powered Recommendations: Building out the RAG feature to not only answer questions but also suggest actions based on trends in the sensor data (e.g., suggesting when to take specific actions for air quality or temperature control).
Enhanced Visualizations: Introducing more advanced visualizations like heatmaps, geographical overlays, and predictive analytics will provide richer insights to users.
Improved User Authentication and Security: Adding user authentication to personalize the experience and ensuring data security are essential next steps as the app expands.
Insightpulse is more than just a data visualization tool; it’s a bridge between raw sensor data and actionable insights, powered by cutting-edge AI and cloud technologies. I’m excited about the potential to scale this project and continue learning from the users and the data.
For more information or to try the app, visit Insightpulse.
Built With
- amazon-bedrock
- fastapi
- langchain
- mongodb-atlas
- python
- streamlit
- streamlit-cloud


Log in or sign up for Devpost to join the conversation.