-
-
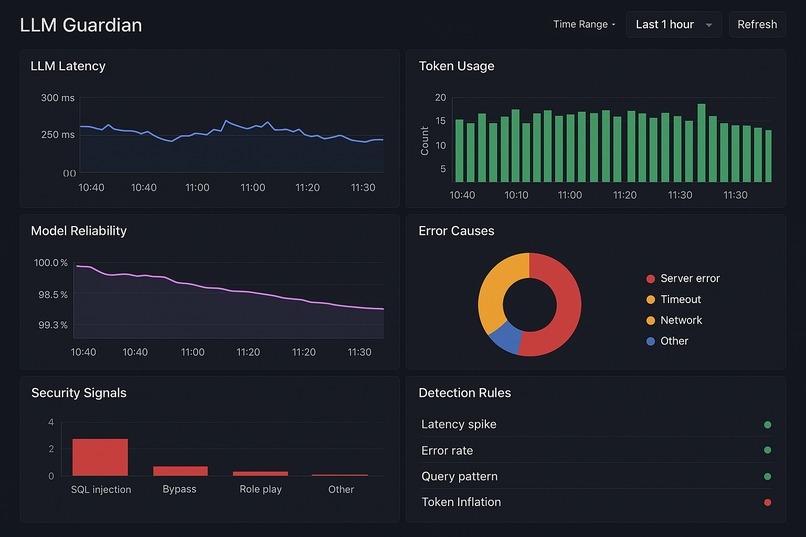
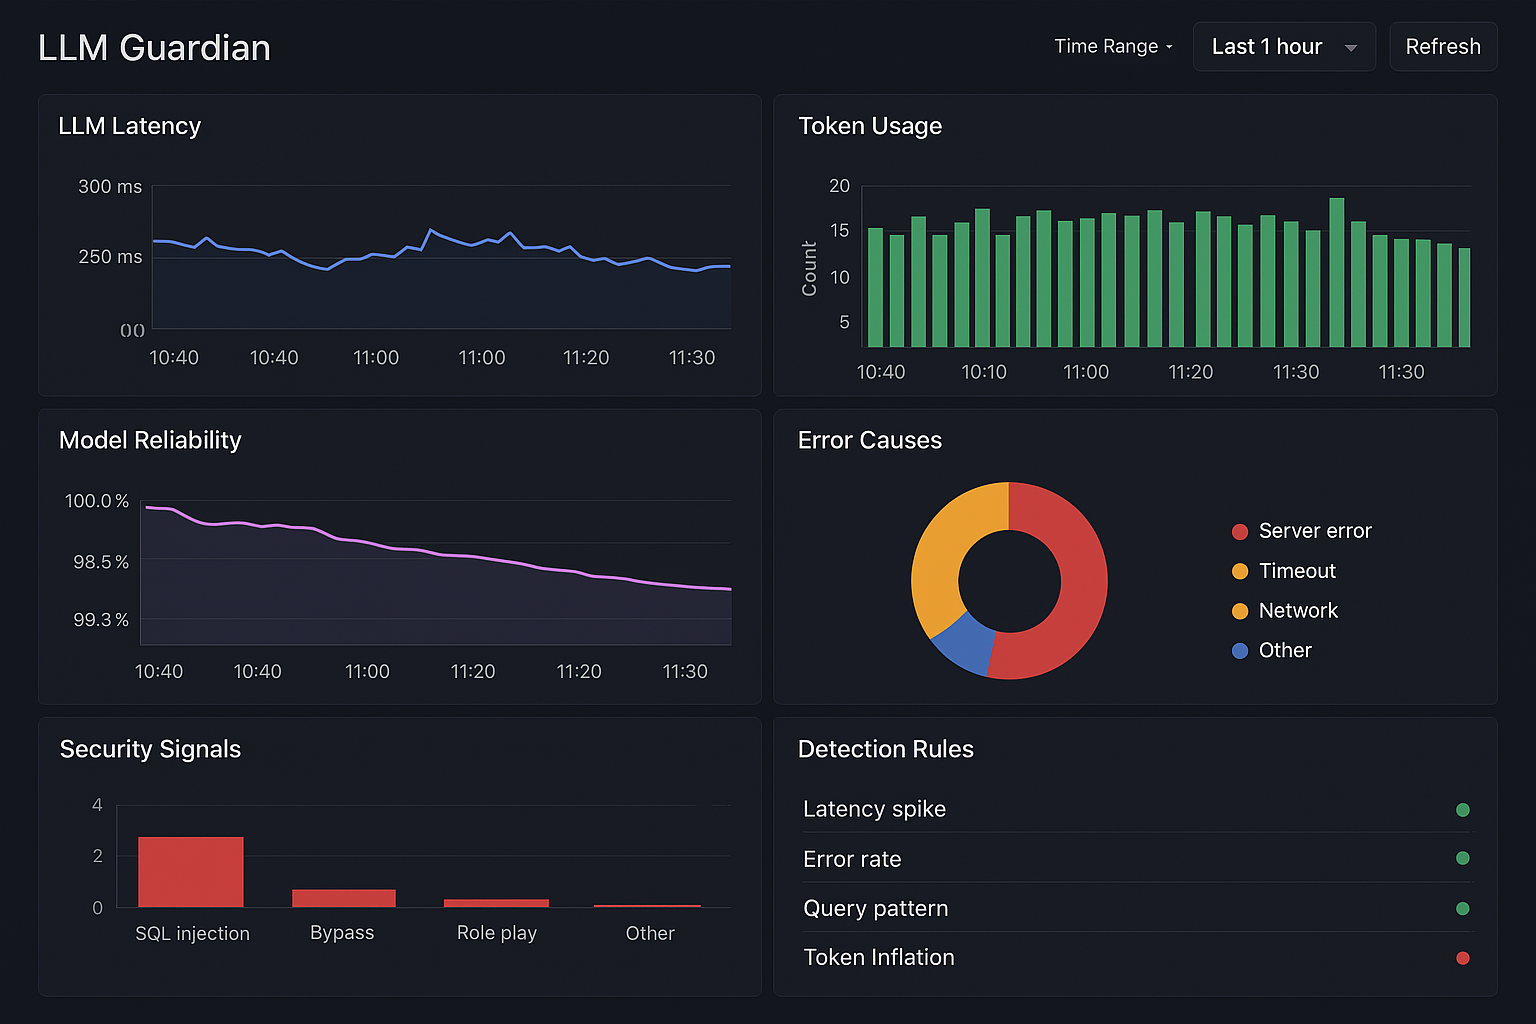
“LLM Guardian dashboard visualizing end-to-end AI telemetry: latency trends, token metrics, model reliability, error distribution, security
Here is a clean, polished Project Story written in Markdown, with optional LaTeX formatting support. You can copy–paste this directly into Devpost.
⭐ Project Story — LLM Guardian
🚀 Inspiration
As AI applications scale, ensuring reliability, safety, and observability becomes increasingly difficult. Traditional monitoring tools aren’t designed for the unique behaviors and failure modes of LLMs—like prompt injection, drift in model responses, unpredictable latency spikes, and hidden token usage.
We wanted to create a system that gives AI engineers the same level of visibility that SRE teams have for cloud apps. This inspired us to build LLM Guardian, an end-to-end AI observability platform combining the intelligence of Google Vertex AI/Gemini with the powerful monitoring ecosystem of Datadog.
🧠 What We Learned
Building this project taught us several important lessons:
- Modern LLM telemetry is more than logs—it includes latency, token count, context size, and safety scores.
- Datadog APM and Metrics can be extended to support AI workloads using structured events.
- Vertex AI/Gemini exposes fine-grained model metadata useful for monitoring.
- Combining real-time anomaly detection with LLM telemetry improves reliability and reduces debugging time.
- Observability for AI requires both performance monitoring and prompt-level security monitoring.
- A well-designed pipeline can surface issues before they reach users.
We also learned how to design alerting thresholds using statistical formulas, such as: [ \text{Latency Threshold} = \mu_{\text{latency}} + 3\sigma ] to detect abnormal model behavior.
🏗️ How We Built the Project
We designed LLM Guardian as a modular, cloud-native system:
1. LLM Backend
- Built using Google Vertex AI / Gemini models
- Exposes an API for prompts, responses, and metadata
- Emits structured telemetry (latency, tokens, response time, safety flags)
2. Telemetry Pipeline
- Google Cloud Run + Cloud Functions collect runtime logs
- Logs flow into Datadog via Log Intake API
- Metrics (token count, success rate, latency) pushed to Datadog Metrics API
- Traces captured using Datadog APM SDK
3. Datadog Observability Layer
We built:
- Dashboards for latency, token usage, model reliability, and throughput
- Security dashboard for prompt anomalies
Detection rules for:
- Latency spikes
- Error rate deviations
- Suspicious query patterns
- Sudden token inflation
4. Incident Automation
When detection rules fire:
- Datadog triggers an Incident
- Context includes logs, last 5 prompts, error messages, and statistical summaries
- AI engineers can take action instantly
🧩 Challenges We Faced
Building observability specifically for LLMs came with unique challenges:
1. Structuring Telemetry for AI Models
LLM responses don’t always produce consistent metadata. Designing a schema that captured:
- token usage
- response length
- latency
- safety signals
required custom formatting.
2. Real-Time Detection Sensitivity
If thresholds were too strict → too many false alerts If too loose → incidents were missed
We solved this by using rolling window statistics: [ \text{Dynamic Threshold} = \mu_{t-5:t} + 2\sigma_{t-5:t} ]
3. Visualizing AI-specific metrics
Datadog dashboards needed new metric types, such as:
- “Prompt Toxicity Confidence”
- “Token Drift Factor”
- “Semantic Response Variability”
4. Streaming Logs Efficiently
LLM logs can be large; we optimized payloads by batching and compressing JSON events.
5. Mitigating Prompt Attacks
We added detection rules for patterns like:
- SQL injection attempts
- Security bypass prompts
- Role play override prompts
Built With
- java
- javascript
- mysql
- react
- springboot
- springsecurity

Log in or sign up for Devpost to join the conversation.