Inspiration
Sports injuries often come from overuse and missed recovery signals. We wanted a simple, daily check‑in that translates training load and wellness into clear, preventative guidance athletes and coaches can act on.
What it does
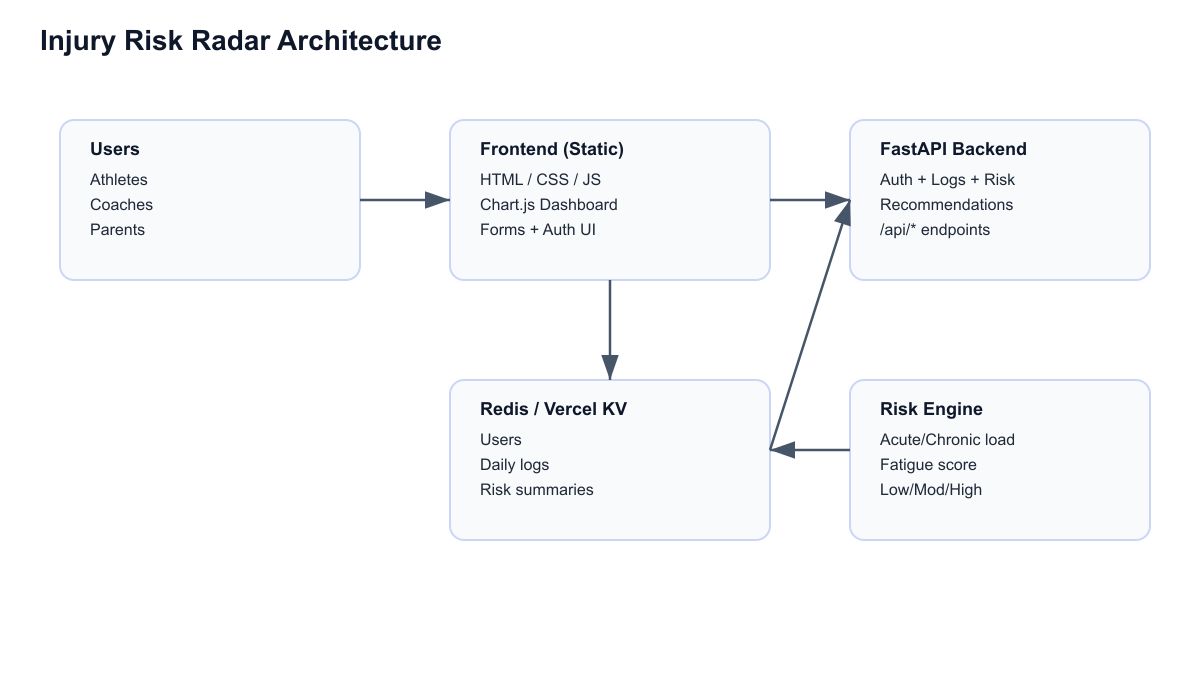
Injury Risk Radar lets users log training duration, intensity, soreness, sleep, and rest days. It calculates a risk score (Low/Moderate/High), shows trend charts, and provides actionable recommendations to reduce injury risk.
How we built it
We built a FastAPI backend with JWT auth and a risk‑scoring engine, a static web frontend with Chart.js for visual trends, and a Redis/Vercel KV store for fast persistence. The app is deployed as a full‑stack Vercel project with a /api backend route.
Challenges we ran into
- Adapting the backend for serverless execution on Vercel and fixing import/path issues.
- Replacing Firebase with Vercel KV and updating data access patterns.
- Handling dependency/runtime quirks (bcrypt and Python packaging).
- Ensuring the dashboard charts update cleanly without duplicate canvas usage.
Accomplishments that we're proud of
- A working end‑to‑end MVP with auth, logging, risk scoring, and recommendations.
- A lightweight UI that supports quick daily input and clear risk visualization.
- A deployment setup that runs full‑stack on Vercel with minimal infrastructure.
What we learned
We learned how to adapt a FastAPI app to serverless deployment, use Redis/Vercel KV effectively, and design a risk scoring approach that’s transparent and easy to explain to non‑technical users.
What's next for Injury Risk Radar
- Add wearable integrations and automatic data ingestion.
- Improve risk modeling with personalized ML and sport‑specific patterns.
- Expand coach/team analytics with aggregate dashboards.
- Add notifications and scheduled reminders for consistent logging.

Log in or sign up for Devpost to join the conversation.