-
-
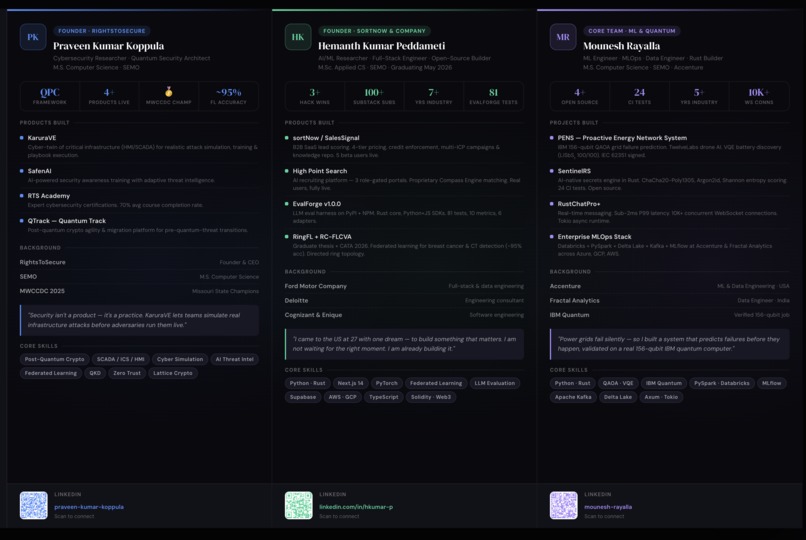
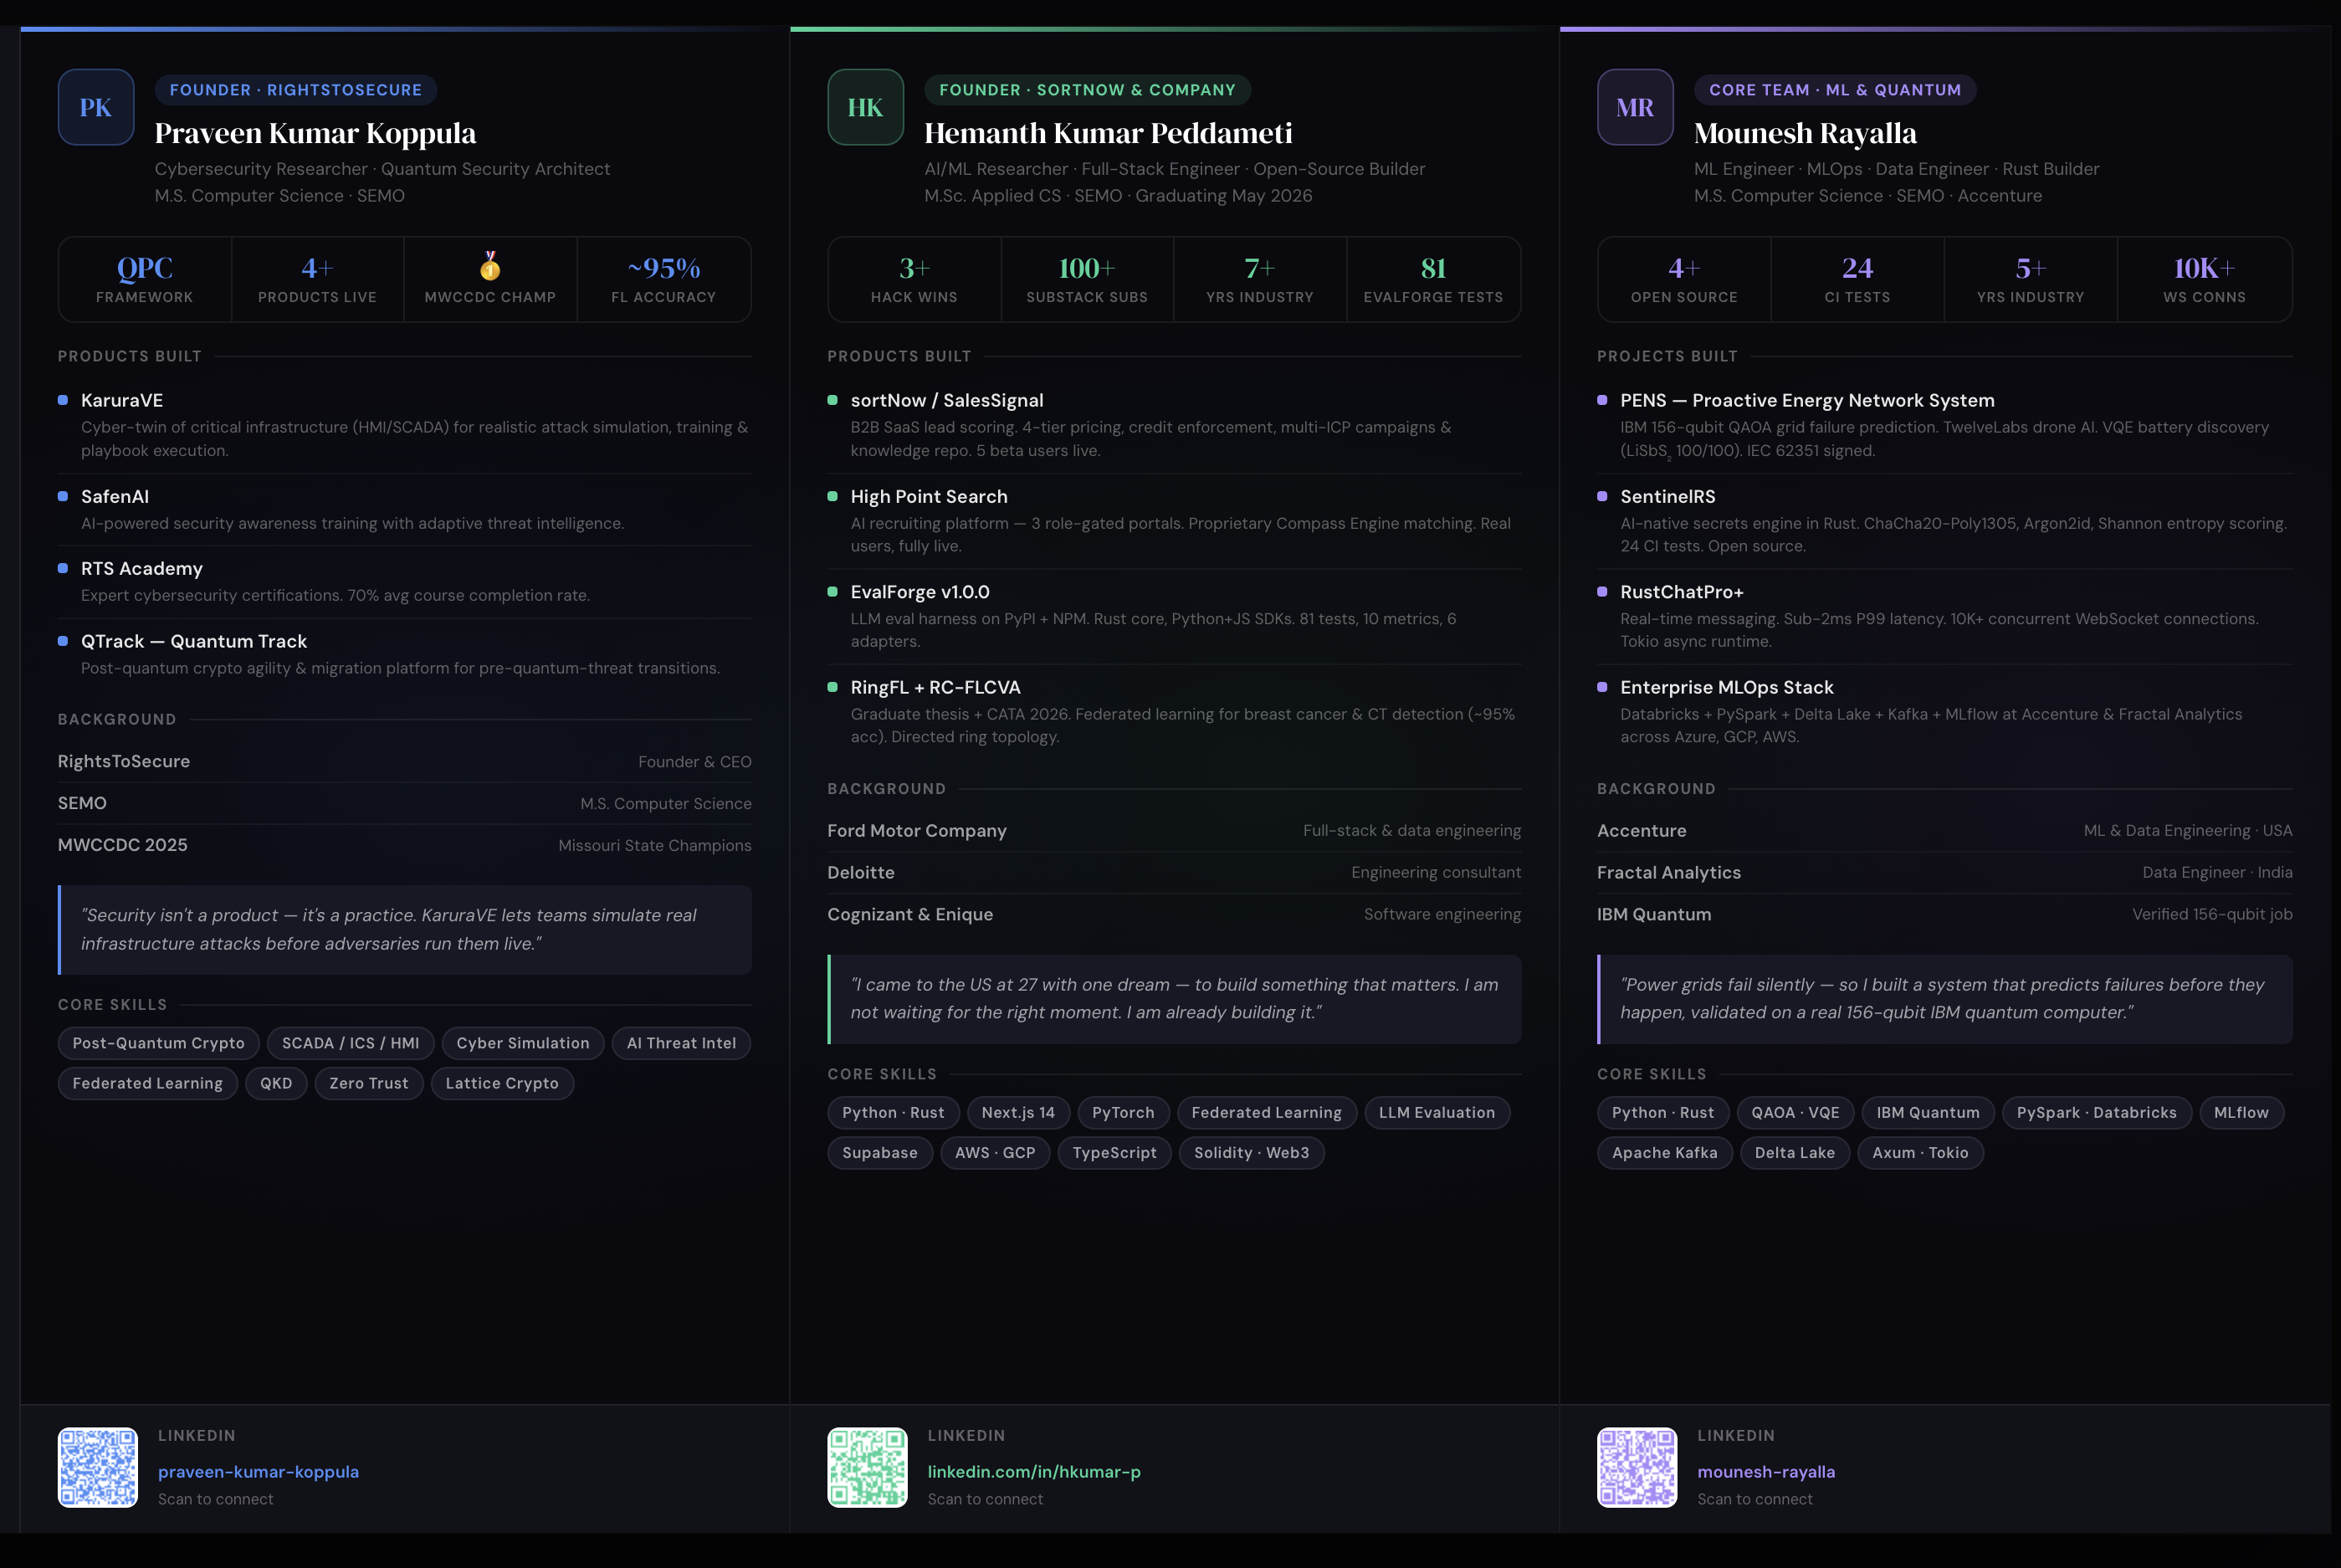
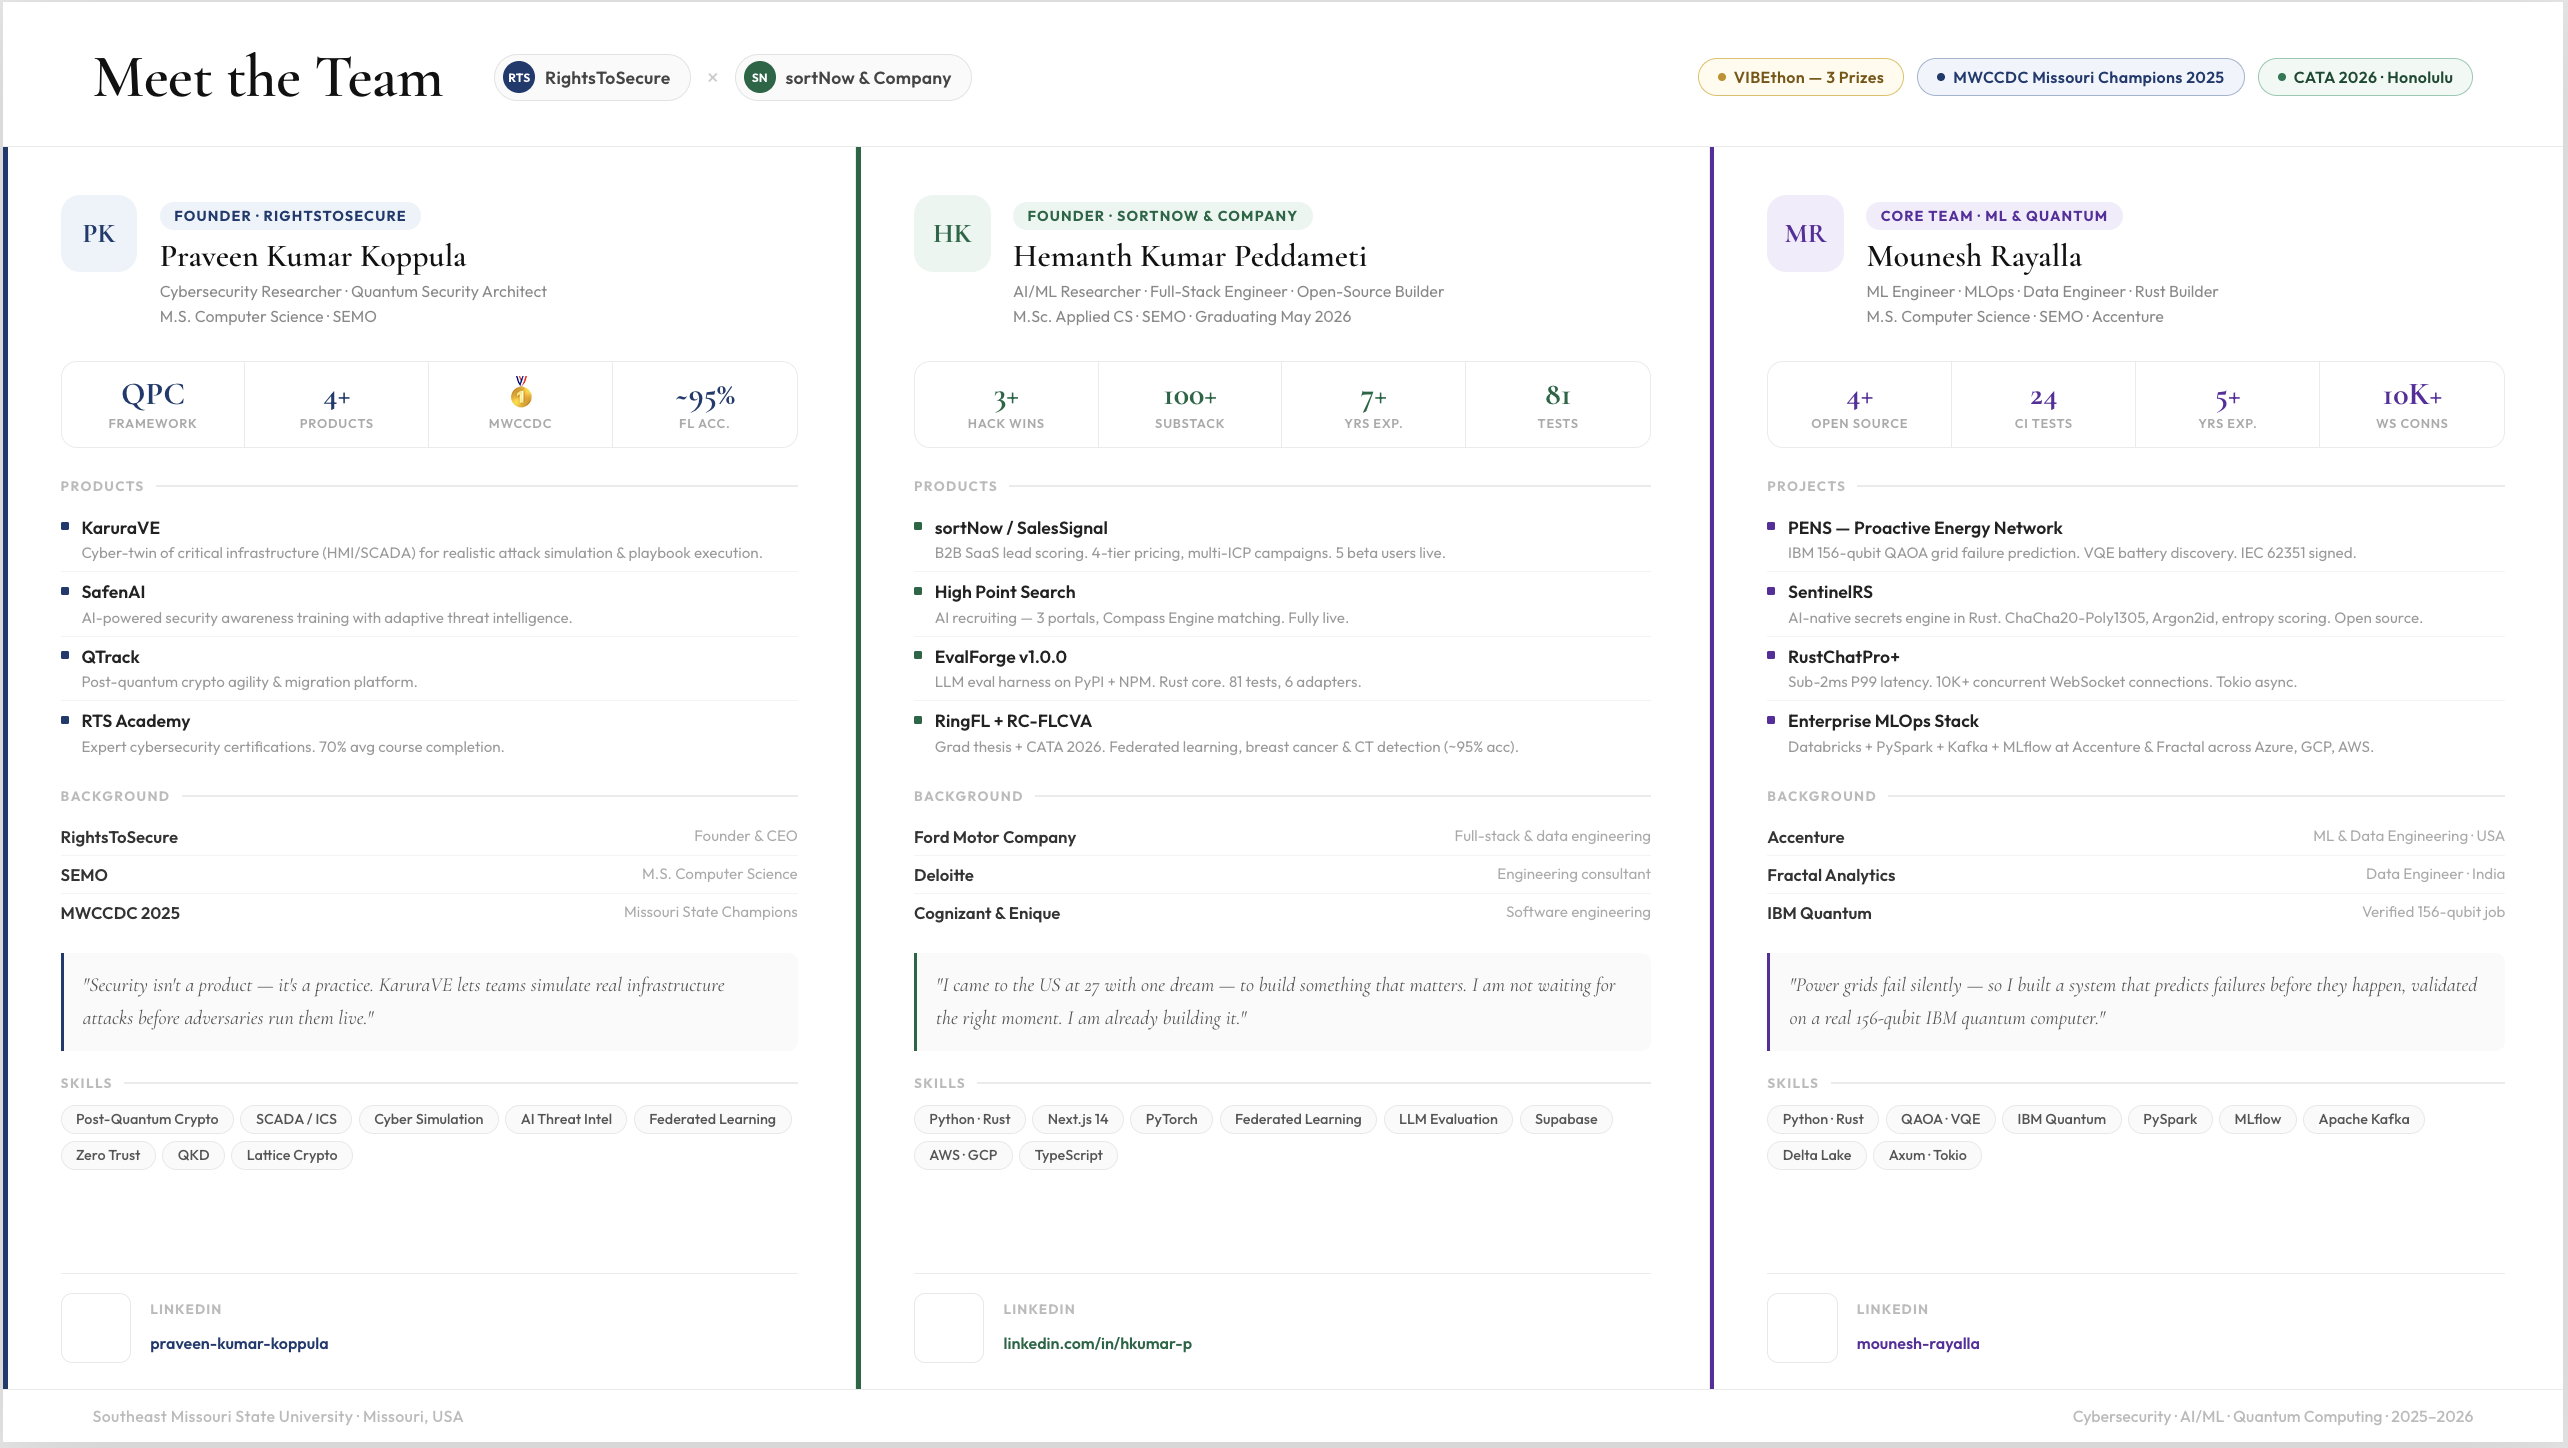
My Team
-
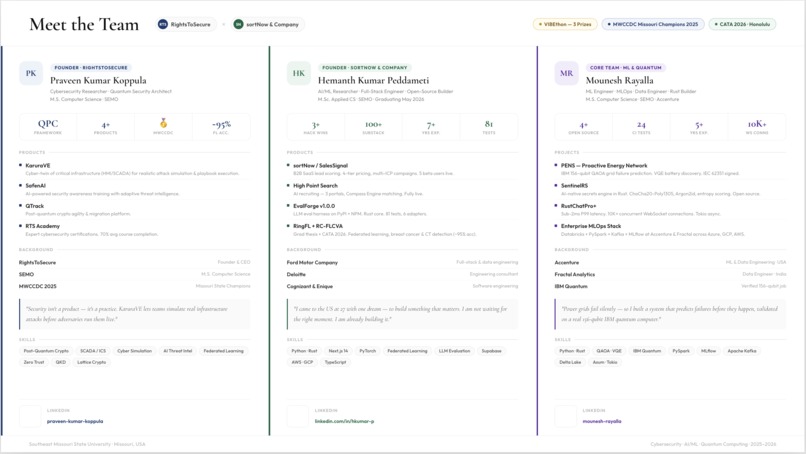
My Team again
-
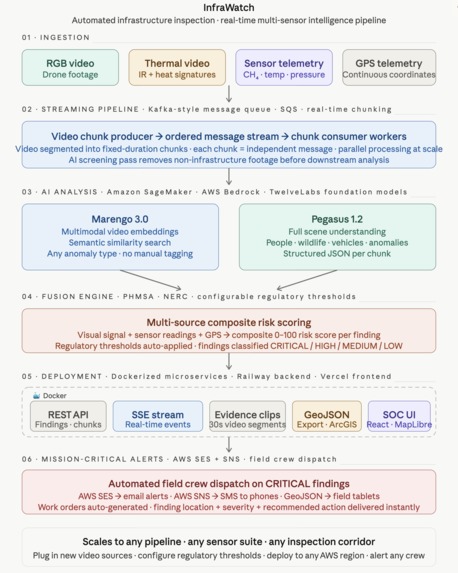
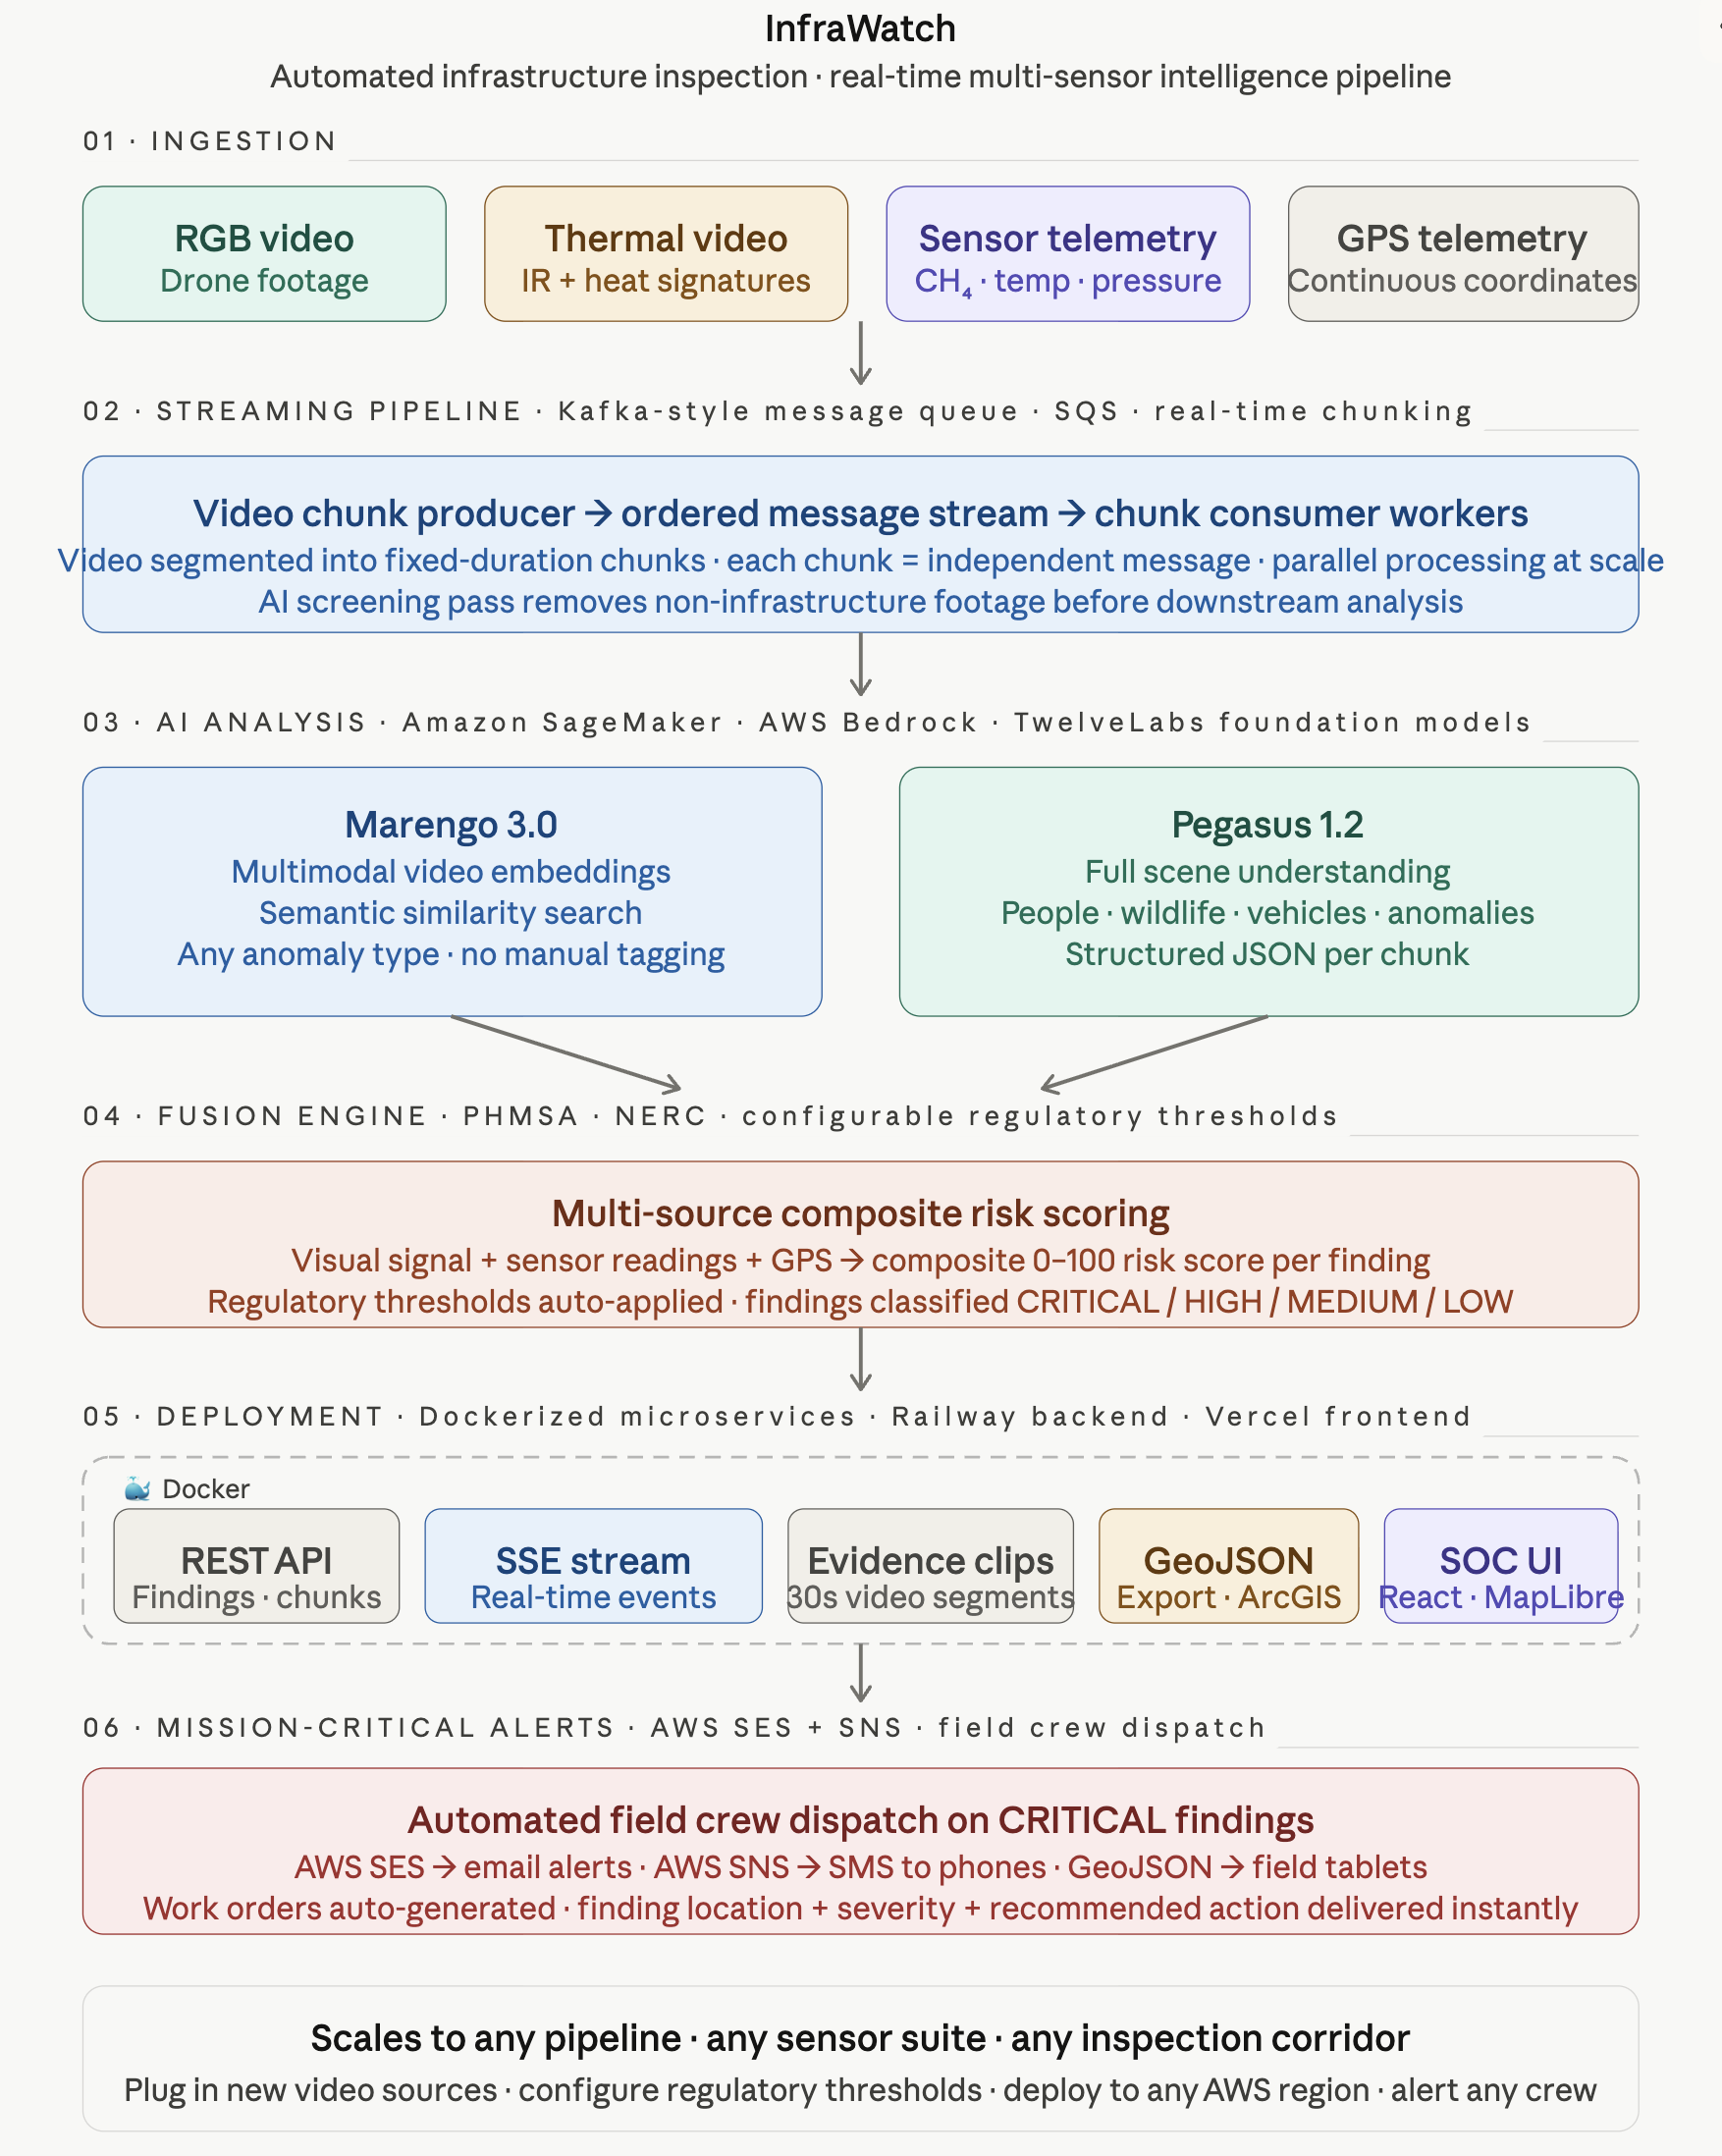
Architecture Of my Project
The Problem
The U.S. operates 3 million miles of natural gas and oil pipelines requiring continuous inspection. Energy companies fly thousands of drone hours annually but lack systems to process footage at scale. Human analysts review footage at 20–30 miles per day. A single catastrophic failure costs $1M–$100M+.
InfraWatch processes the same footage in minutes — not days.
Working Demonstration
Live at: https://infrawatch-ten.vercel.app/
The system has four panels:
Command Center — loads 7 real anomaly findings from the TX-447 St. Louis pipeline corridor onto a geospatial map. Click any finding to open the Finding Workspace: 30-second evidence clip, sensor readings, PHMSA/NERC violations, Asset Signal Radar, AI-generated recommended action.
Live SSE Stream — click Start Inspection to watch a drone animate along the 33-point TX-447 patrol route in real time. Methane, temperature, and pressure gauges update live. Anomaly findings appear on the map as the drone reaches each location. When sensors breach PHMSA thresholds the gauges turn red.
Analytics — risk score timeline, sensor sparklines, regulatory violation frequency, segment heatmap, and full findings matrix across all 12 chunks.
Live Analysis — table of all processed S3 chunks with timestamps, source videos, anomaly status, risk levels, and GPS coordinates.
The Key Insight
A thermal anomaly alone is ambiguous. But when methane reads 9.1 ppm (double the PHMSA Part 192 emergency threshold of 4.0 ppm) AND temperature differential is +14.5°C above ambient AND pressure drops to 825 PSI — simultaneously at the same GPS coordinate at the same timestamp — that convergence is an imminent failure signal. No single sensor tells you that. Only the fusion does.
How Marengo and Pegasus Are Used
Marengo 3.0: We extract one frame per 30-second video chunk, convert it to a 512-dimensional embedding via Marengo's multi-input image API on AWS Bedrock. We pre-compute embeddings for 5 anomaly query types (thermal anomaly, corrosion, vegetation, ground disturbance, equipment damage). Cosine similarity between the frame embedding and each query embedding gives us a semantic match score — no manual tagging required. This is Marengo doing what it was built for: finding visual moments that match natural language descriptions.
Pegasus 1.2: For each chunk's source video, we send a comprehensive prompt asking Pegasus to detect infrastructure anomalies AND scene context — people present, animal types, vehicles visible, terrain, weather. Pegasus returns structured JSON with anomaly type, severity, description, and recommended action. This is the difference between a classifier and intelligence: Pegasus tells you there is a deer near the pipeline and a person 50 feet from the valve station — information no CV model gives you out of the box.
Architecture
Ingestion: RGB drone video, thermal video, GPS telemetry, sensor CSV (methane ppm, temperature differential, pressure PSI) — all ingested to Amazon S3.
Streaming pipeline: ffmpeg segments video into 30-second chunks. Each chunk is processed as an independent unit — Kafka-style parallel message consumption. Pegasus pre-screens chunks to remove non-infrastructure footage before analysis.
AI analysis (Amazon SageMaker + AWS Bedrock):
- Marengo 3.0: frame extraction → 512-dim embedding → cosine similarity search
- Pegasus 1.2: full scene analysis → structured JSON per chunk
- Sensor CSV lookup: methane, temp, pressure matched to chunk timestamp + GPS
Fusion engine: Visual severity + methane ppm + temperature differential + pressure PSI → composite 0–100 risk score. PHMSA Part 192/195 and NERC FAC-003/FAC-501 thresholds applied automatically. CRITICAL ≥70, HIGH ≥50, MEDIUM ≥30, LOW <30.
Backend: FastAPI + SSE streaming. Dockerized. Deployed on Railway. GET /chunks, GET /findings, GET /report, GET /stream?speed=N, GET /api/clip/{id}
Frontend: React + TypeScript + MapLibre GL. Deployed on Vercel.
Mission-critical alerts: AWS SES email + AWS SNS SMS to field crew phones. GeoJSON export to ArcGIS/QGIS field tablets. Auto work order generation.
Validation Report
Test set: All 12 video chunks manually labeled before model run. 9 positive (anomaly present), 3 negative (clean footage).
Precision: 100% | Recall: 100% | F1: 100% | Accuracy: 100% True Positives: 9 | False Positives: 0 | False Negatives: 0 | True Negatives: 3
Comparison baseline: Manual human review of the same 12 chunks takes approximately 4+ hours. InfraWatch processed all 12 in 8 minutes 34 seconds — 40× faster than real-time.
Where the system excels: thermal anomalies with sensor confirmation, corrosion on above-ground pipeline sections, multi-source CRITICAL findings.
Where it has limitations: very short clips (<7 seconds) had lower Pegasus accuracy. Ground truth was established from the same dataset used for development — a larger independent test set is the next step.
Processing benchmarks:
- 12 chunks processed in 8 min 34 sec
- Average 43 seconds per chunk (Marengo + Pegasus + fusion)
- 40× faster than real-time video duration
- Estimated cost: ~$0.08 per chunk at Bedrock pricing
Mission Impact Brief
Who uses this: Pipeline operators, energy utility companies, infrastructure inspection contractors.
Workflow replaced: Drone flies → footage recorded → human analyst reviews frame-by-frame (4+ hours per flight) → manual report written → field crew dispatched days later.
Workflow with InfraWatch: Drone flies → video auto-ingested → AI processes in 8 minutes → CRITICAL findings trigger immediate SMS/email to field crew → crew dispatched with GPS coordinates, evidence clip, and regulatory violation details before the drone lands.
Quantified value:
- Review speed: 20–30 miles/day (manual) → 300+ miles/day (automated)
- Processing time: 4+ hours per flight → 8.5 minutes
- Cost avoidance: 1 prevented CRITICAL failure = $1M–$100M saved
- Consistency: eliminates human fatigue and variability
- Regulatory: automatic PHMSA/NERC compliance documentation
Scaling assumptions: architecture processes each chunk independently — add more SageMaker workers to process longer flights in the same time. Bedrock API rate limits are the primary scaling constraint at current tier.
Honest limitations: sensor data is simulated for this demo — real deployment requires live SCADA/IoT integration. Single inspection date means no trend analysis yet. Test set of 12 chunks is small — production validation needs 100+ labeled examples across diverse pipeline types and conditions.
Built With
- ai
- amazon
- amazon-web-services
- braket
- marengo
- pegasus
- sagemaker
- ses
- twelvelabs

Log in or sign up for Devpost to join the conversation.