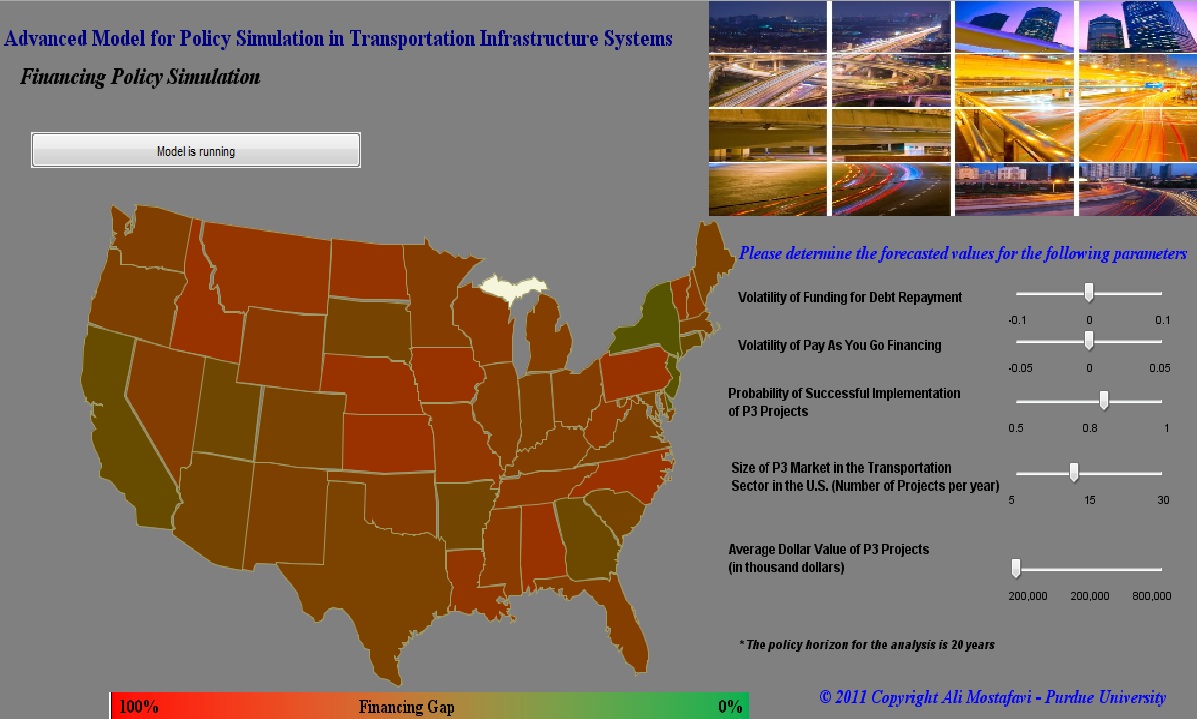
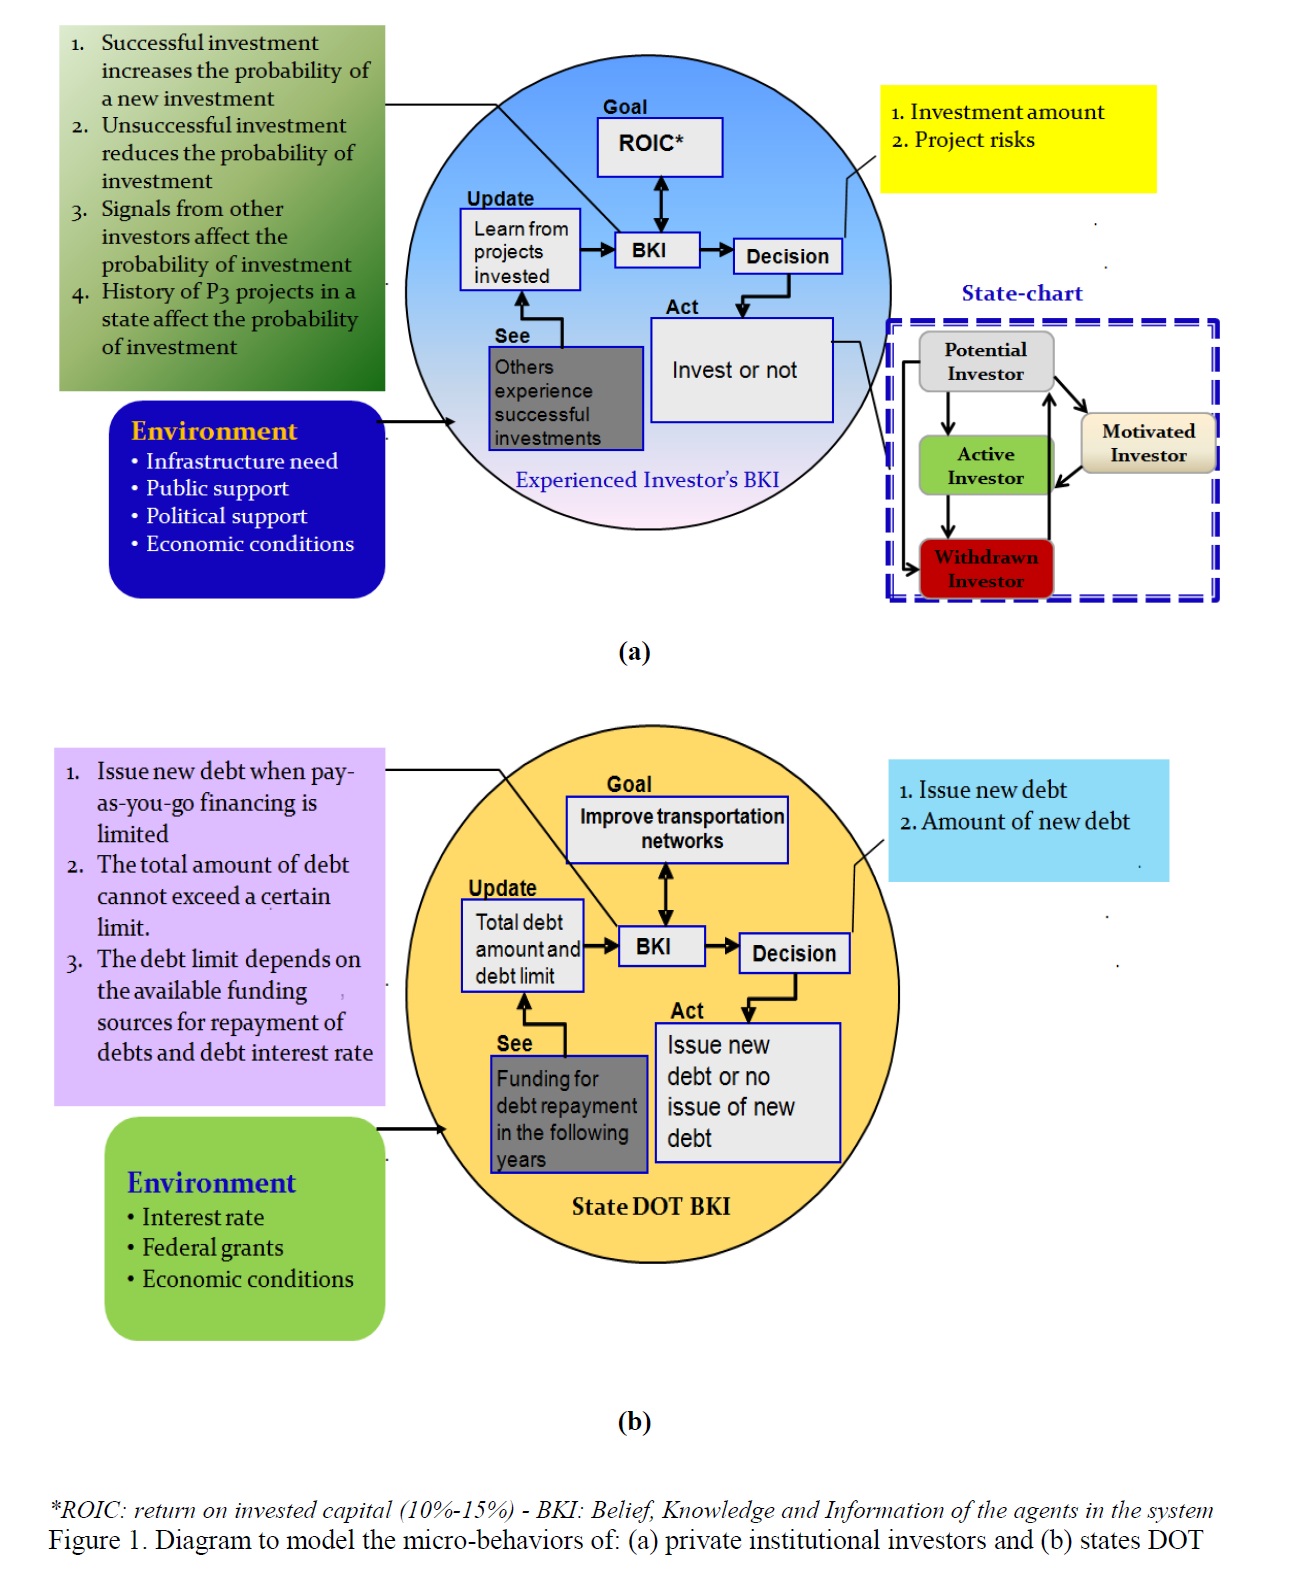
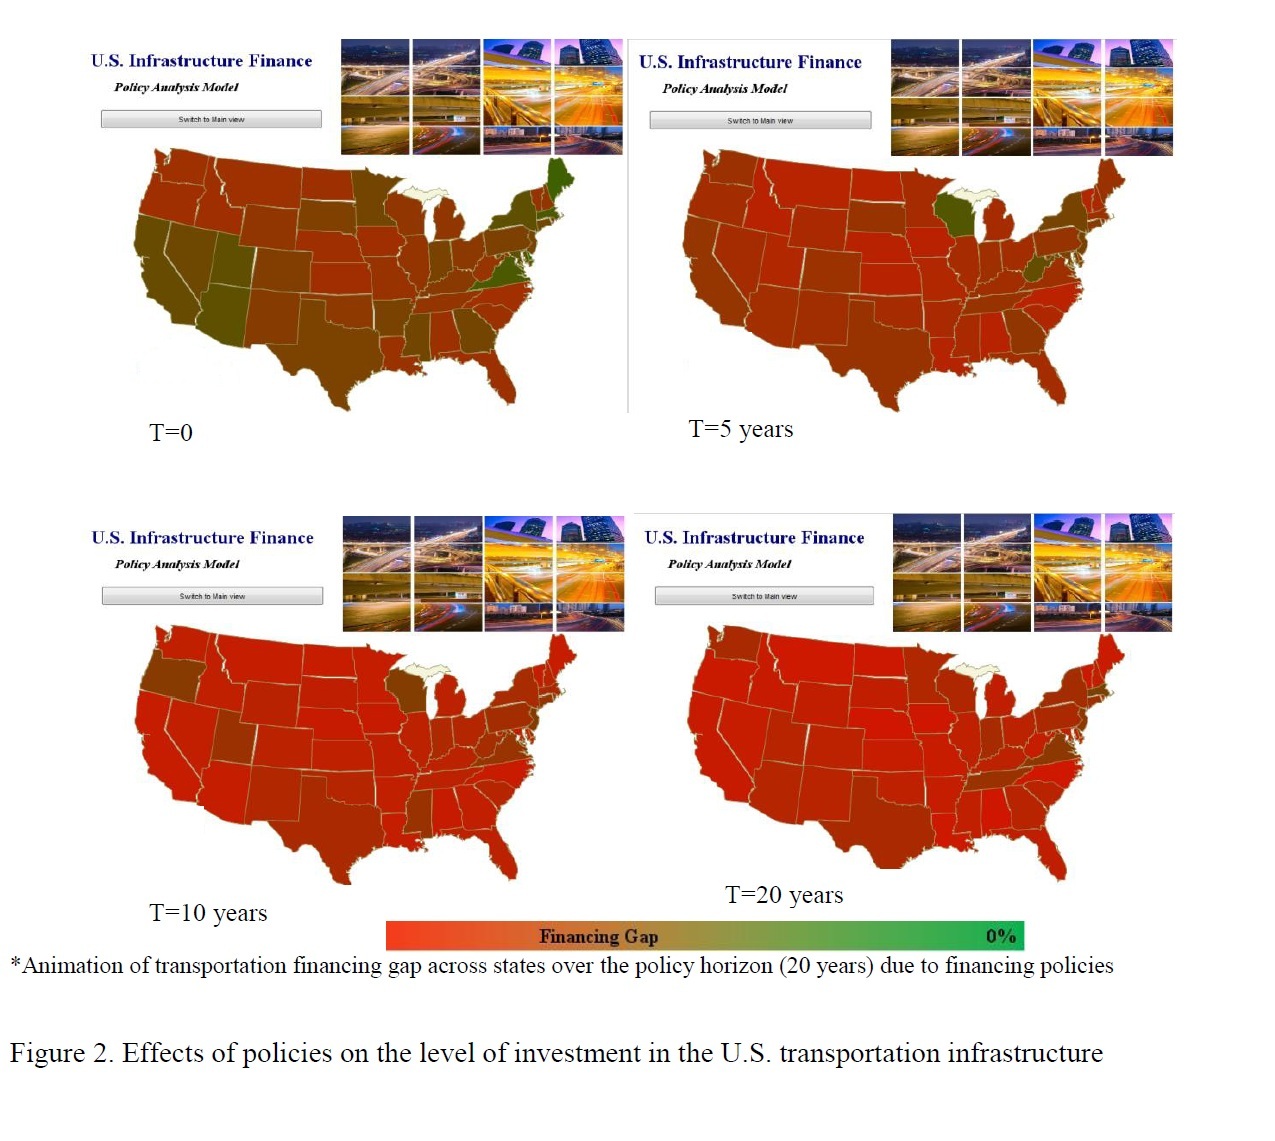
Background and Objective There are many factors that affect pay-as-you-go (PAYG) financing, private equity investment, debt financing, and funding of infrastructure. Policymakers often overestimate some of these factors and underestimate others. They also face known unknowns (policy outcomes whose nature is known but their probability of occurrence is unknown) as well as unknown unknowns (policy outcomes whose nature and probability of occurrence are unknown) in the analysis of infrastructure financing policies. The objective of this simulation and visualization model is to facilitate a systemic assessment of infrastructure financing policies based on the abstraction and micro-simulation of the major players, activities, and interactions in the system to assist the policymaking process. Simulation Model and Data A hybrid Agent-based/System Dynamics model was created to explore and visualize the effects of different factors (e.g., the probability of successful investment, the financing capacity of public agencies, and the effectiveness of public support) on the level of investment in transportation infrastructure. The model captures the complex micro-dynamics of transportation (highways and bridges) infrastructure investment in the U.S. by simulating the micro-behaviors of state Departments of Transportation (DOTs), private institutional investors, and the general public. Figure 1 shows the conceptual diagram that was used to model the micro-behaviors of the private investors and state DOTs in the model. For the creation of the policy analysis model, two sets of data were used. Set 1 included the identification of the activities and institutions of different players in the infrastructure financing system, which was abstracted from the interviews with 15 experienced subject matter experts in the area of infrastructure financing. Set 2 included data regarding the current financing needs, the level of public and private investment, and the level of funding for investment on highways and bridges. The data include the current debt level of the state DOTs; the level of funding for debt repayment by state DOTs; the level of need for highways, roads, and bridges in the states; and the existence and background of implementing public private partnerships in the states. The second set of data was obtained from the U.S. Department of Transportation (USDOT), the Federal Highway Administration (FHWA) and the American Association for State Highway and Transportation Organizations (AASHTO). The policy analysis model includes an animation component which helps in visualizing the effects of policies on the level of investment in U.S. infrastructure. Figure 2 shows the animation component for the policy analysis model created for policy assessment of transportation infrastructure (highways and bridges) in the U.S. As shown in Figure 2, the model provides a base for visualizing the effects of policies over a policy horizon. For instance, the figure demonstrates the effects of a policy that includes a 3% annual reduction in debt funding, an 8% annual reduction in pay-as-you-go financing capacity, and a reduction in the size of the U.S. transportation private public partnership (P3) market over a 20-year policy horizon in each state. This distinctive approach is the first of its kind to simulate the policy outcomes of the U.S. transportation infrastructure by simulating the micro-dynamics of the system.
INFRASTRUCTURE FINANCING POLICY SIMULATION AND VISUALIZATION MODEL
Updates

Leave feedback in the comments!
Log in or sign up for Devpost to join the conversation.