-
-
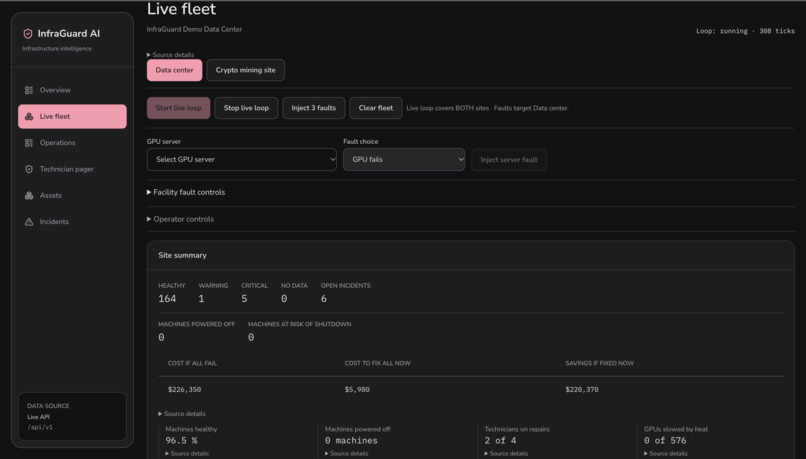
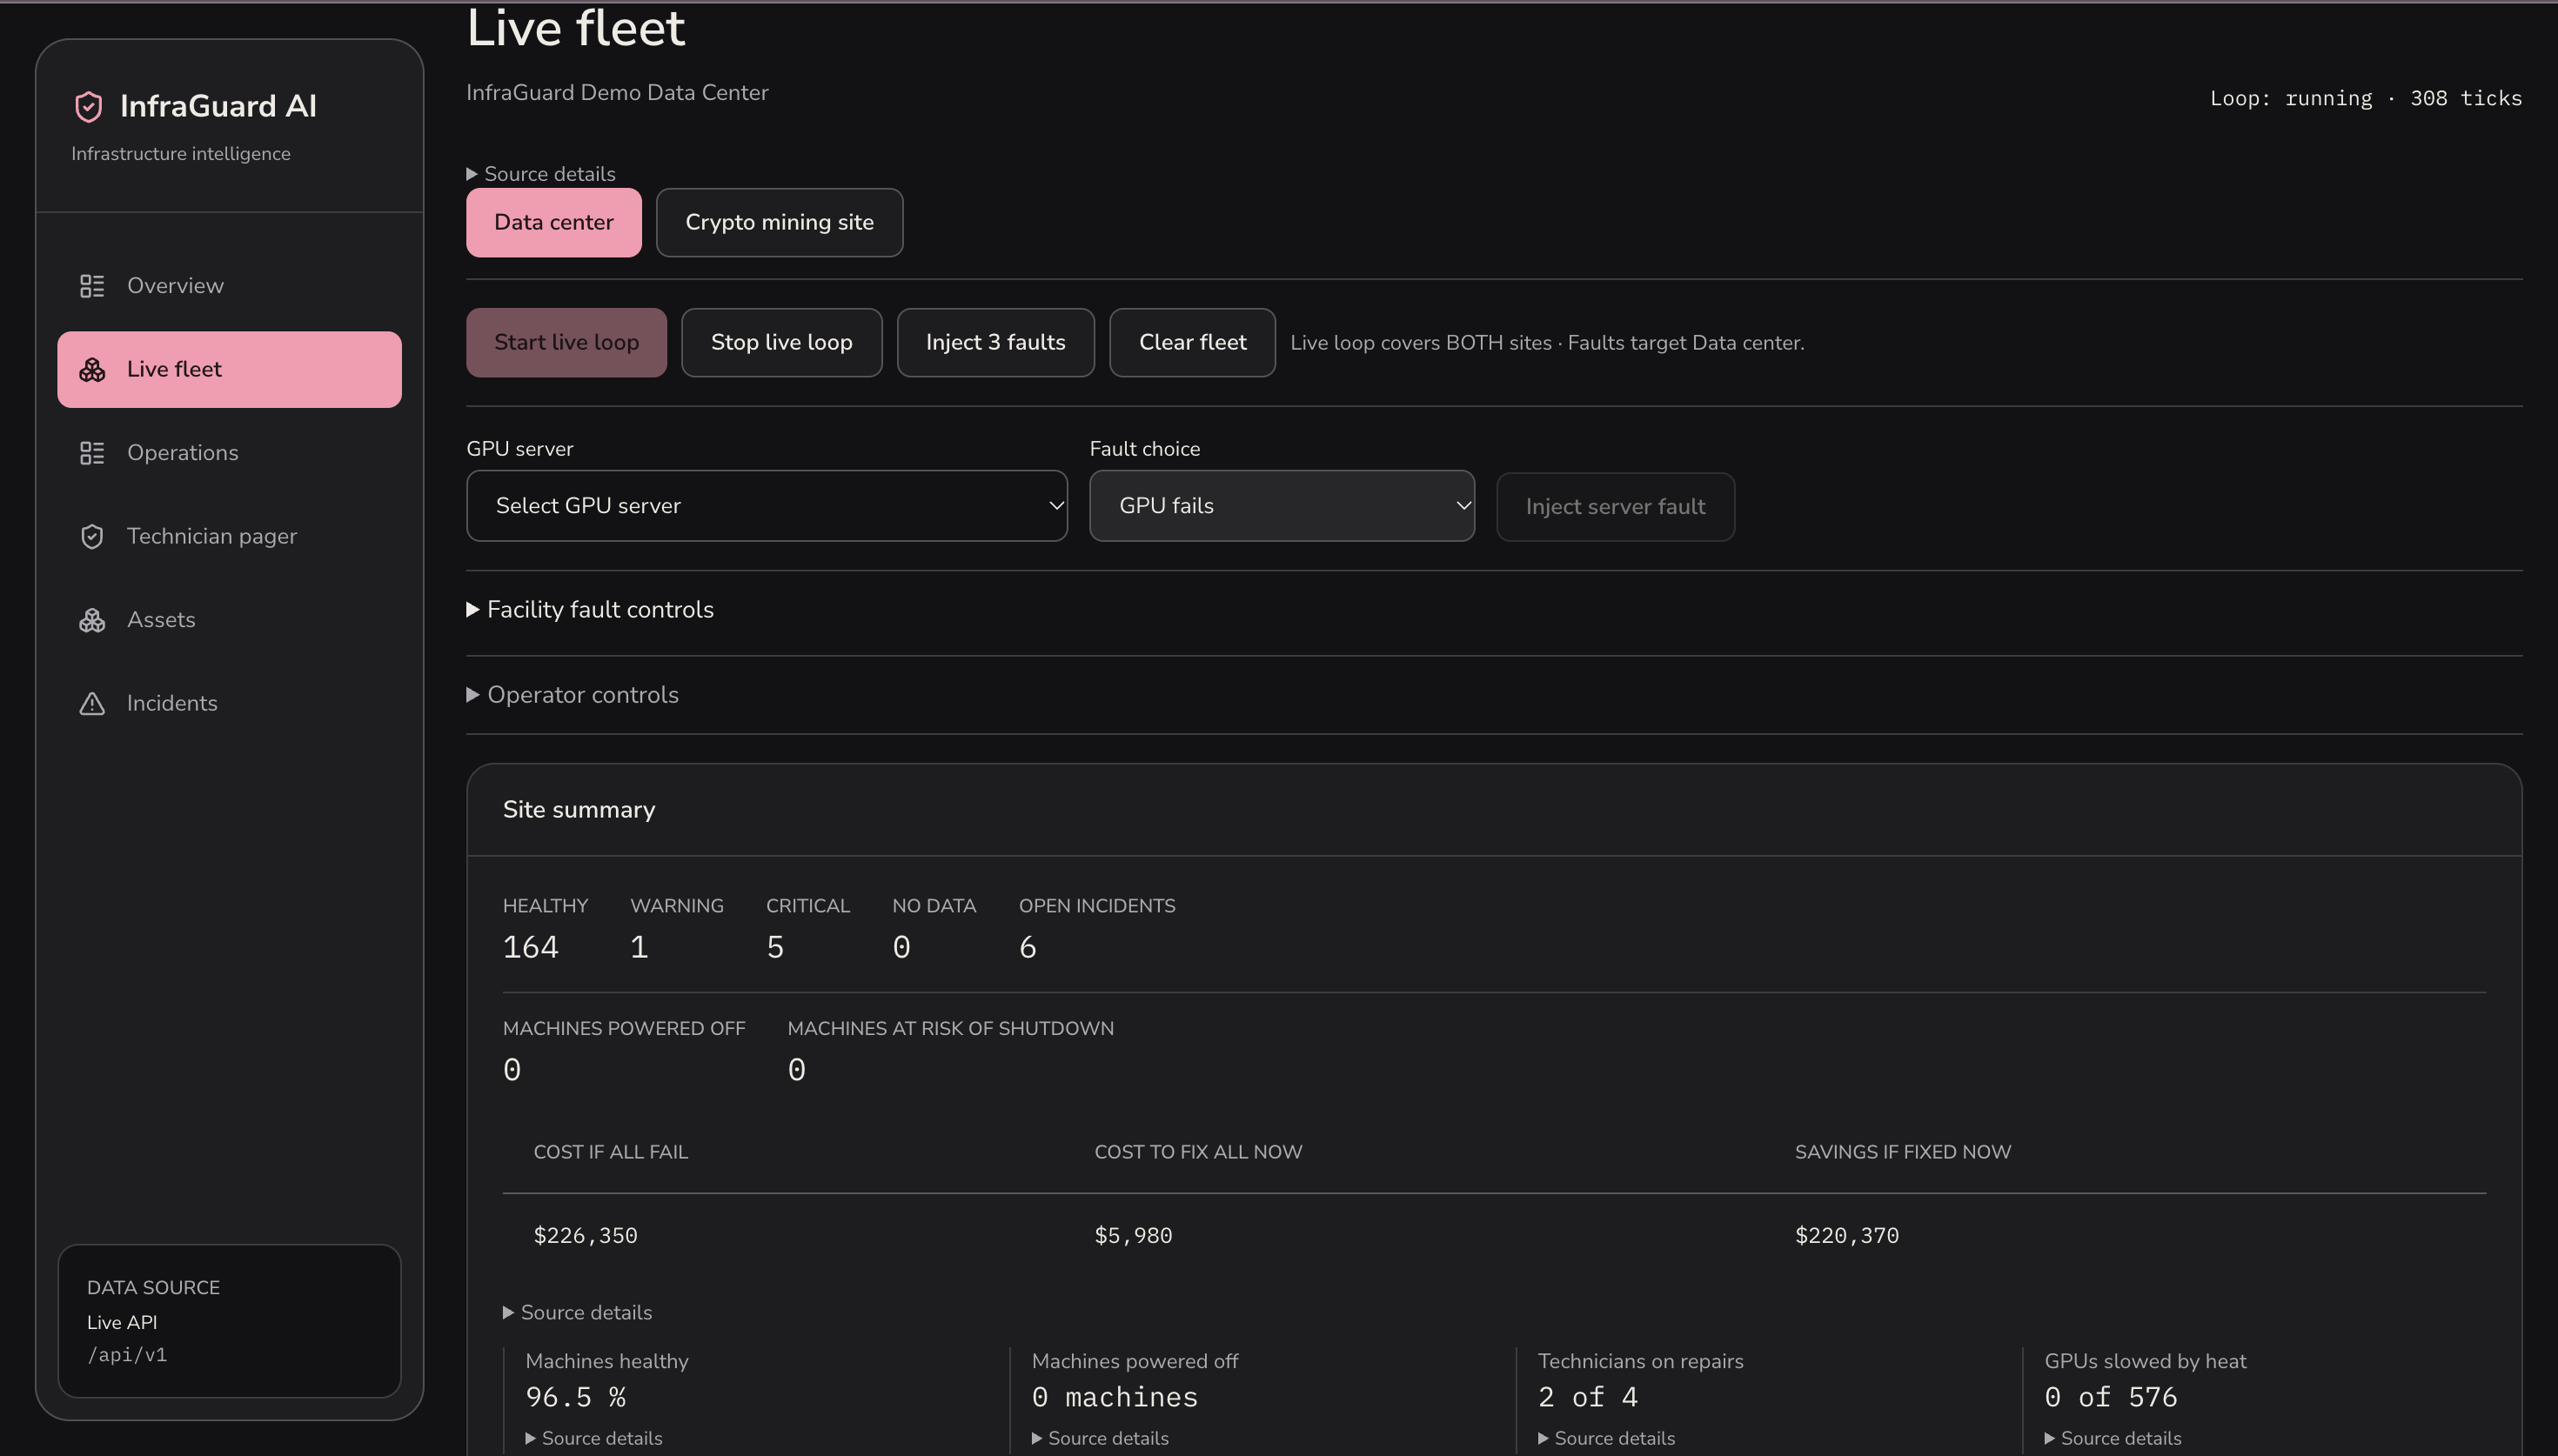
Live fleet: Live facility health and downtime costs
-
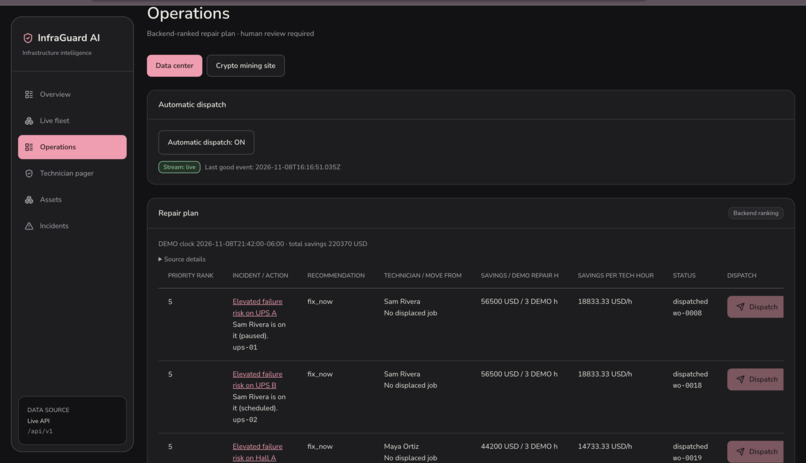
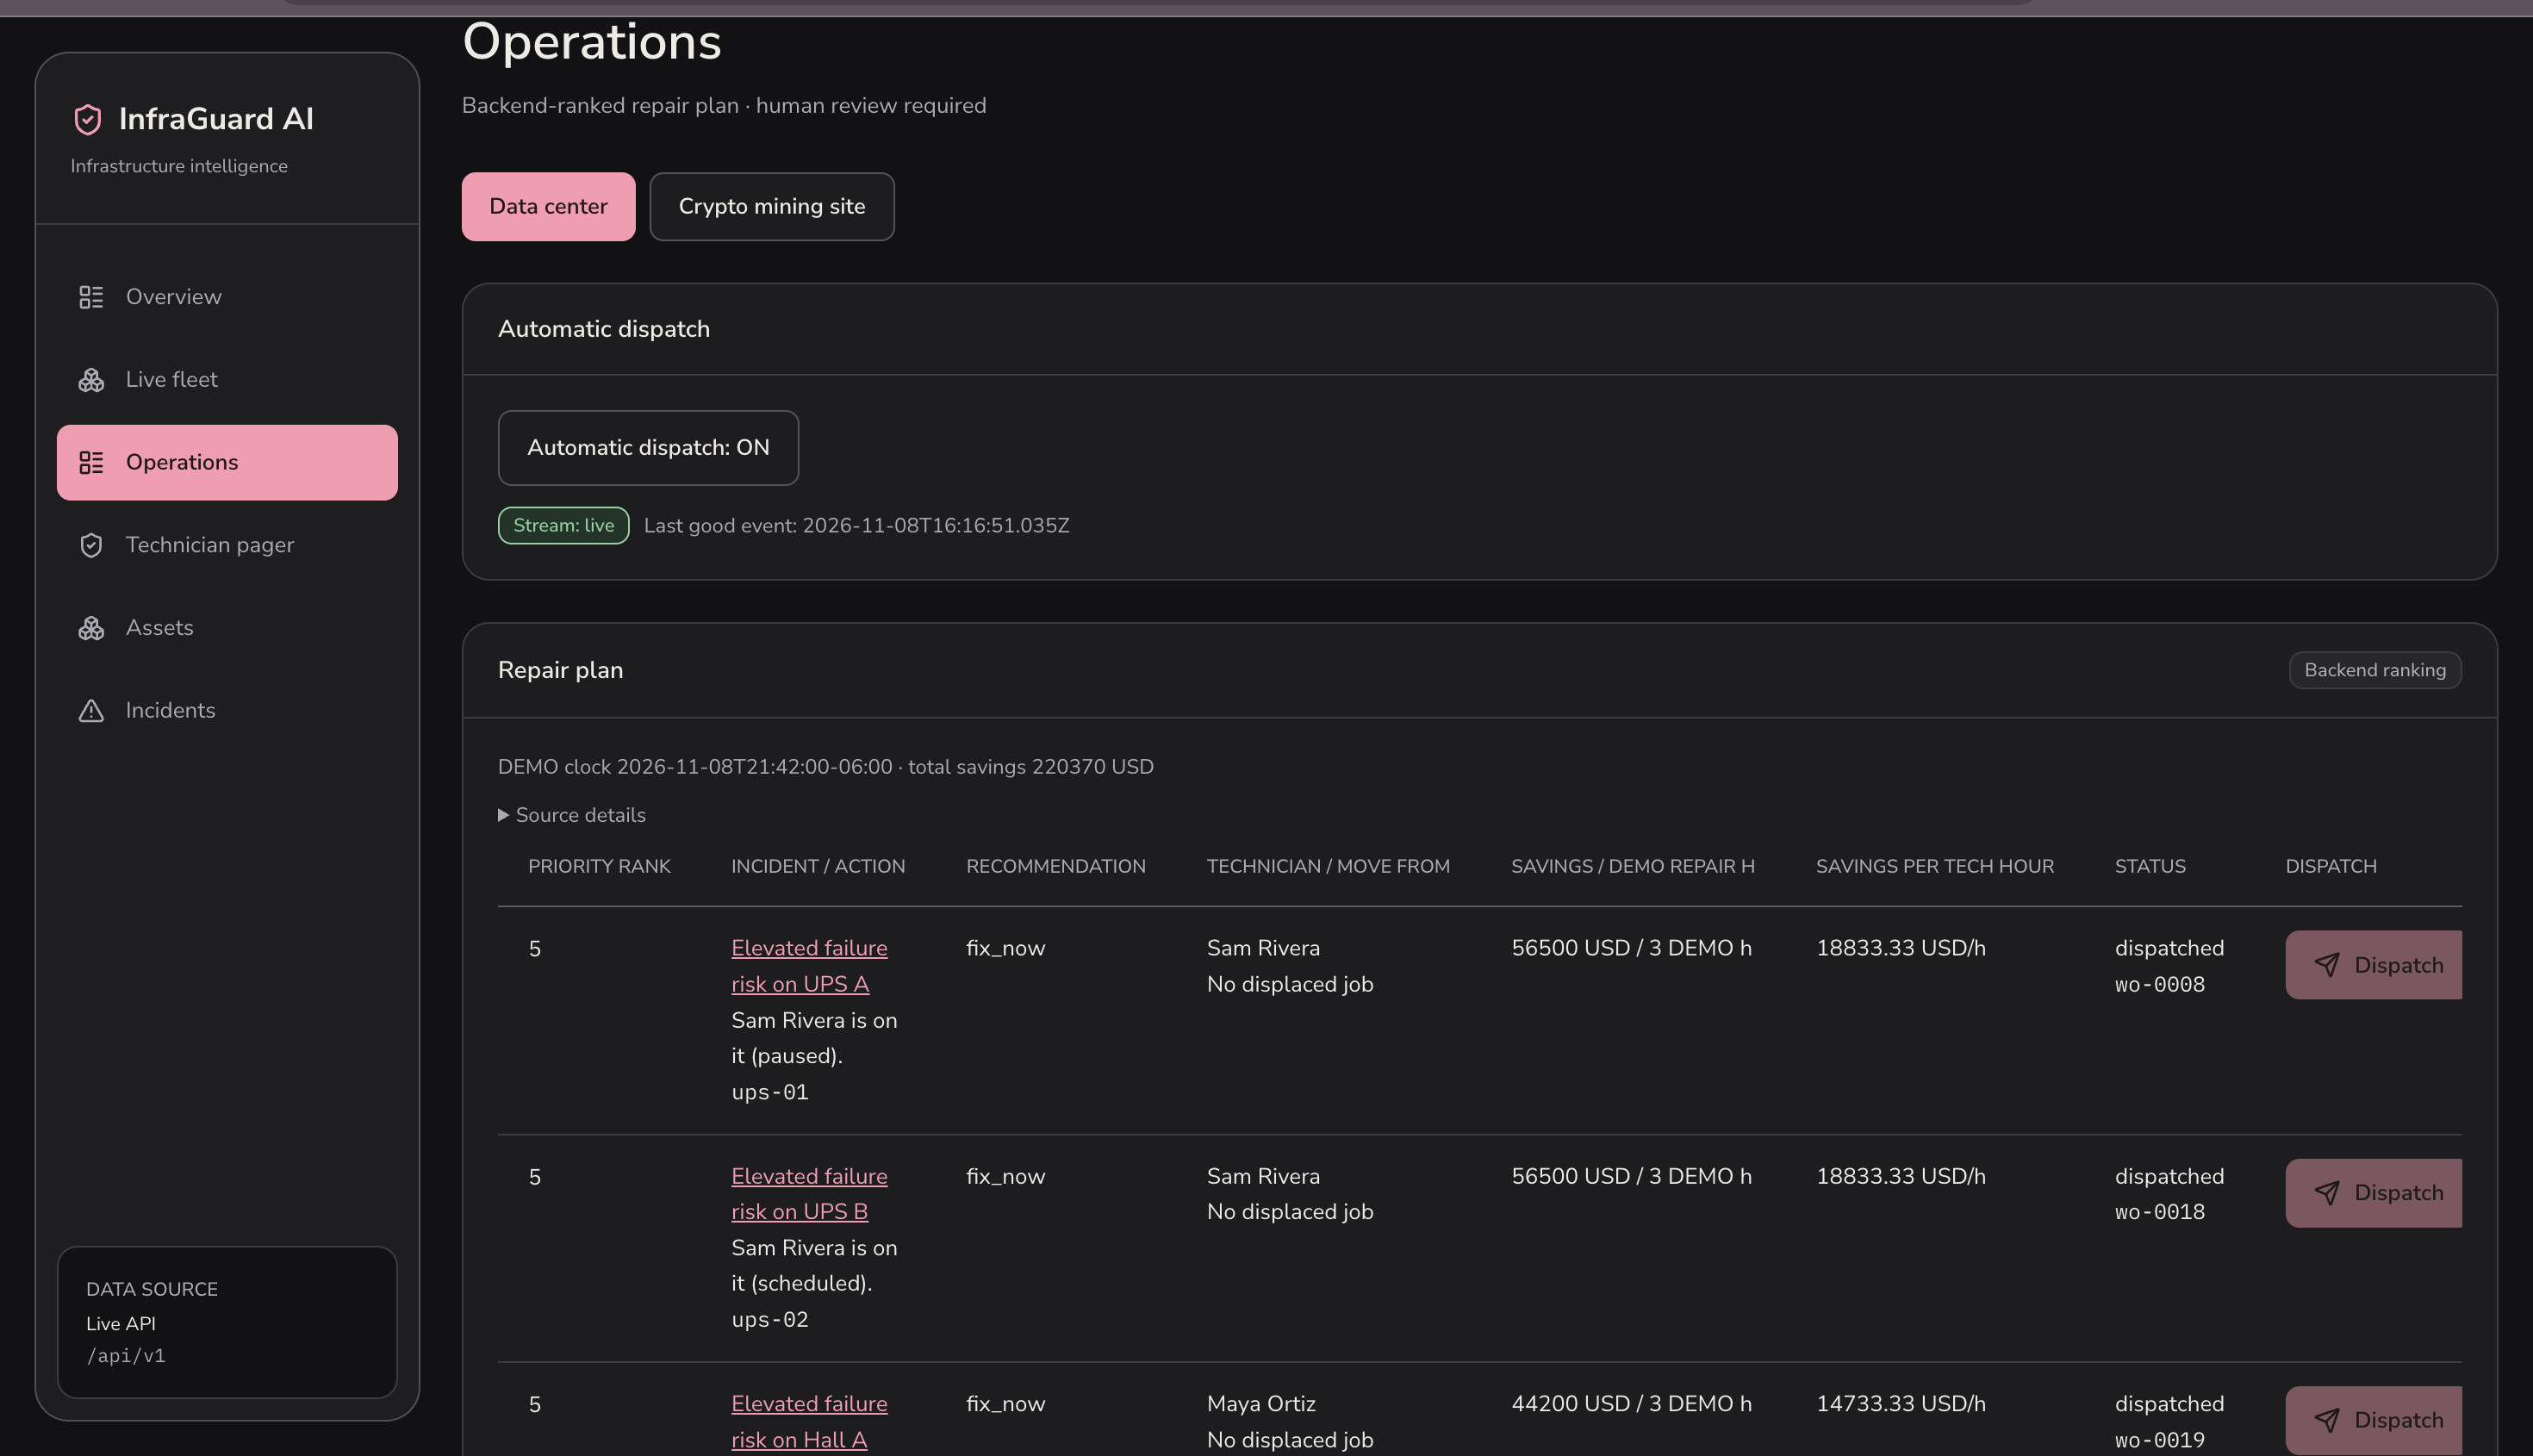
Operations: Repair plan ranked by savings
-
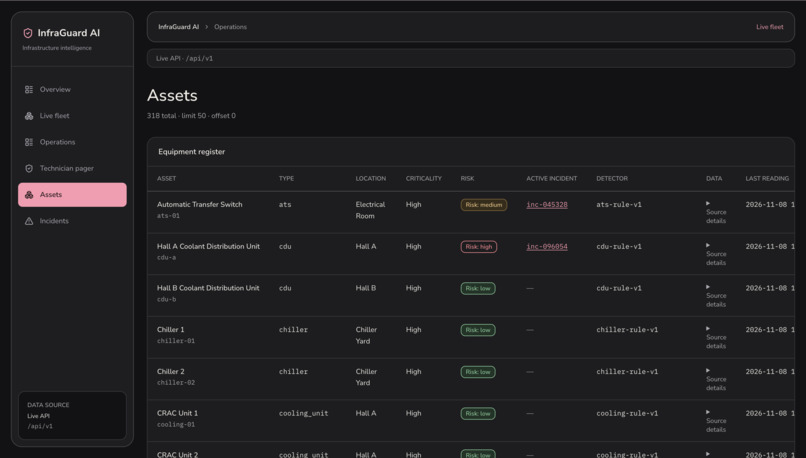
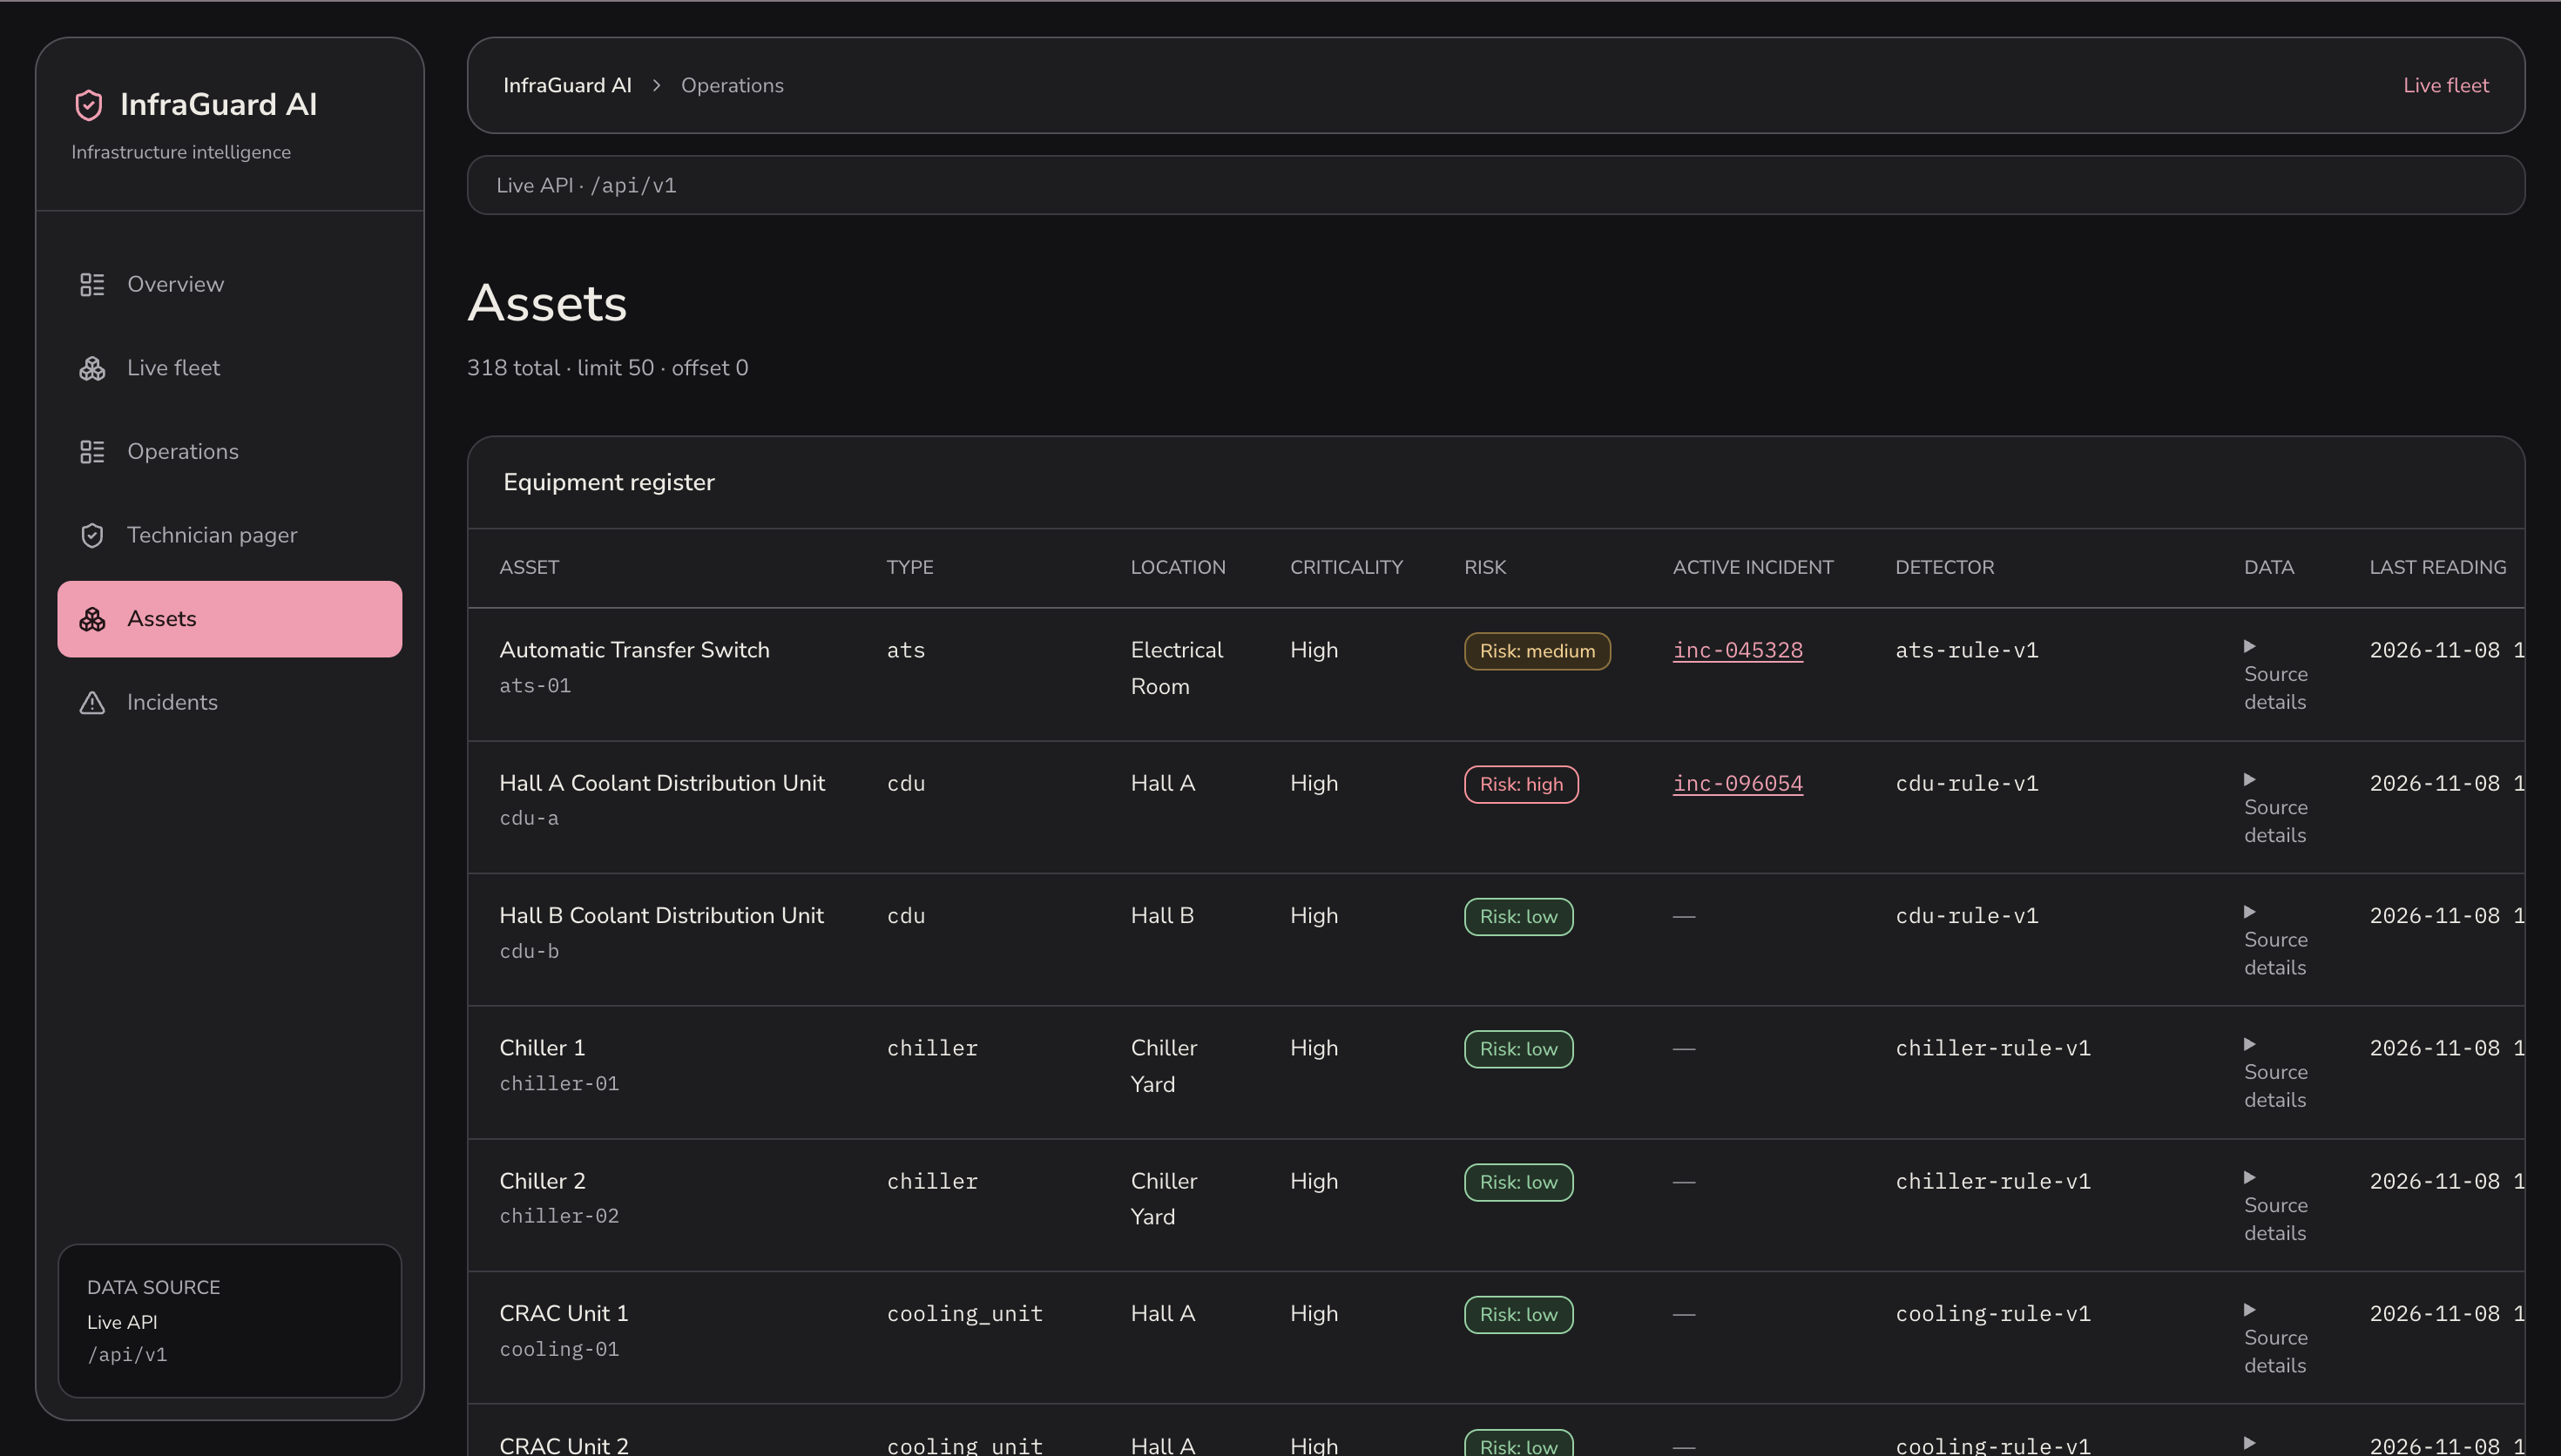
Assets: Every asset’s risk at a glance
-
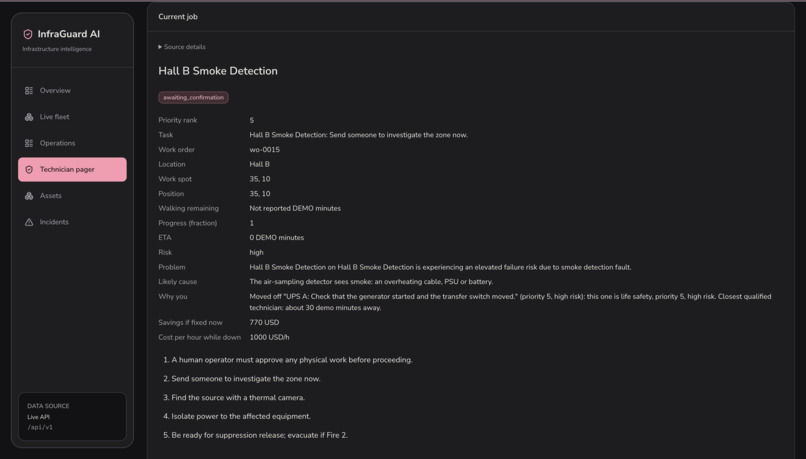
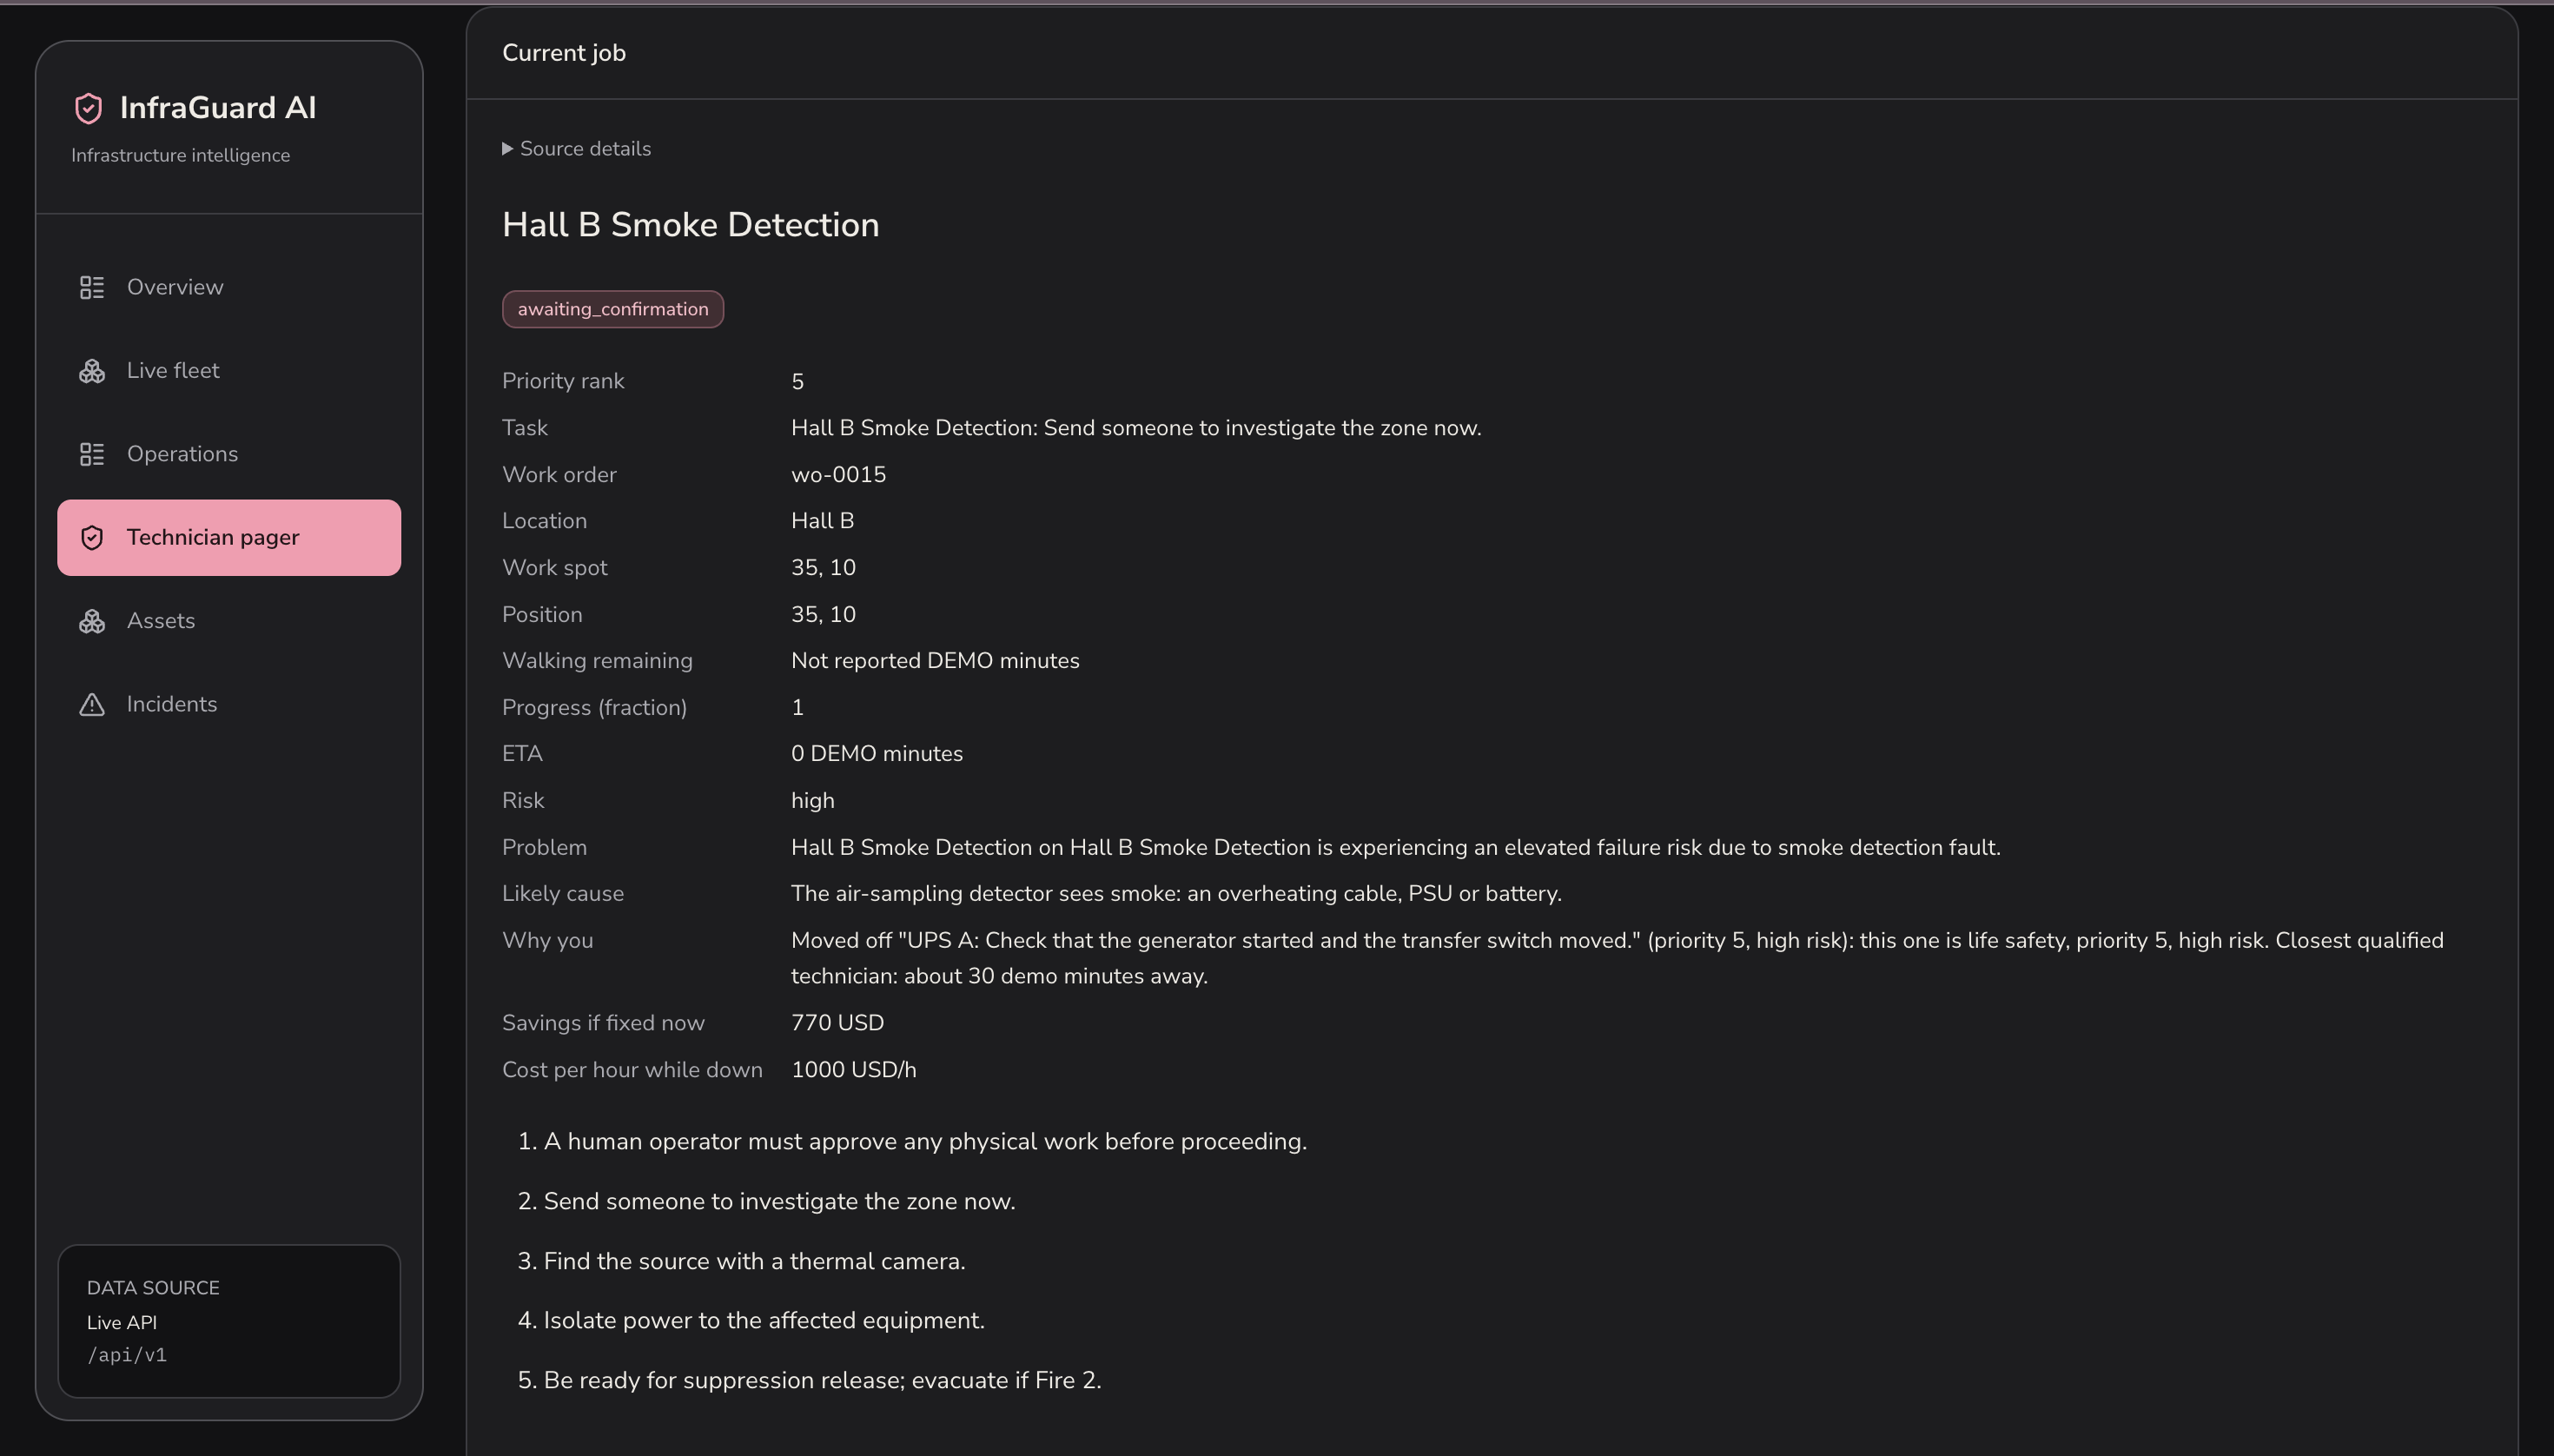
Technician pager: Technician’s job with repair steps
-
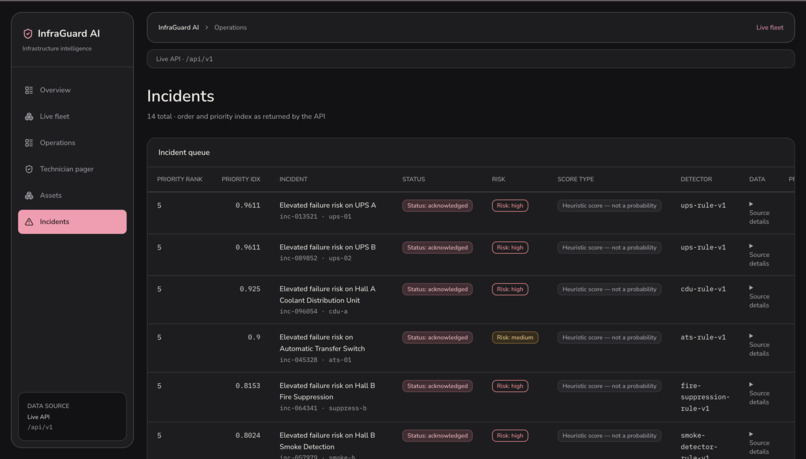
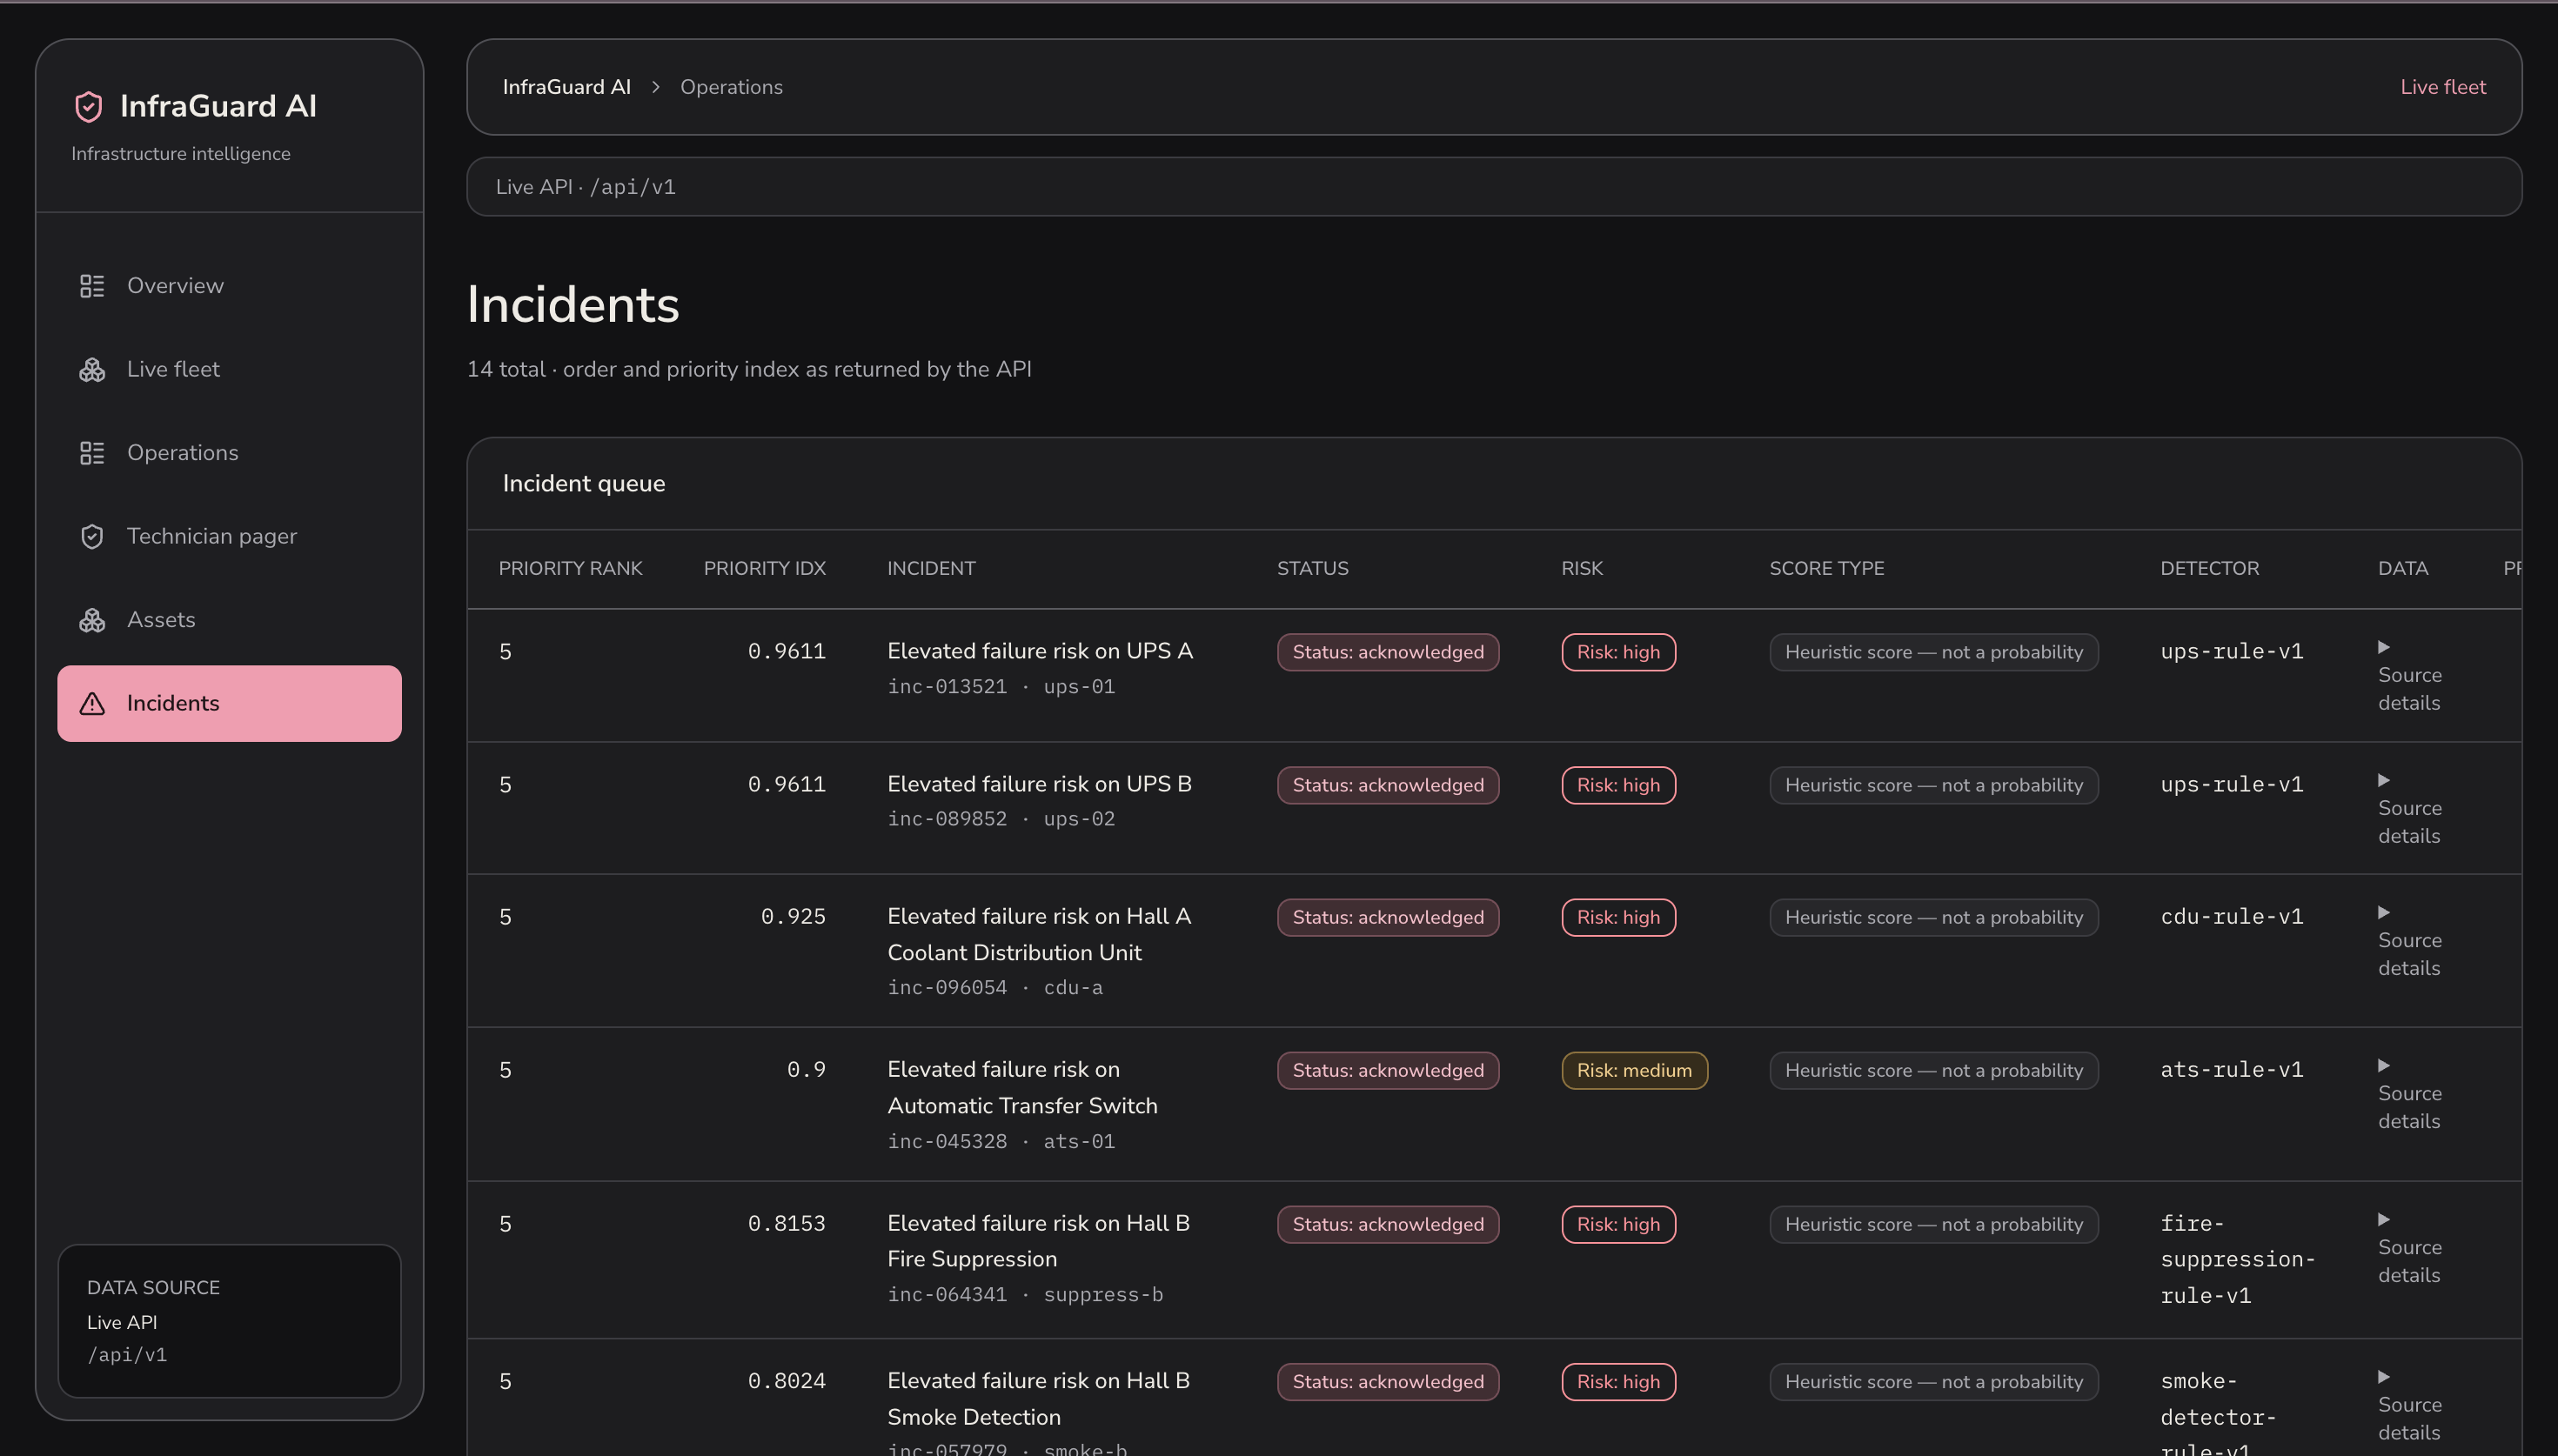
Incidents: Incidents ranked by priority level
Inspiration
Data centers run on a few technicians and thousands of alerts. Monitoring tools are good at saying something is wrong, but the hard questions are left to people: which failure is costing the most right now, what's the fix, and who should go? With GPU downtime this expensive, we wanted a system that answers those questions automatically, turning a wall of alerts into a clear, ordered plan.
What it does
InfraGuard AI watches every machine in a data center, predicts failures, puts a dollar value on each one, and sends the right technician in the right order.
- Whole-facility monitoring: GPU servers down to each part (GPUs, memory, power supplies, network cards, fans, drives), plus UPS, generators, transfer switches, chillers, cooling units, power strips, network switches, smoke detection and fire suppression. That's 170 machines and 300+ assets, plus a second site, a crypto mining farm.
- Two kinds of detection: engineering rules catch known failures, and anomaly models (one Isolation Forest per equipment family) catch the ones nobody wrote a rule for.
- Grounded explanations: an AI agent retrieves past maintenance records and writes the likely cause and step-by-step repair playbook. Physical work always needs human approval.
- A price on every incident: cost per hour while down and savings if fixed now. It compares fixing now, waiting for the cheap maintenance window, or buying time by shifting load, and recommends the cheapest.
- Smart dispatch: the closest qualified technician is sent, counting real walking time, including the trip to the parts cabinet. Jobs auto-accept on the technician's pager.
- Priority levels 1–5 (5 = most urgent): levels only go up, and fire and smoke come first. A more urgent job takes over the current one, and the old job goes back in the queue, so nothing is lost.
- Learning: every finished repair is recorded and shared with every site that has the same equipment.
- Chaos mode: random failures across the whole building, so you can watch the crew reorganize itself live.
How we built it
- Backend: Python + FastAPI + Pydantic, with a live loop that ticks the whole facility every second and streams updates to the UI with server-sent events.
- Frontend: React 19 + TypeScript + Vite + Tailwind, with TanStack Query and Recharts for the live floor maps, incident views and technician pager.
- ML: scikit-learn. A gradient-boosting model on UCI AI4I (F1 0.78, ROC-AUC 0.98 on held-out test data), a drive-failure model on Backblaze data (ROC-AUC 0.83), and per-family Isolation Forests for facility anomalies.
- AI agent: Gemini or Vultr Serverless Inference over retrieved maintenance records, with a deterministic fallback so it never goes blank.
- Simulator: a Python simulator that generates realistic readings and faults for every asset type.
- Deploy: Docker on Railway at infraguard.health.
We're a team of two, each working with a coding agent. The agents coordinated through a pinned GitHub issue used as a message board: they tagged each other when an API contract changed or a handoff was ready. We agreed on the JSON contract and fixtures first, so the frontend and backend could be built in parallel.
Challenges we ran into
- Speed of the anomaly models: scikit-learn's per-call overhead (about 2.3 ms per reading) slowed the live loop roughly 10x. We rewrote the scoring as a plain Python tree walk, which brought it down to about 0.03 ms per reading.
- Signals that never move: many healthy readings are constant, so the Isolation Forest missed faults on them. We added training jitter plus a healthy-range check.
- Realistic dispatch: at first, one far-away parts store made every repair late. We switched to per-hall parts cabinets and route each technician through the closest one.
- Priority that behaves like real operations: getting takeover right without losing jobs or auto-closing work took several iterations.
- LLM rate limits: we added multiple keys, fallback models, and a deterministic, retrieval-based explanation so the demo never breaks.
Accomplishments that we're proud of
- A full end-to-end loop running live: detect → explain → price → dispatch → repair → learn.
- It covers the whole facility, not just servers, down to individual server parts.
- Model results are measured on held-out test data, with model cards, not made-up accuracy claims.
- It's deployed and public at infraguard.health.
- Two people plus their coding agents shipped 100+ PRs through a shared message board.
What we learned
- Operators don't need more alerts. They need a decision: what it costs, what to do, and who goes.
- Agreeing on the API contract first is what let two people build in parallel without stepping on each other.
- Fast, simple models (and simple code to score them) beat heavier ones in a live system.
- Honest metrics, like PR-AUC against a no-skill baseline, tell you far more than accuracy does.
What's next for InfraGuard AI
- Connect to real equipment through SNMP, Redfish/IPMI and building-management systems instead of simulated readings.
- Train the anomaly models on real fleet data, and add more equipment families.
- A mobile pager app for technicians, with photos and parts scanning.
- Integrations with work-order and inventory systems such as ServiceNow, so the plan reaches the tools teams already use.
- Use the learned repair history to predict parts needs and plan staffing ahead of time.
Built With
- caddy
- docker
- fastapi
- gemini
- numpy
- pandas
- pydantic
- pytest
- python
- railway
- react
- recharts
- scikit-learn
- tailwindcss
- tanstack-query
- typescript
- uvicorn
- vite
- vitest
- vultr
