-
-
InfoExchange: these Stocks have deep, dark secrets, uncover them with this handy dandy dashboard tool
-
-

InfoExchange
You're an intern on the trading team at your firm. It's your first day and you get assigned to analyze only 4 minutes worth of trading data provided by the stock exchange computers.
So, only 4 minutes? how hard can that be?
Well... To give you an idea, there are over 2000 transaction logs done by a typical firm (e.g. National Bank) per minute, and that is only a fraction of everything that might happen on a typical day. So, without the analytics covered by the InfoExchange dashboard, this internship might be harder than you anticipated :,)
Inspired by National Bank Challenge At ConuHacksVIII.
What it does
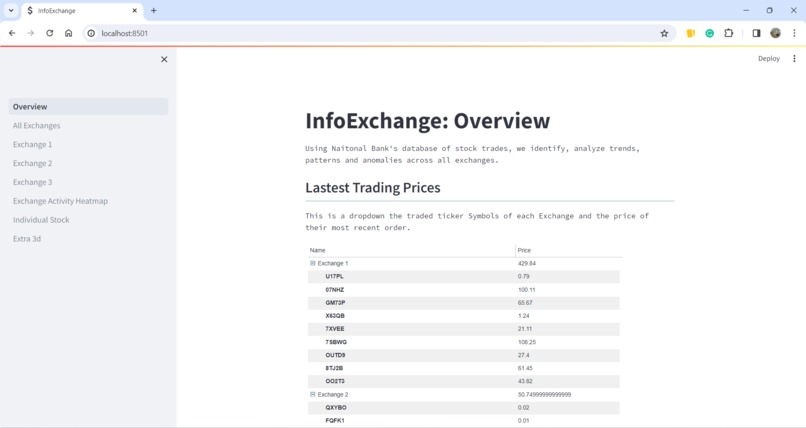
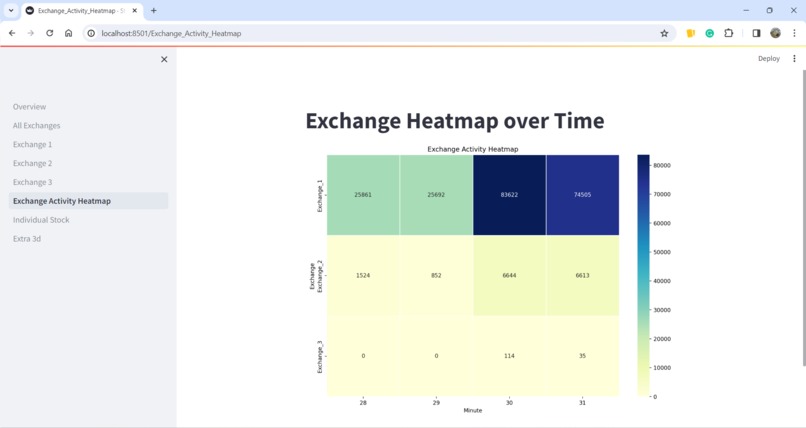
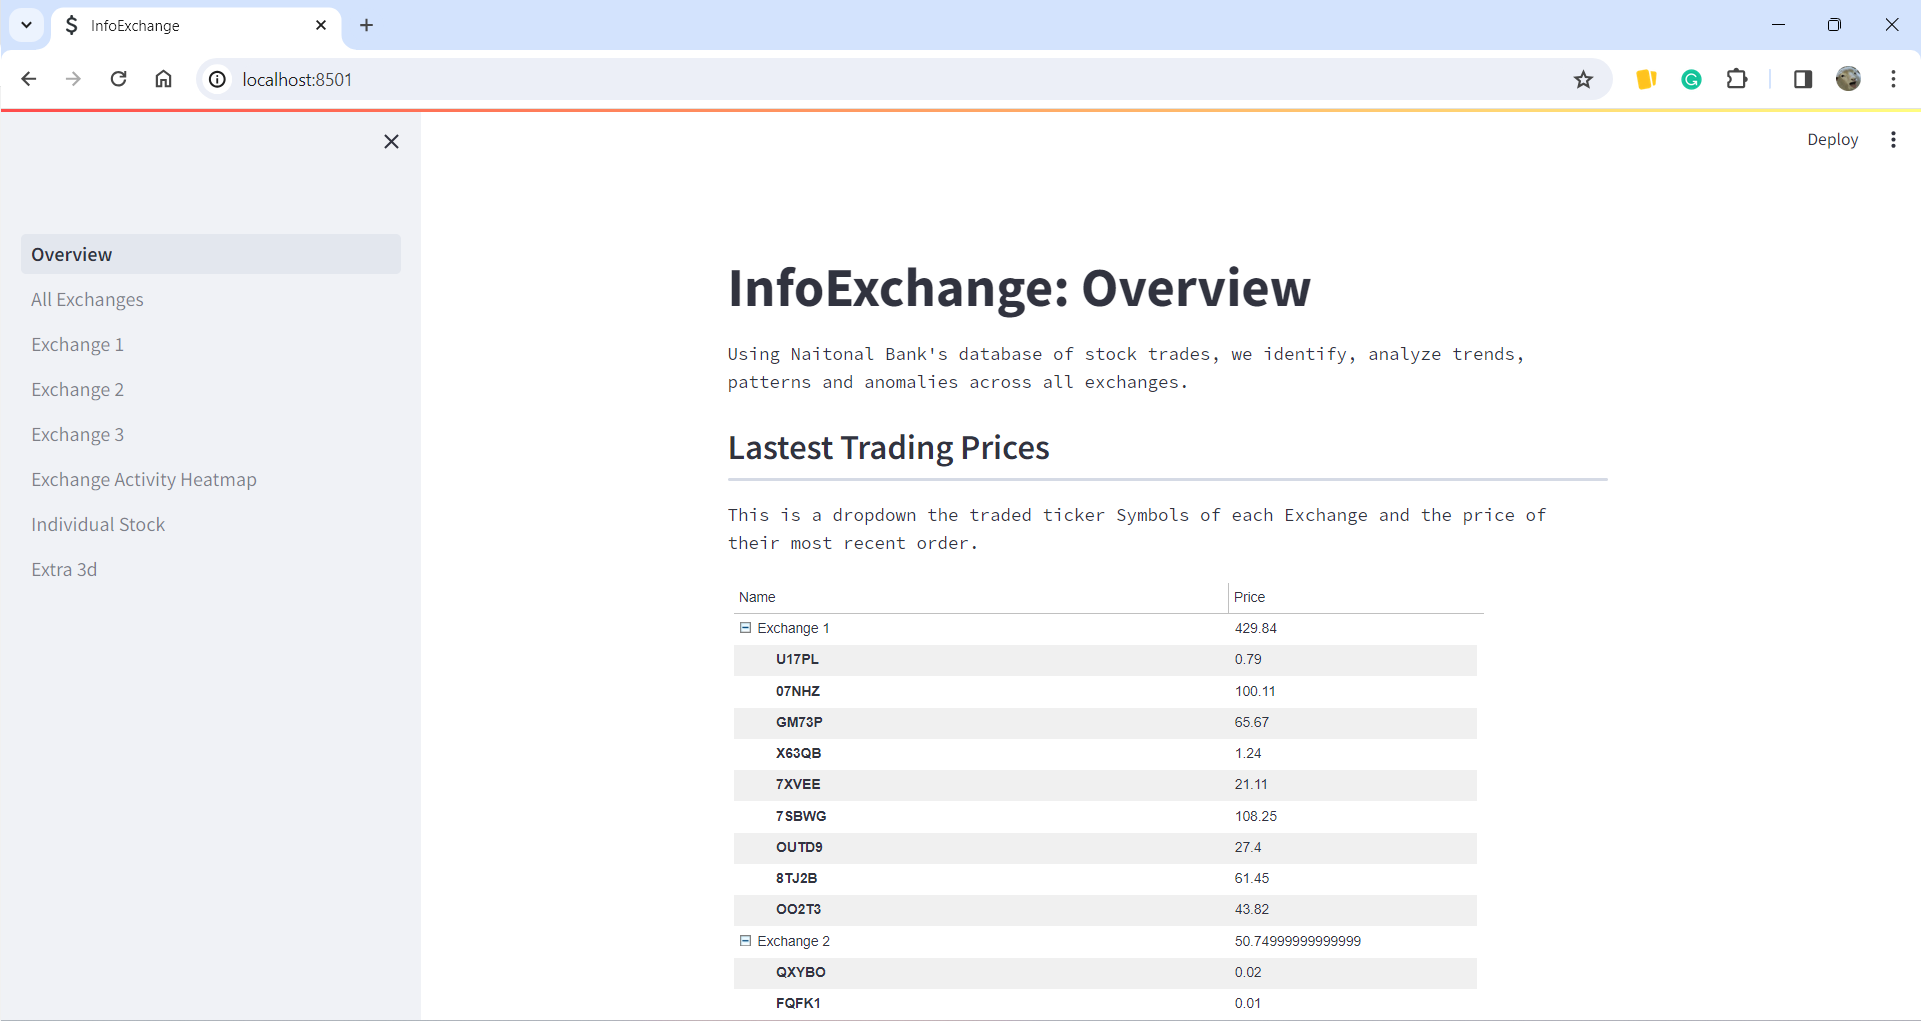
- Identify trends, anomalies and patterns across all trades done in Exchanges
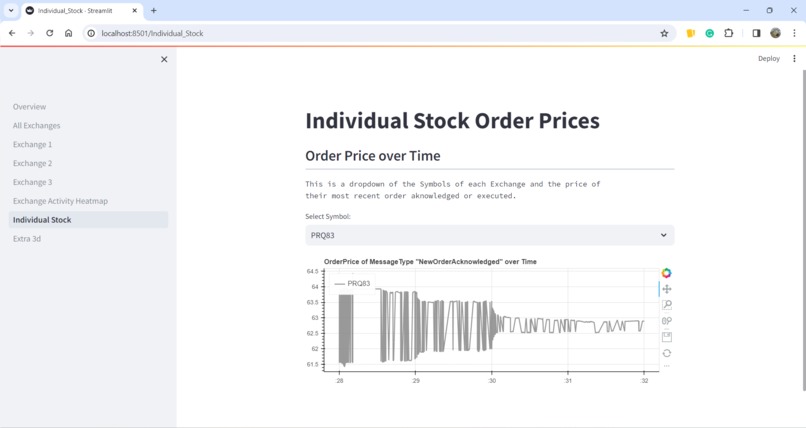
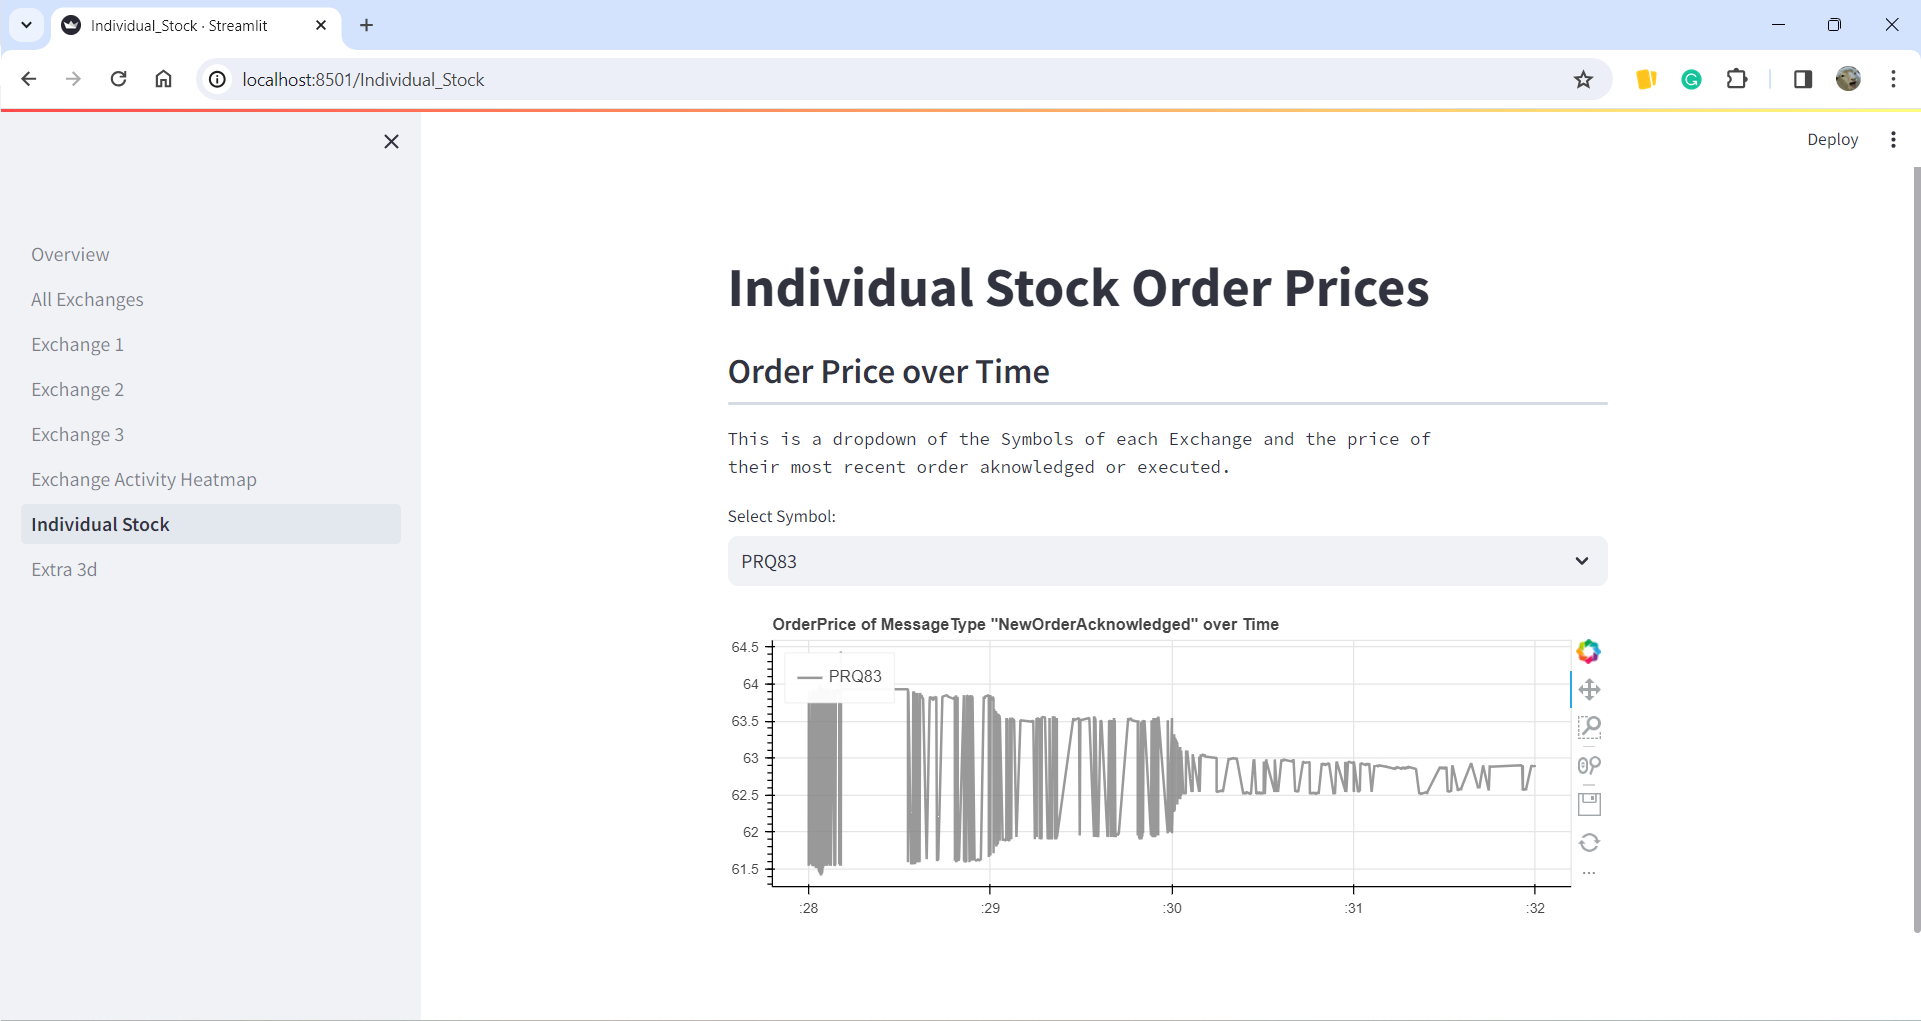
- Ability to expand, zoom in/out, drag, and dynamically interact with graphs
- Graphs about stock trading prices, offer prices and cancelation rate
- Functionality to save graphs as you interact with the trends and patterns
- Coded dynamically, any other data can be uploaded and displayed in the data dashboard
How we built it
Credit: Logo created by Vista
Python data libraries: python for json parsing, streamlit, and graphing libraries (plotly, seahorn, bokeh)
Data provided by National Bank of Canada
Challenges we ran into
A lot of transactions and logs! Was tough to narrow it down at first and thinking of ways to parse the data effectively was a challenge.
What we learned
Proud of learning python plotting tools and had good practice parsing through all the json data. Brushed up on my basic python skills.
What's next for InfoExchange
- AI-integeration to analyze the graphs and identify anomalies
- Add more variety of graphs that might be useful

Log in or sign up for Devpost to join the conversation.