-

This logo reflects our overarching mission of making environmental ("green") information accessible to the general public
-

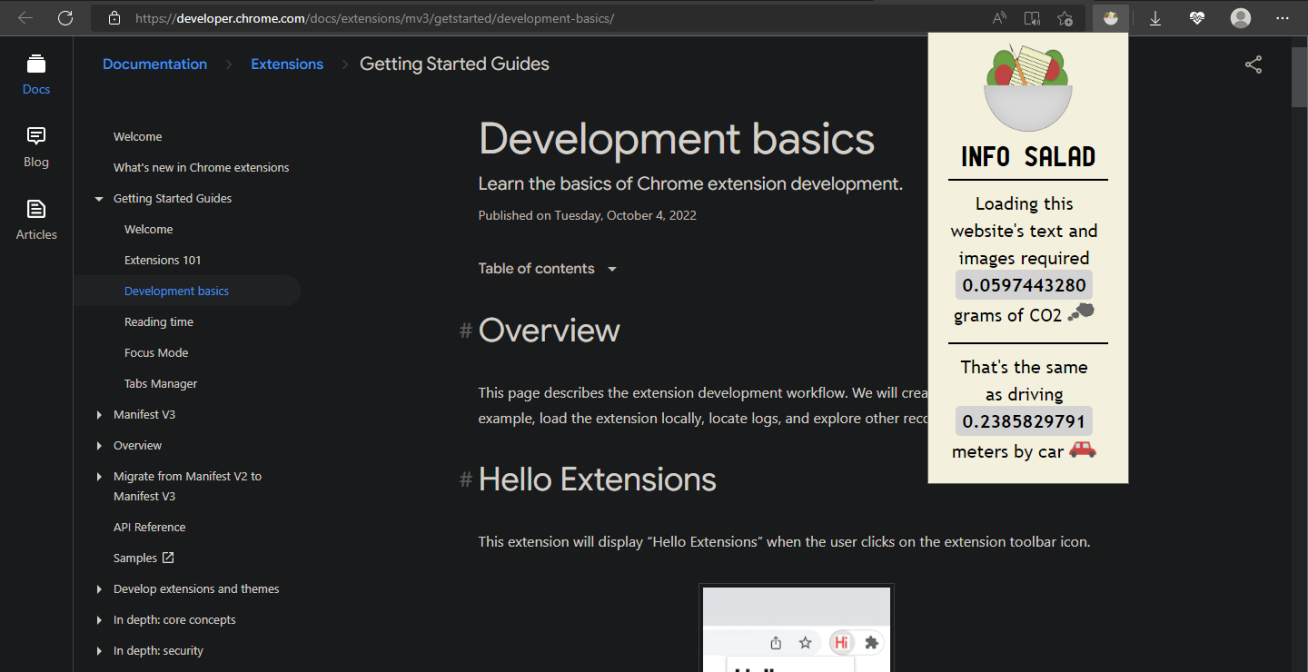
Our extension is readily available on any web page, presenting personal emissions data in a quick and intuitive way
Inspiration
People don't often consider the impacts of their internet use in the physical realm - it seems to us an abstract concept; the page just appears. But data must be transmitted somehow: as the Parametric Press article, "The Hidden Cost of Digital Consumption", states, "...your digital actions are only possible because of the physical infrastructure built to support them." We wanted to nail down more firmly the scale and breadth of this impact.
What it does
Following the goal to focus on broad introduction & impact rather than on exact numbers, we made our output simple, but still rooted in reality. The extension scrapes the text and images on the site and counts up the bytes, outputting it and its equivalence to meters driven in an average car. While this is a very rough estimate, and ignores compression of data in transmission, other data types on the page, and impact of location, it ultimately gives an introduction to what could very realistically be the impact of your page, which is what we were aiming for. Other sites of this nature exist, but they are convoluted, tailored towards producers of websites rather than towards informing the consumers, and/or paid.
How we built it
We based our project in Google Extensions with the goal of having something ever-present but not intruding - simple and concise, easy to access, appealing to view. The initial plan was a Java backend with first a website display as a stepping-stone, then a Google Extensions display; but we quickly realized the extension would be easier to code from the get-go in Javascript then attempting to plug pieces from the Java end of the site together with React and later with Extensions. After choosing this basis, we were naturally inclined to use Javascript, plus other tools we ran into trying out - the final additional choices being Python with the Beautiful Soup library and Flask to integrate it in.
Challenges we ran into
We initially tried to use Chrome DevTools through extensions and Javascript add-ons to gather network data. After several unsuccessful approaches (JS Puppeteer, Chrome DevTools, Chrome debugger), we switched to a text- and image-only data scraping of sites to analyze data. This meant it was more complex to tie together the resulting modules than it would have been if done natively through our initial approaches. On the math side, the estimated energy and emission cost of producing a byte varied greatly across studies. We ultimately relied on a 2017 meta analysis of data from 2015. Ideally, we would have been able to access more recent data.
Accomplishments that we're proud of
We're proud of developing a fully-functioning prototype in a limited time period. Our project is technically ready to be deployed to the Chrome web store for user installation and widespread use, though refinements still remain. We're also proud of creating something that serves an unmet need - existing projects are generally inaccessible or overly complex for individual users.
What we learned
We learned to build full-stack Chrome extensions, using HTML/CSS/Javascript and Python frameworks. Everybody came in with a variety of backgrounds and experience levels, and working on this project was a fruitful learning experience for all of us. We also learned to manage our team, and to work effectively in a group with different skillsets.
What's next for Info Salad
Potential future goals include itemizing the data output (to show the cost of individual elements), getting data by intercepting page responses rather than loading it again, streamlining the interface and design, making a counter of session and/or lifetime bytes and emissions, and adding links to other easy to comprehend information and advocacy resources. We also see potential opportunities in for partnering with carbon offset programs - perhaps our extension could encourage awareness and donations.


Log in or sign up for Devpost to join the conversation.