-
Home
-
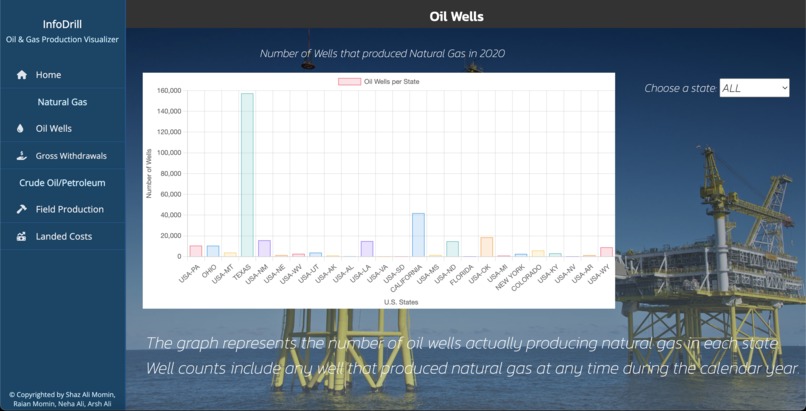
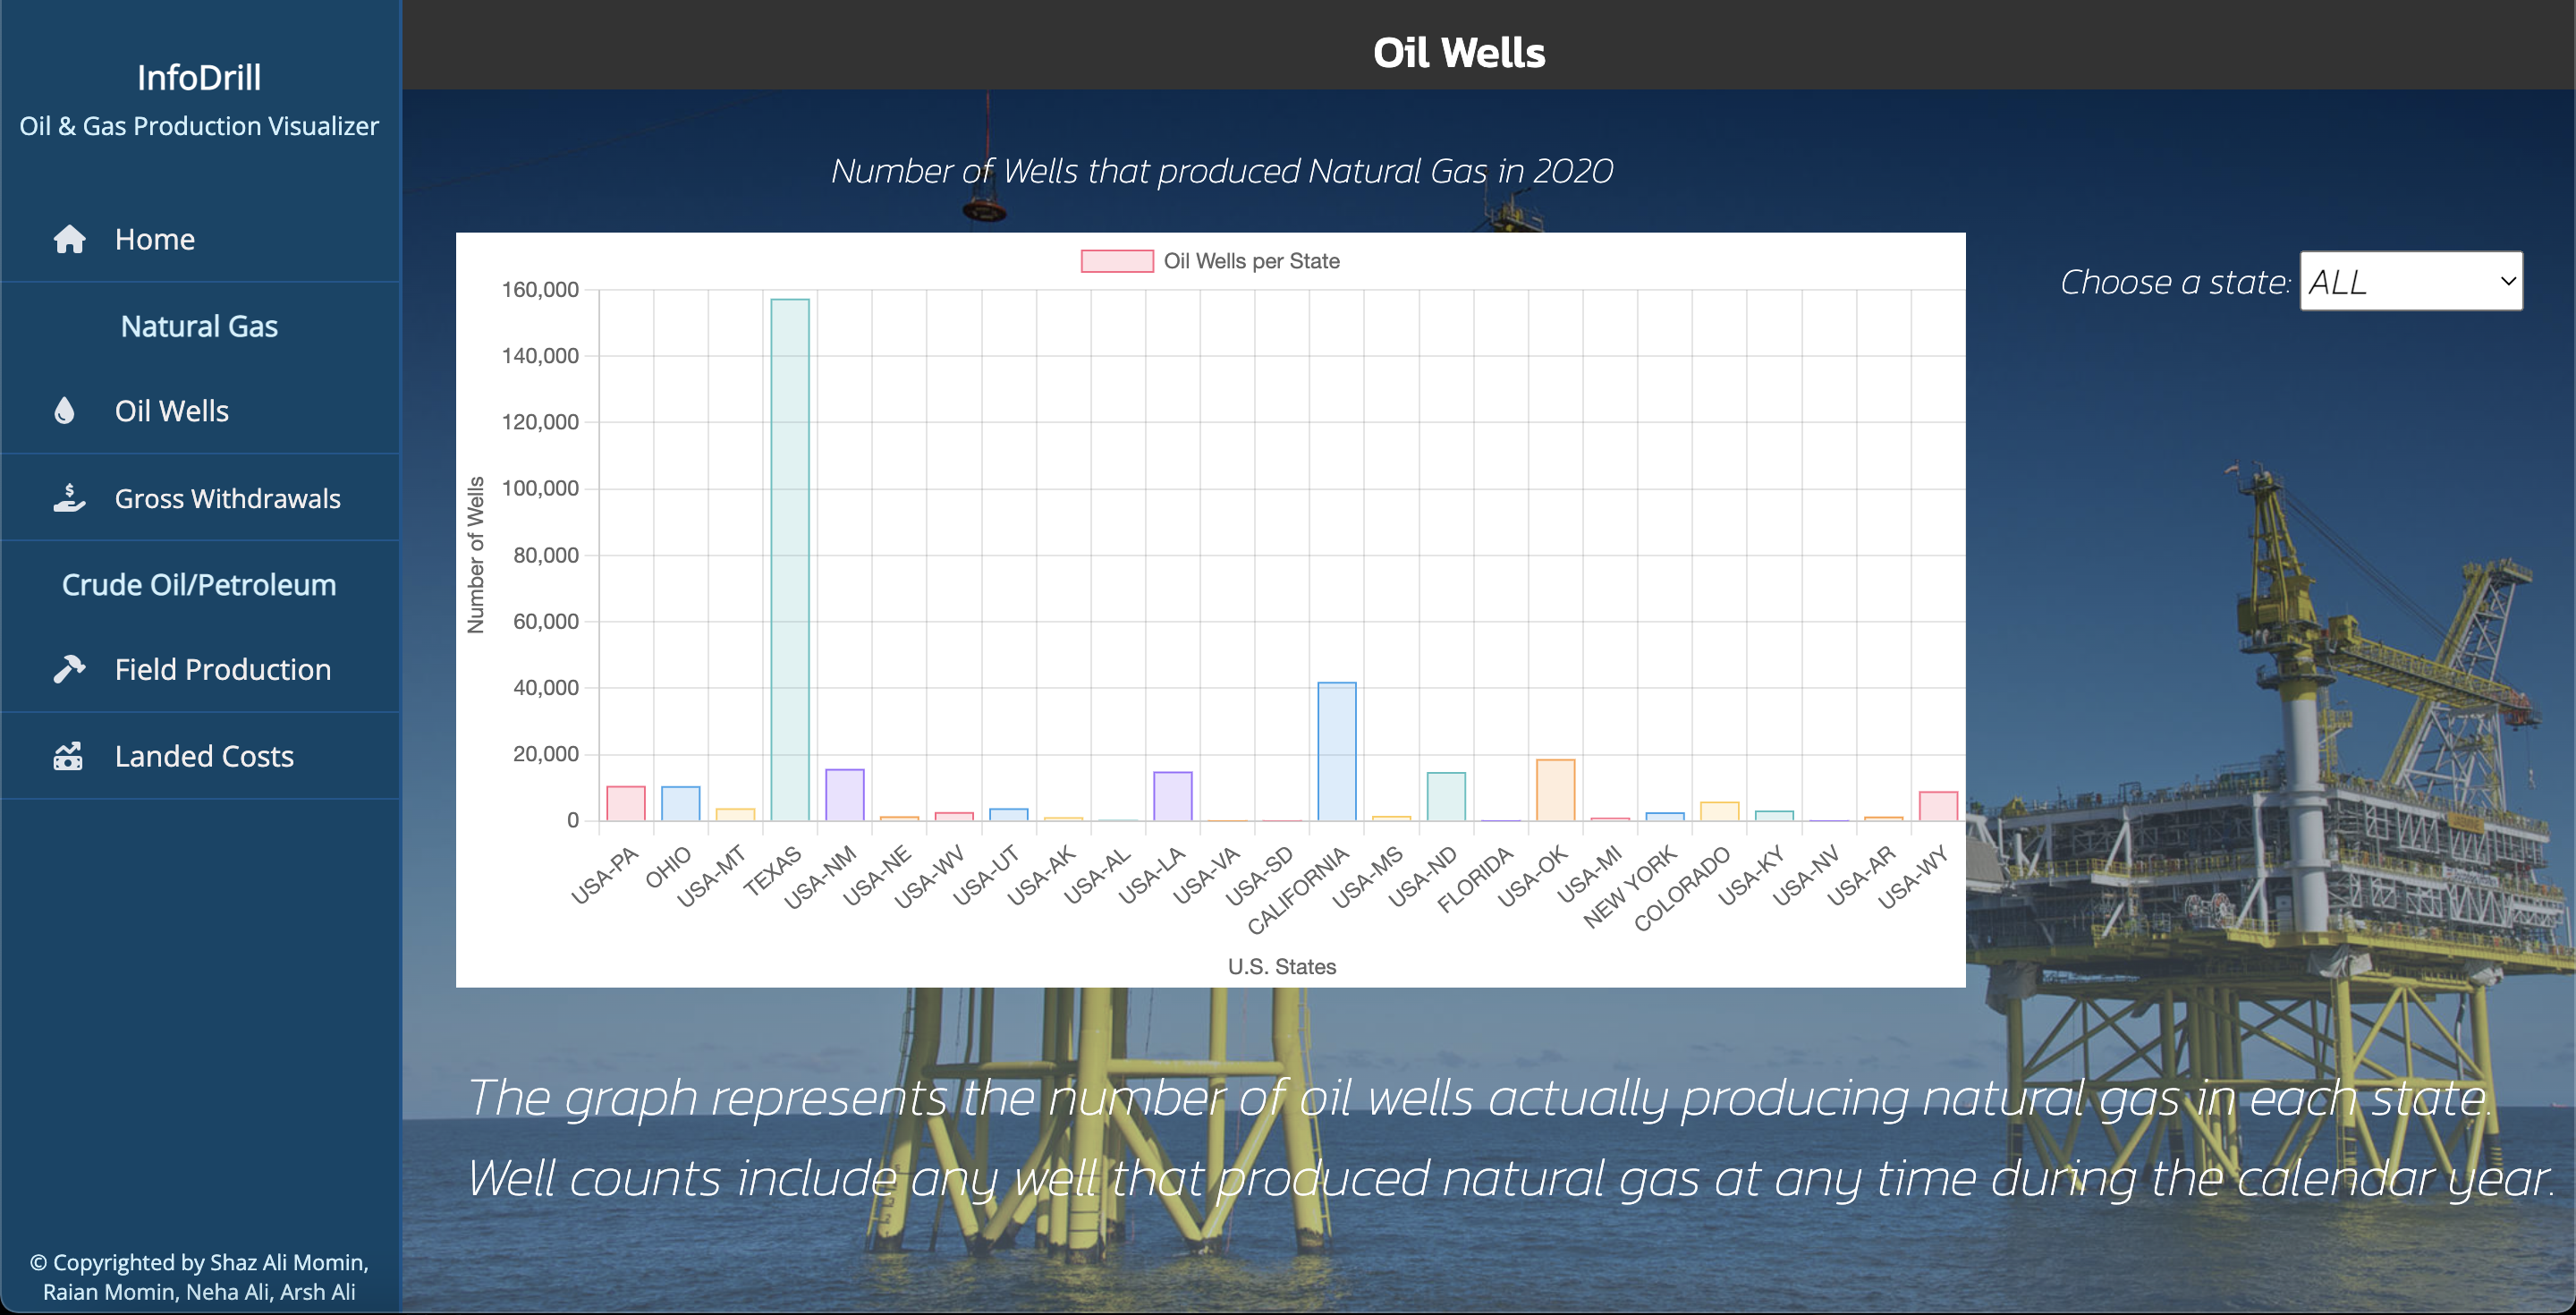
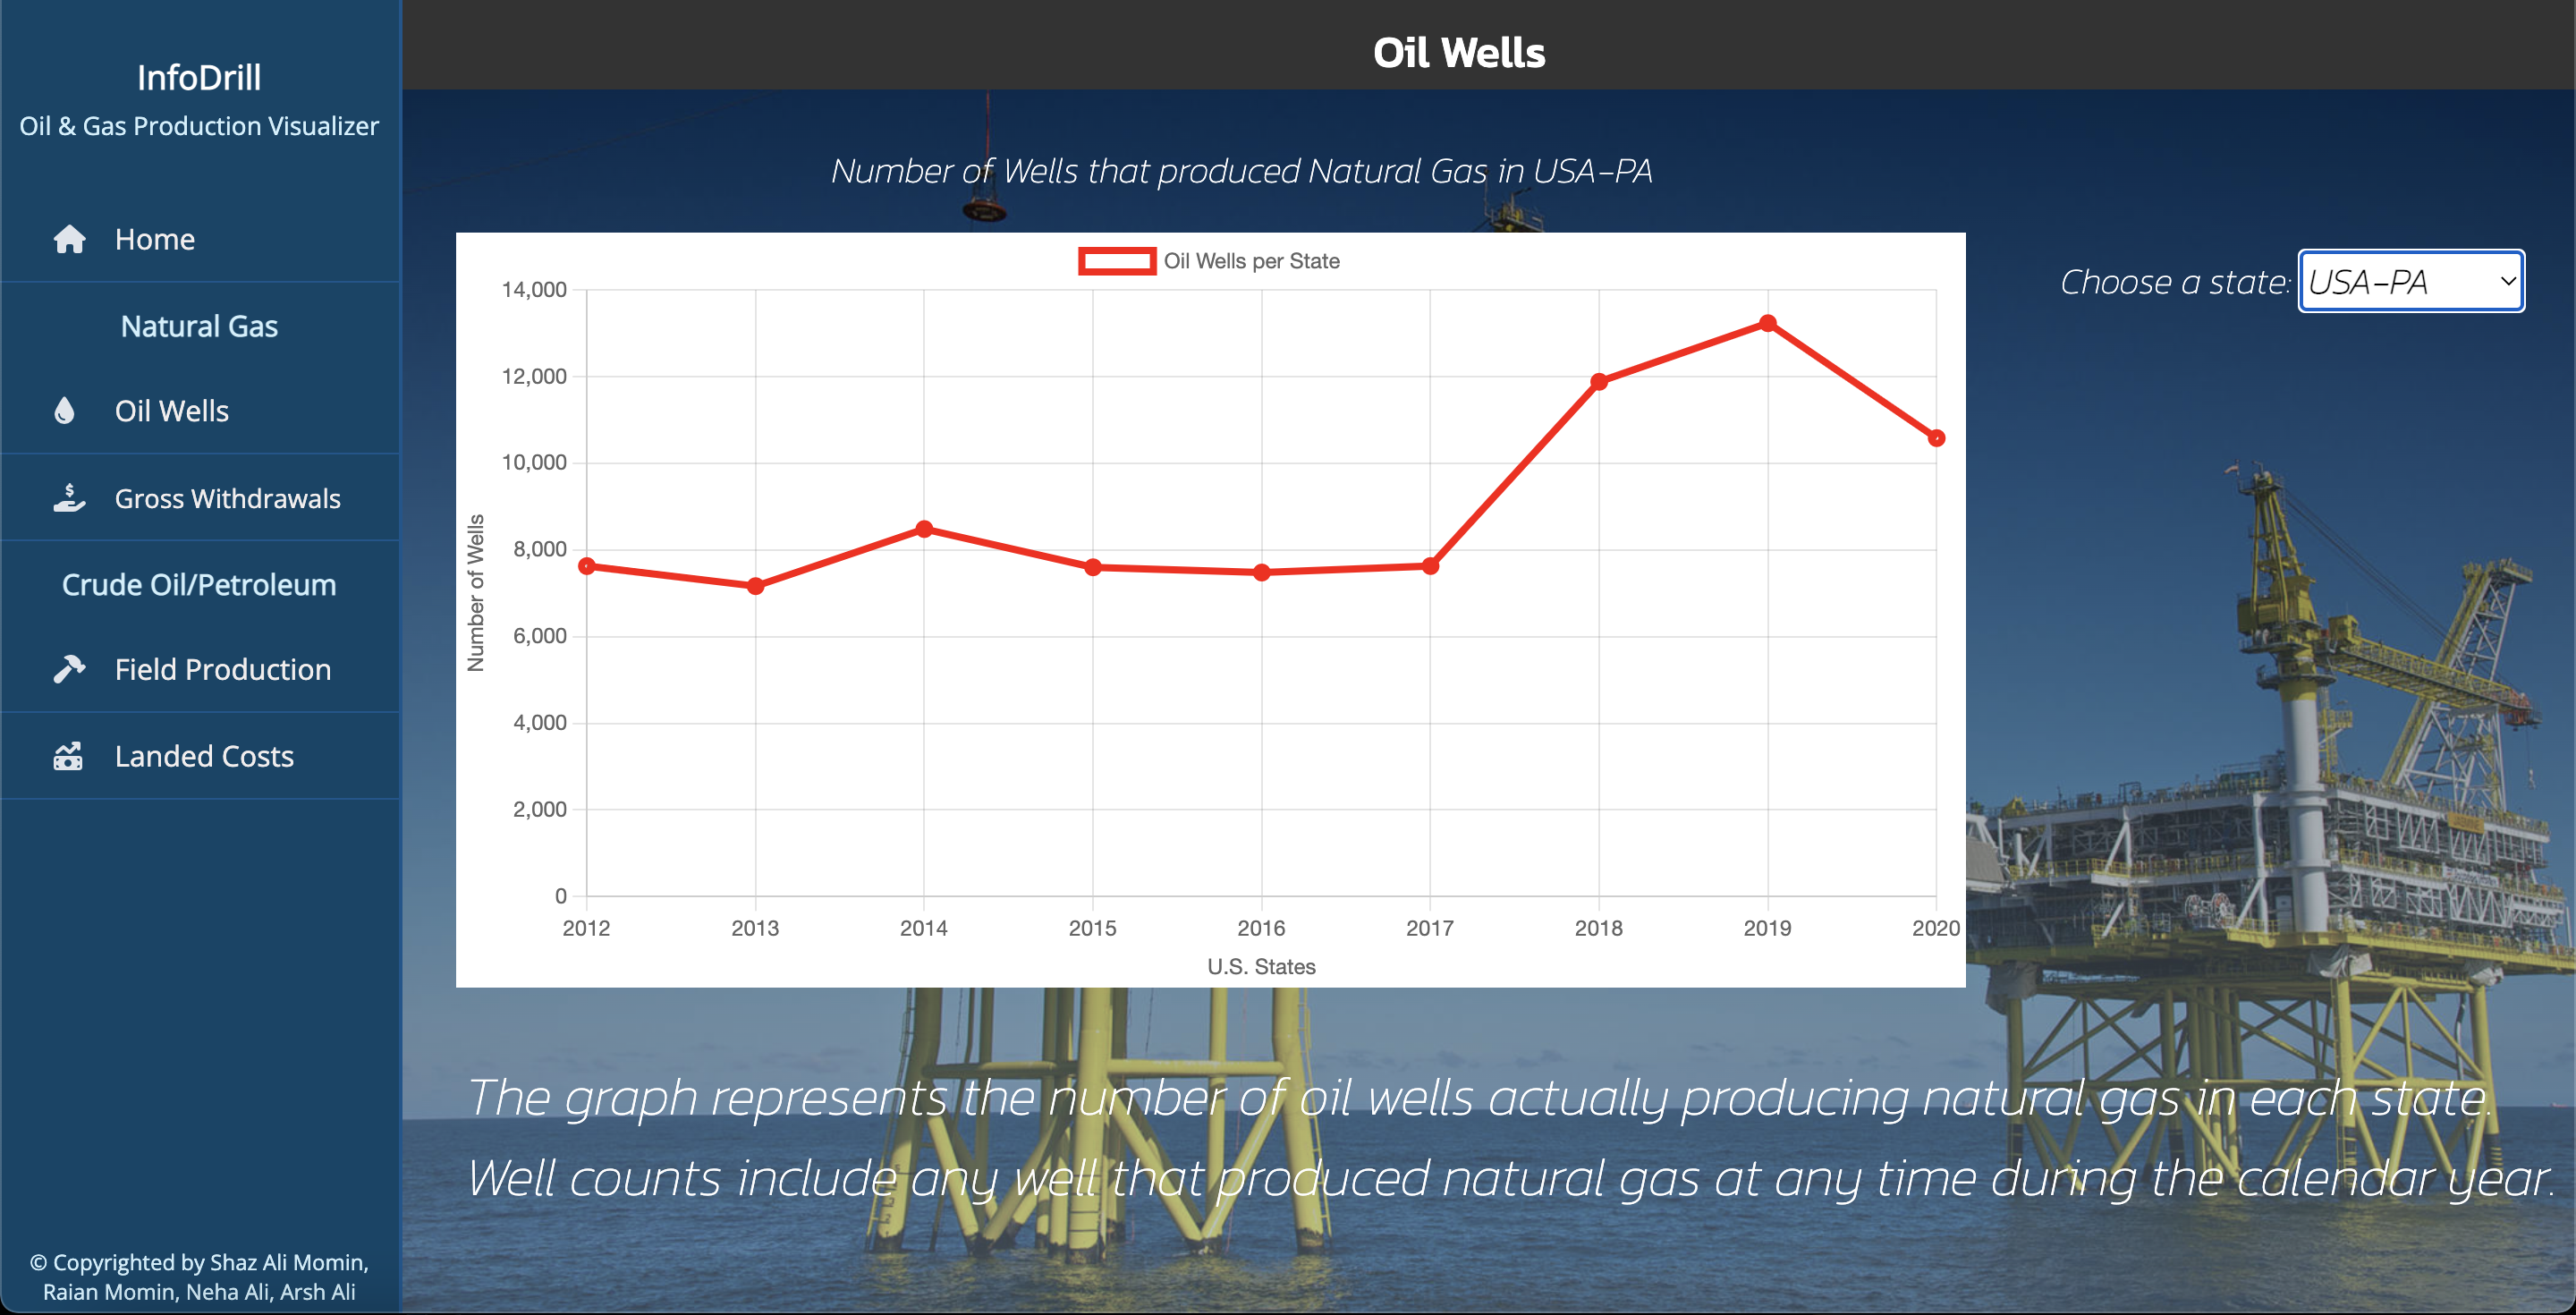
Oil Wells
-
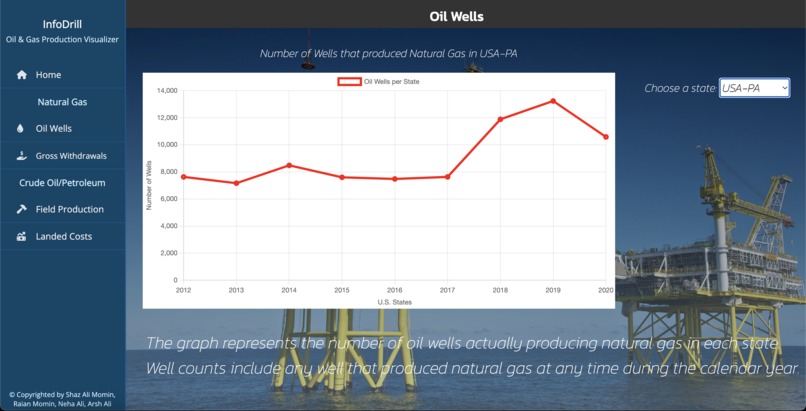
Oil Wells per State
-
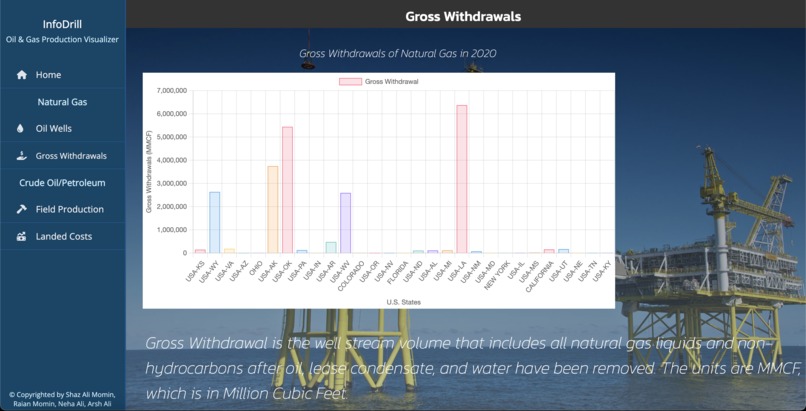
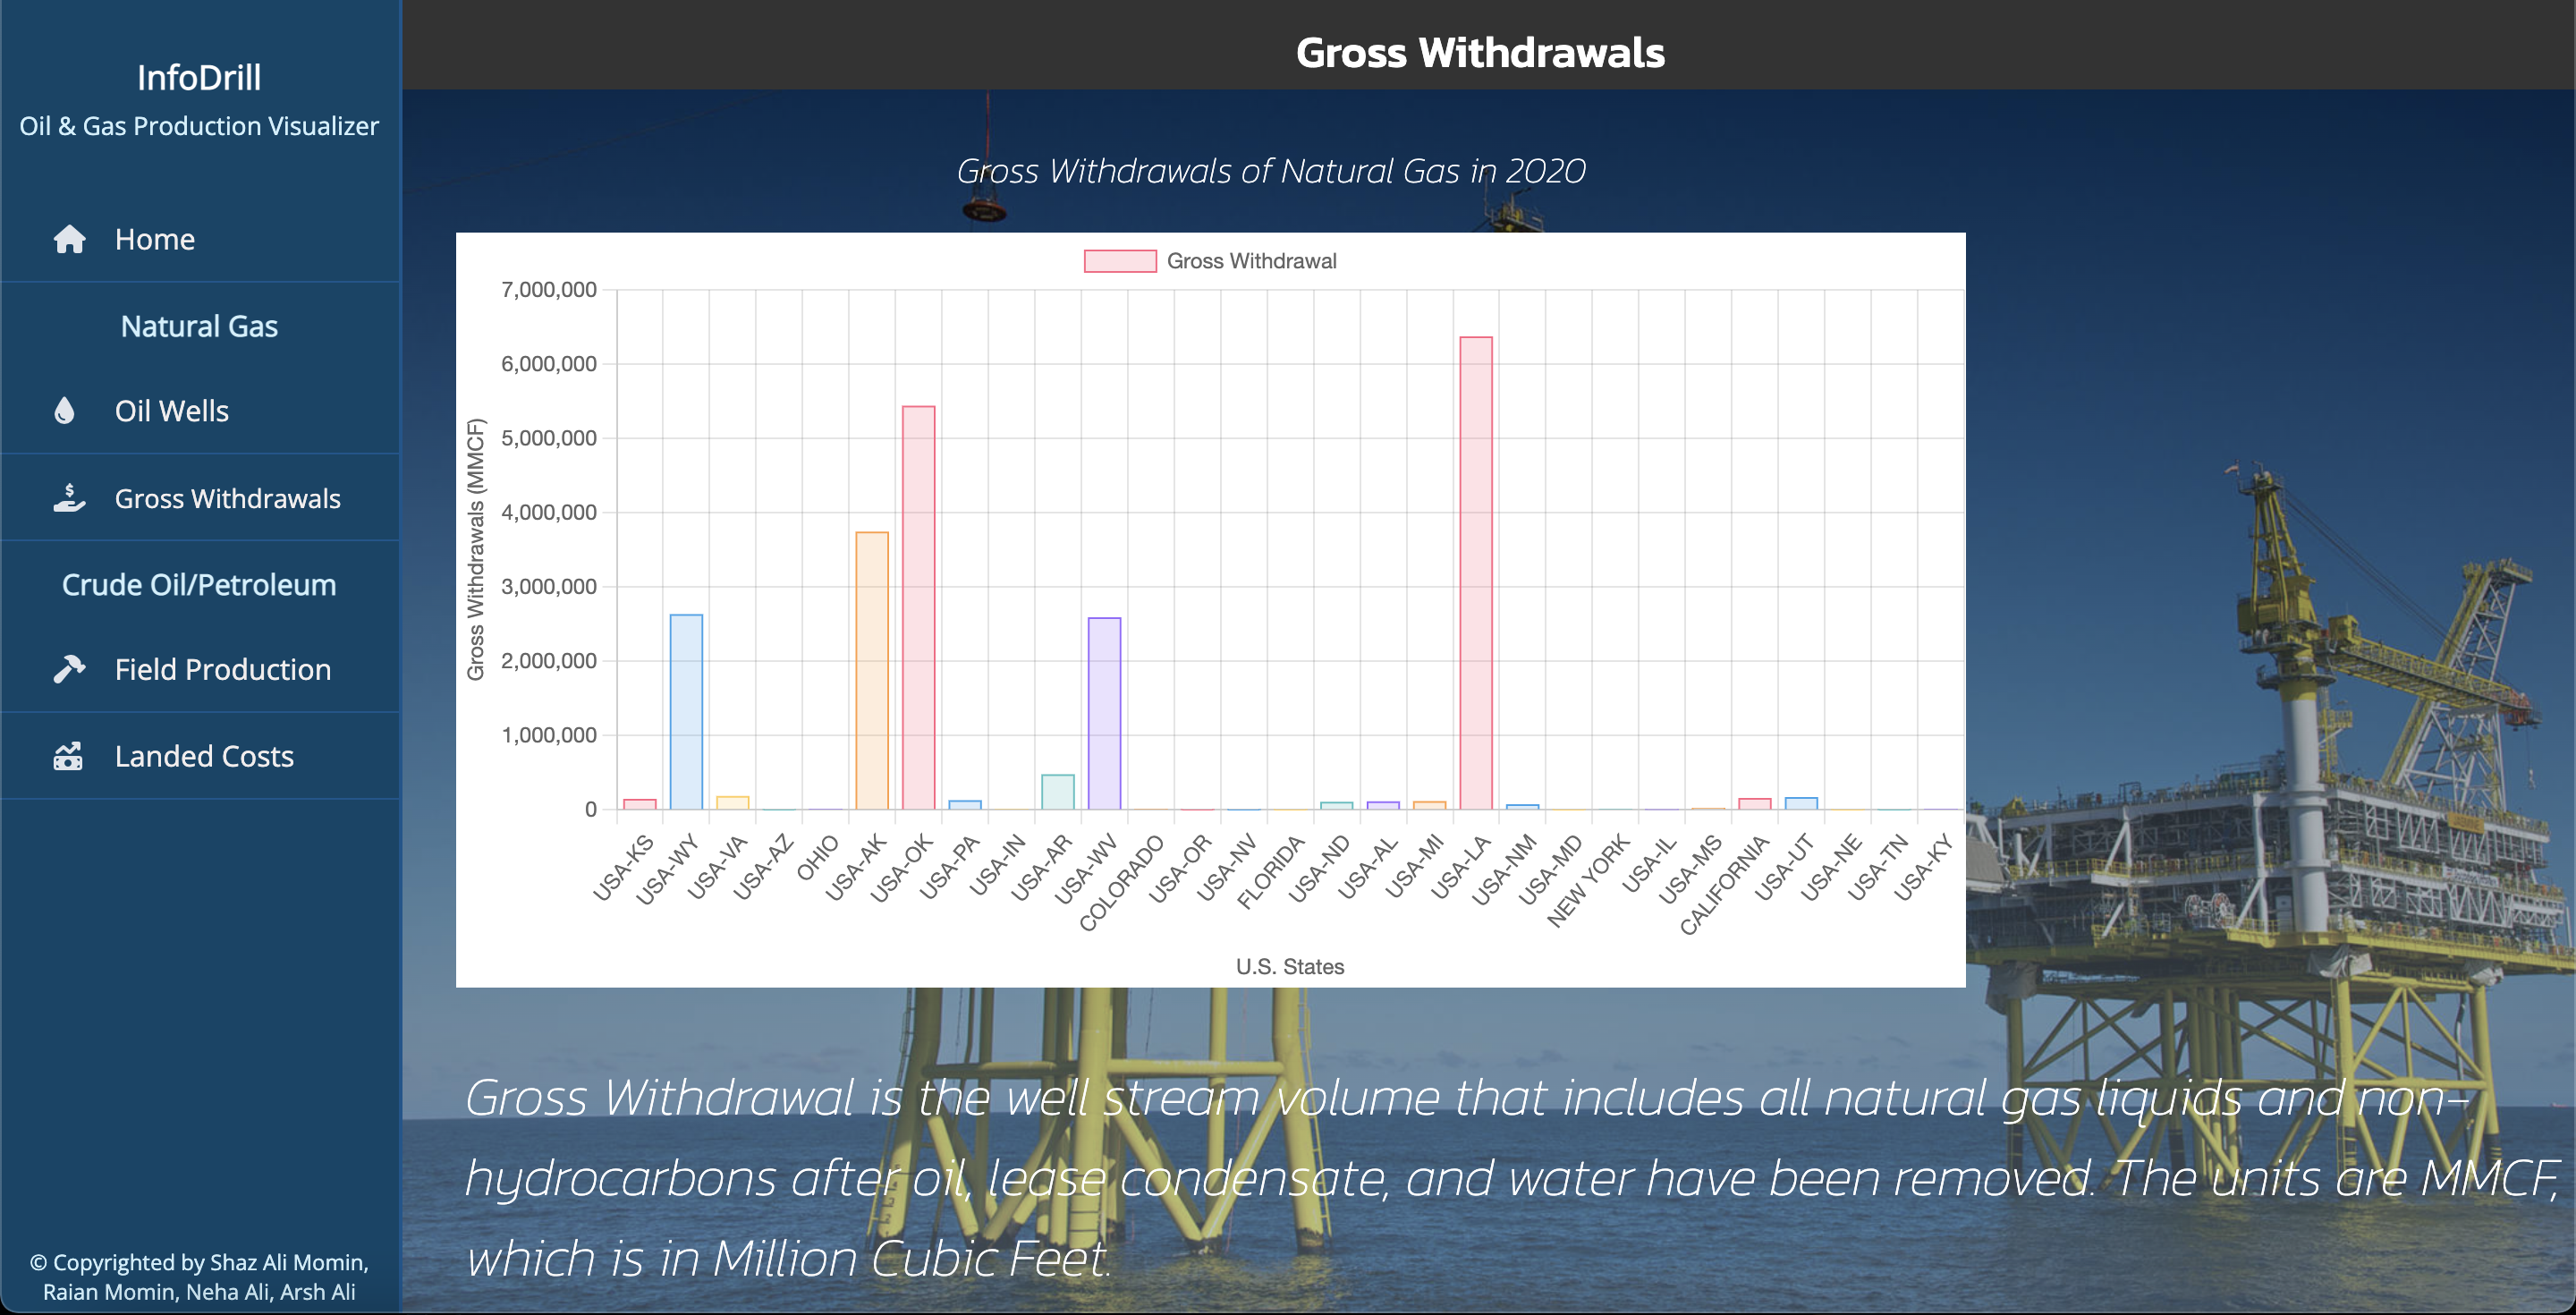
Gross Withdrawal
-
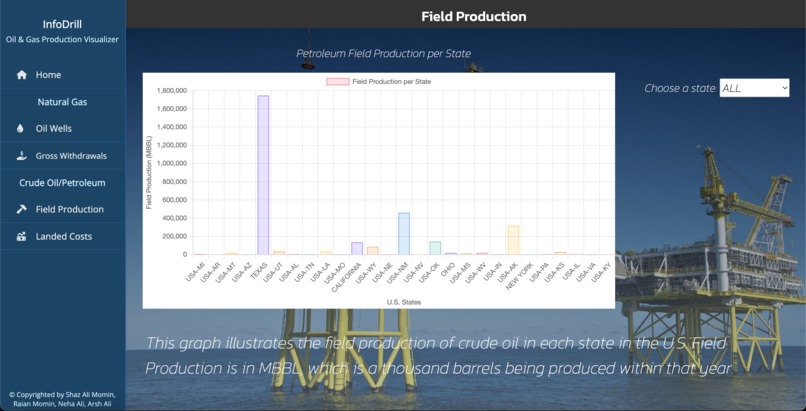
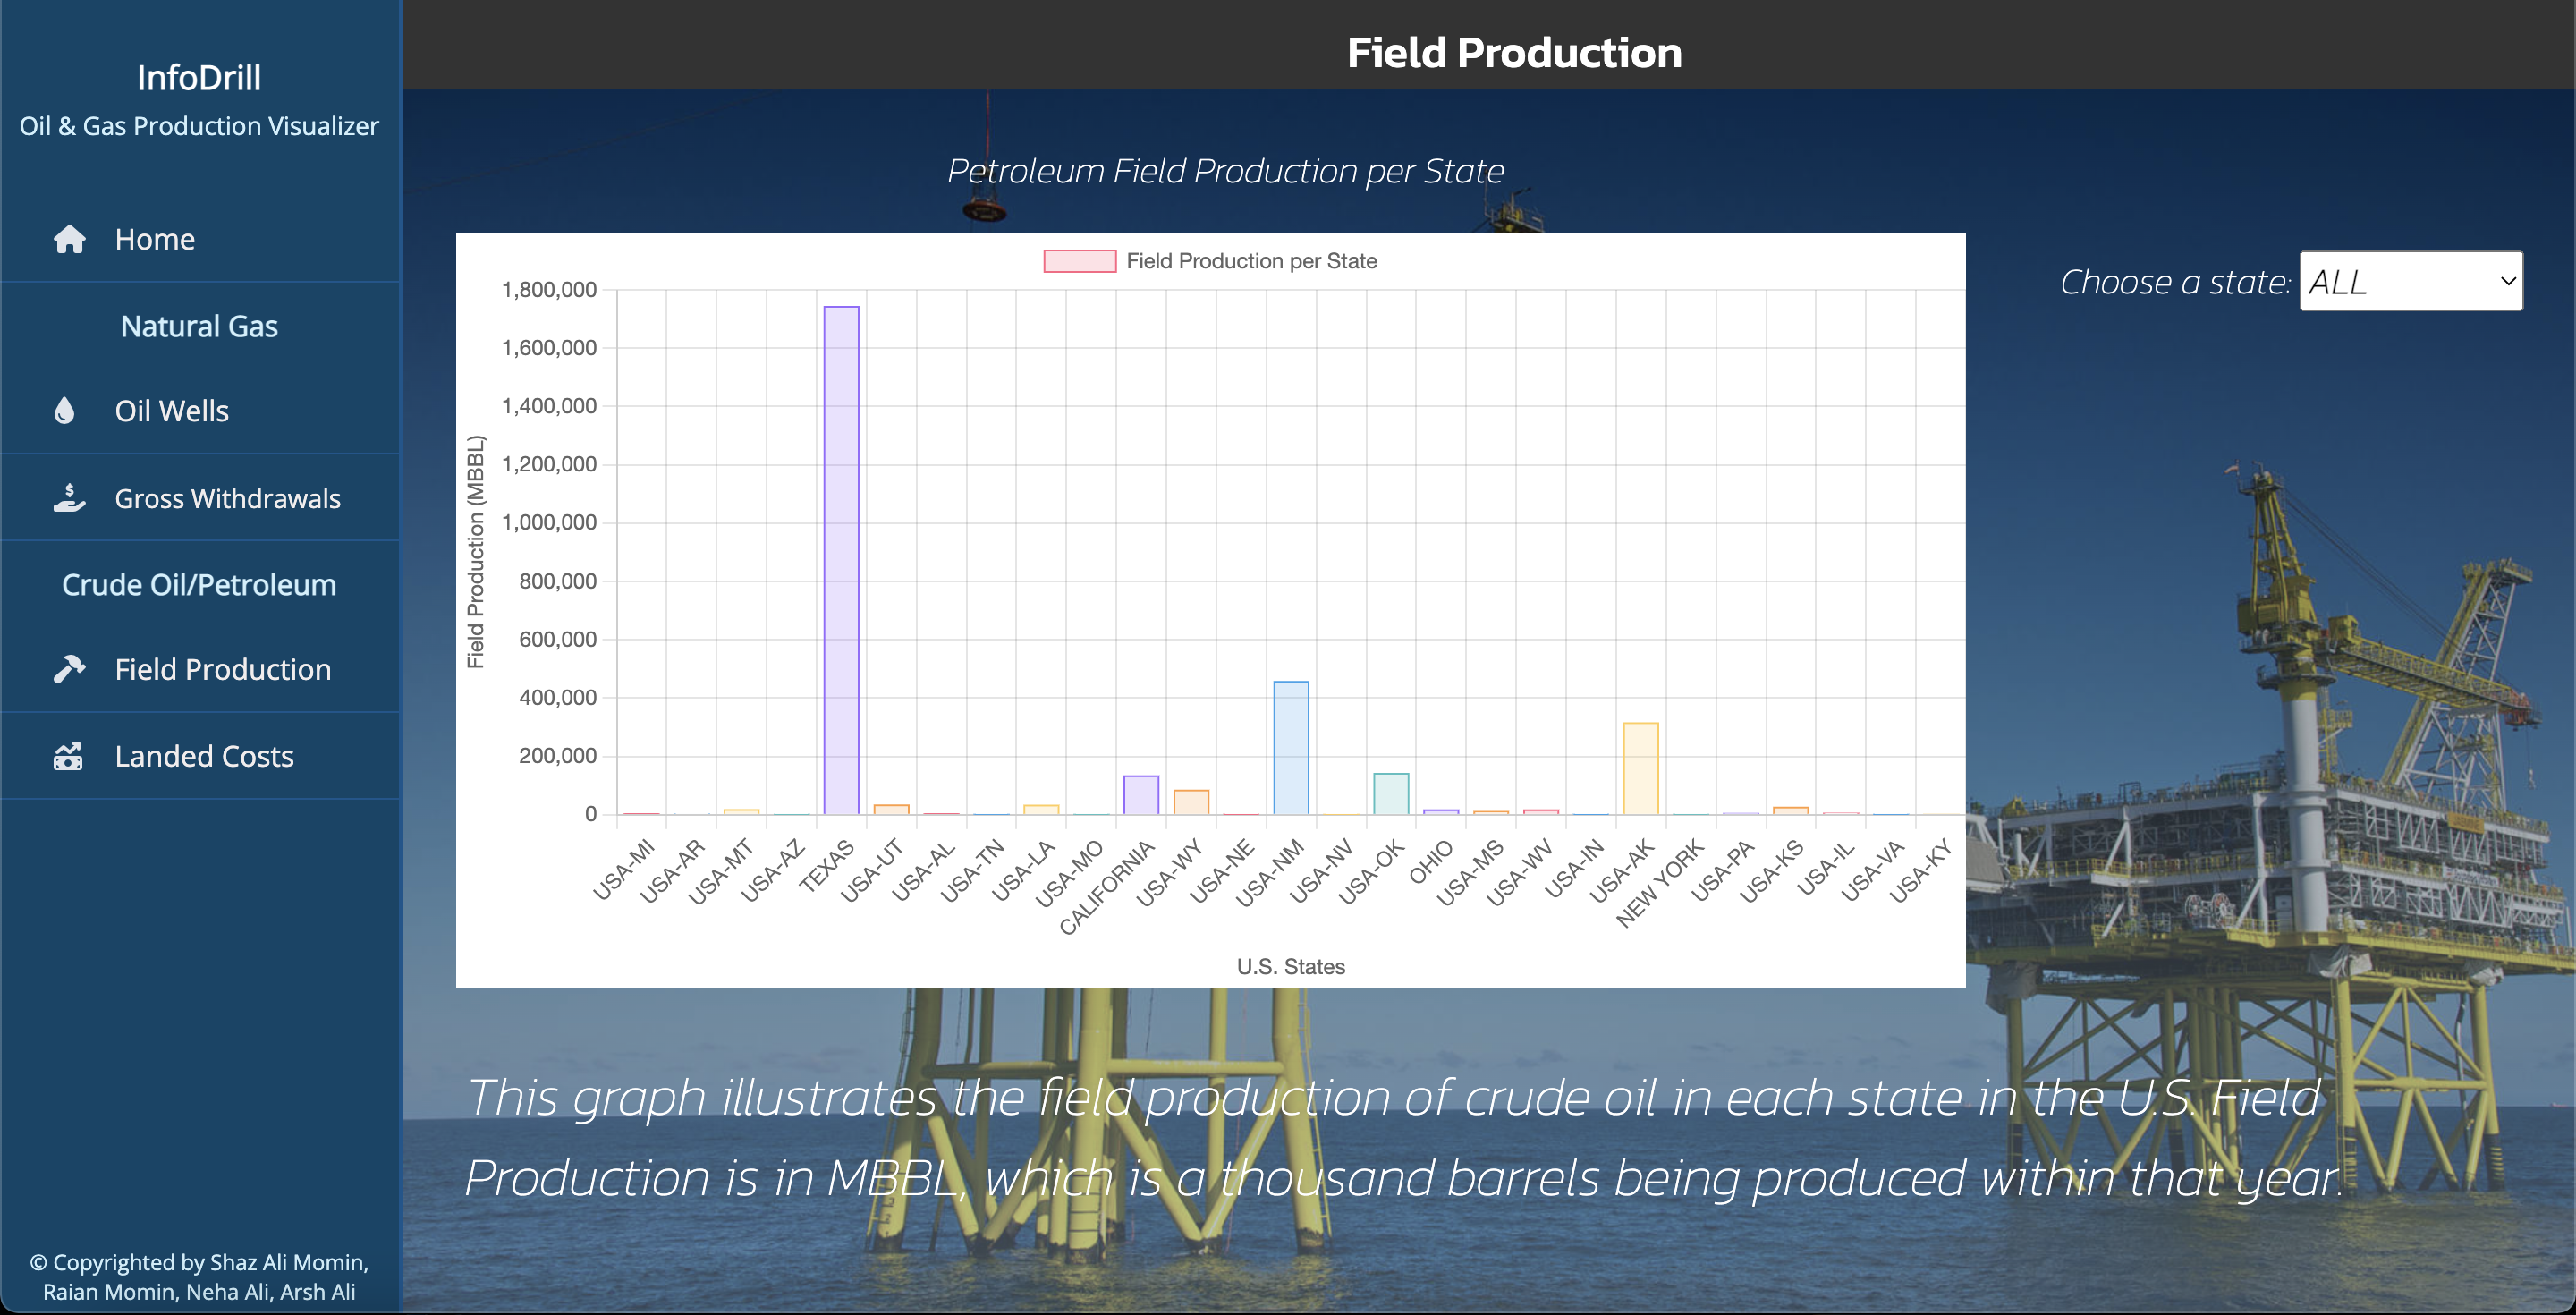
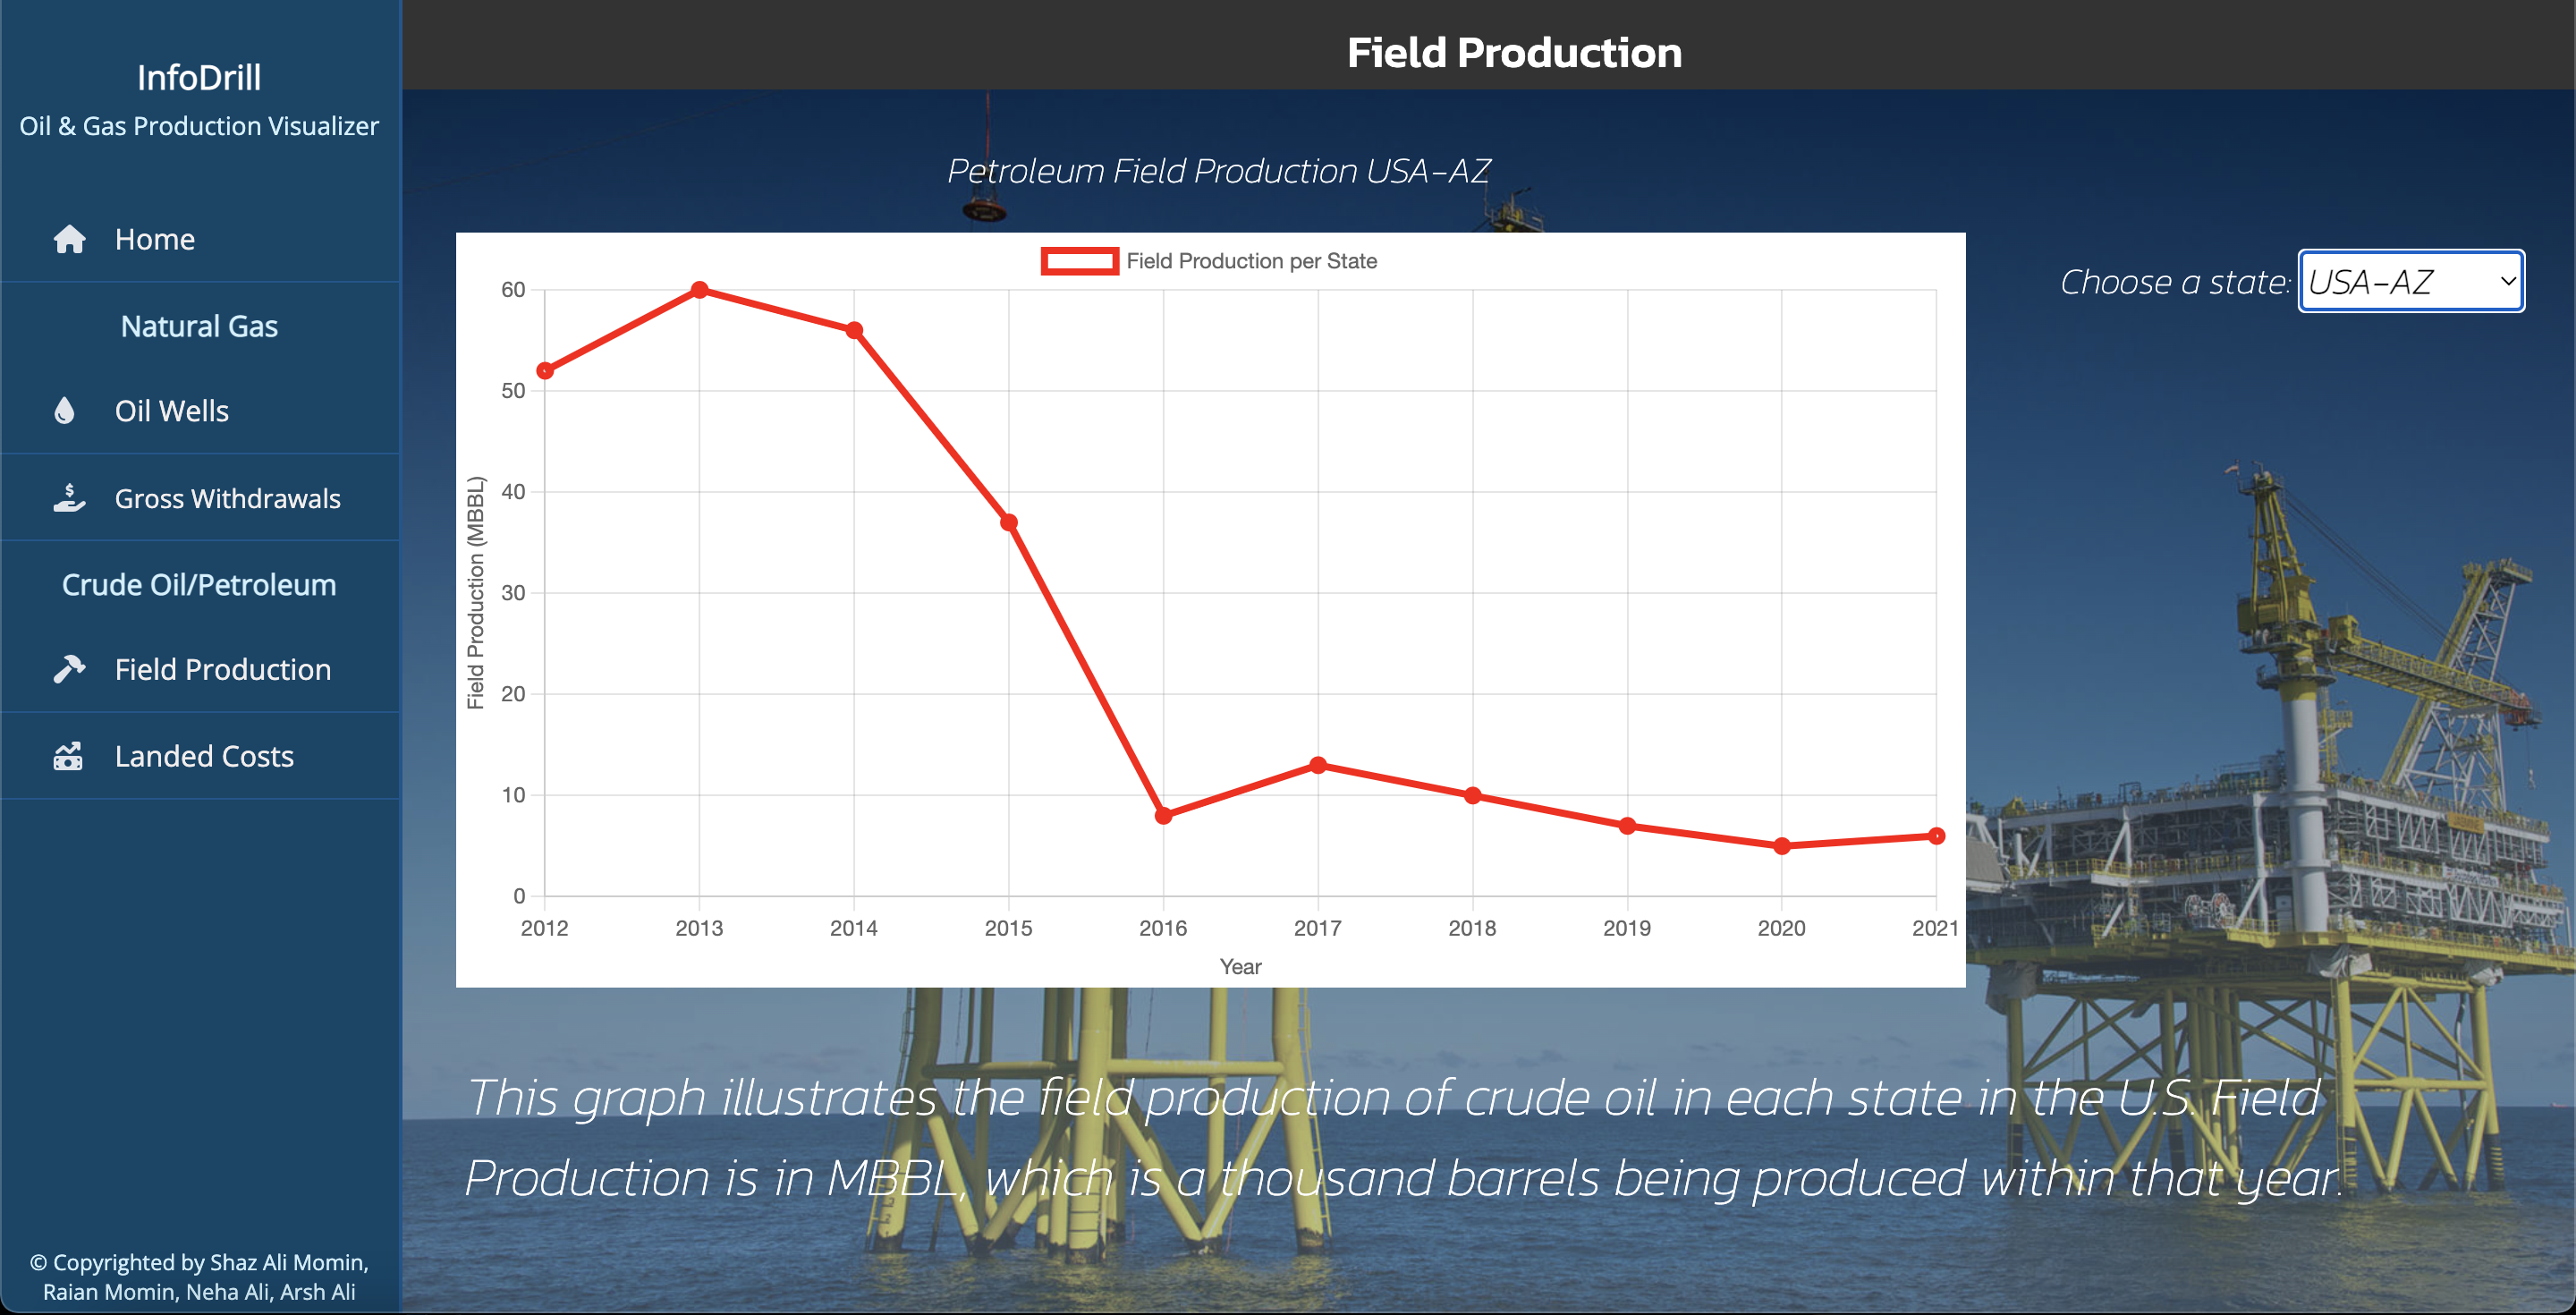
Field Production
-
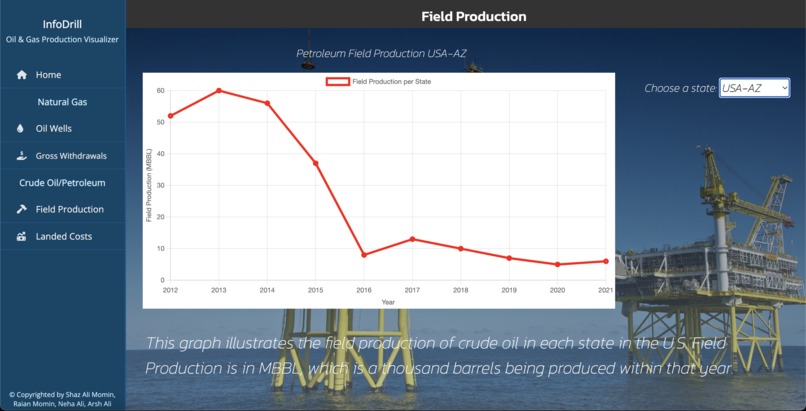
Field Production per State
-

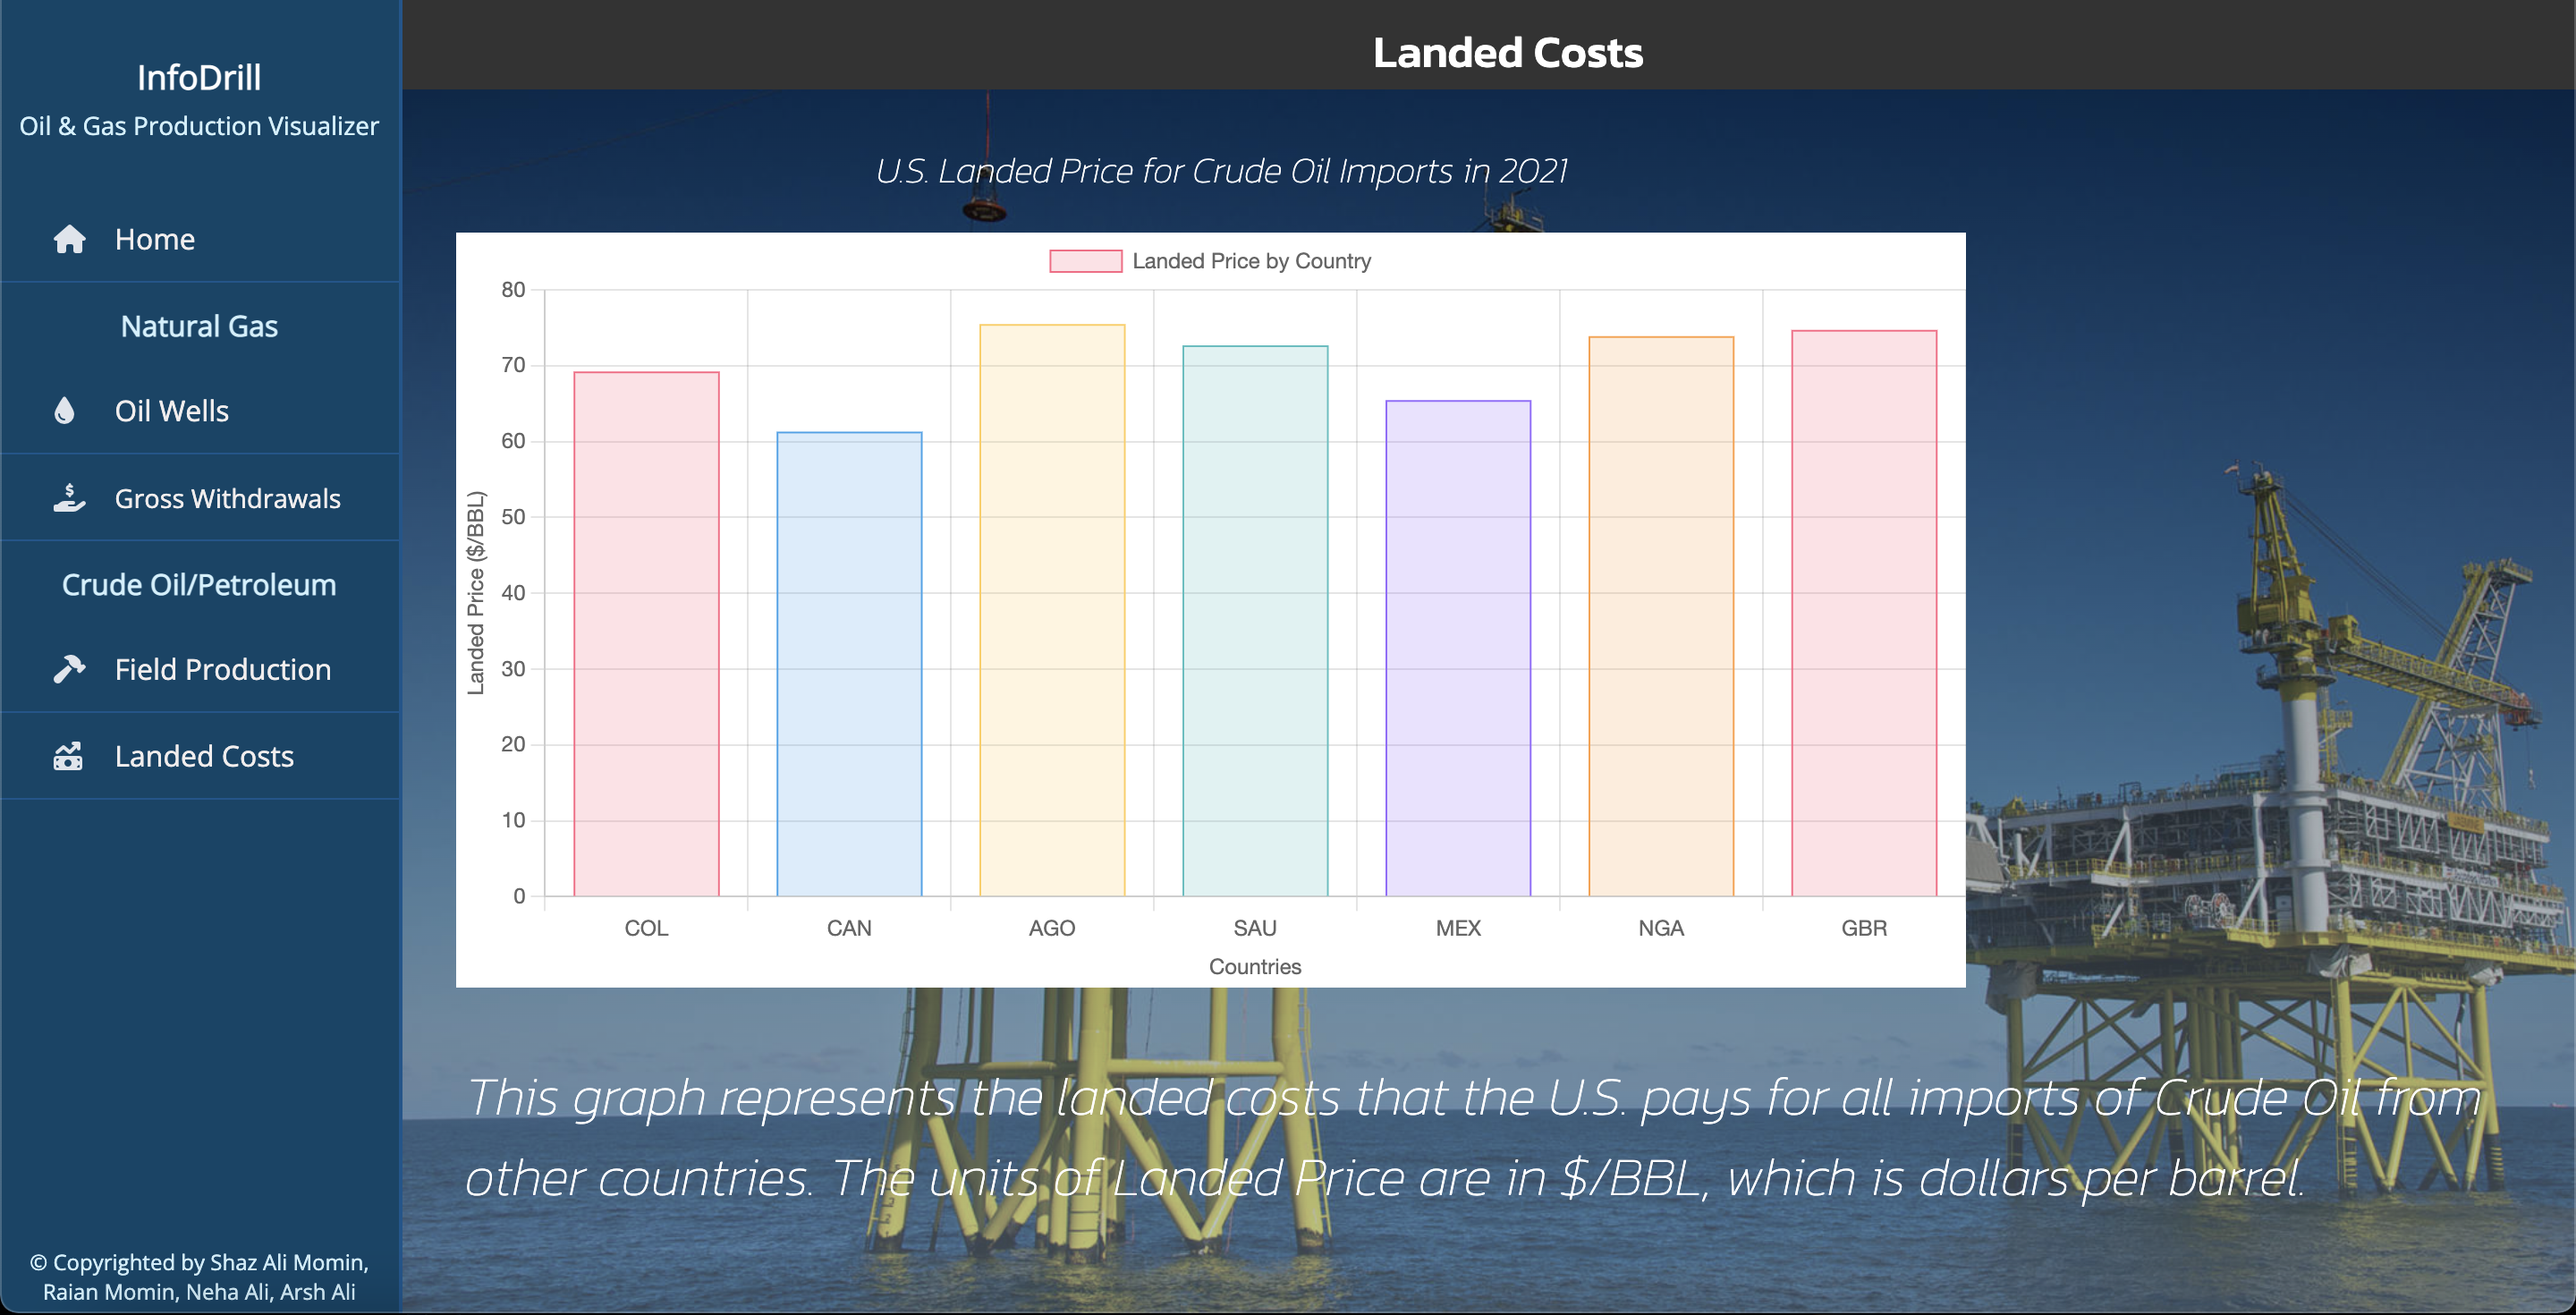
Landed Costs
ConocoPhillips Challenge
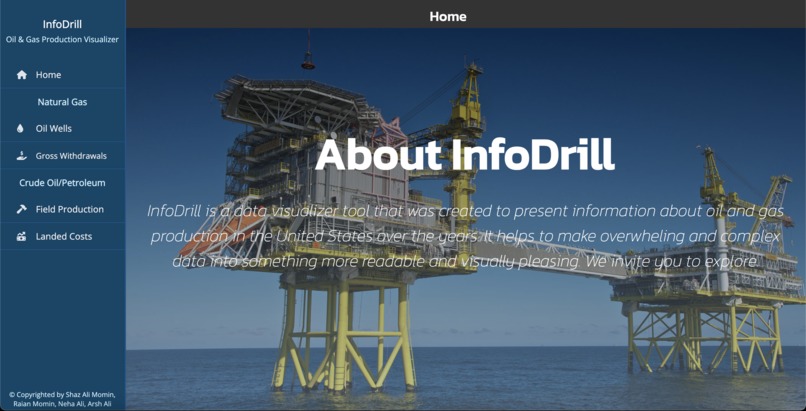
What it does
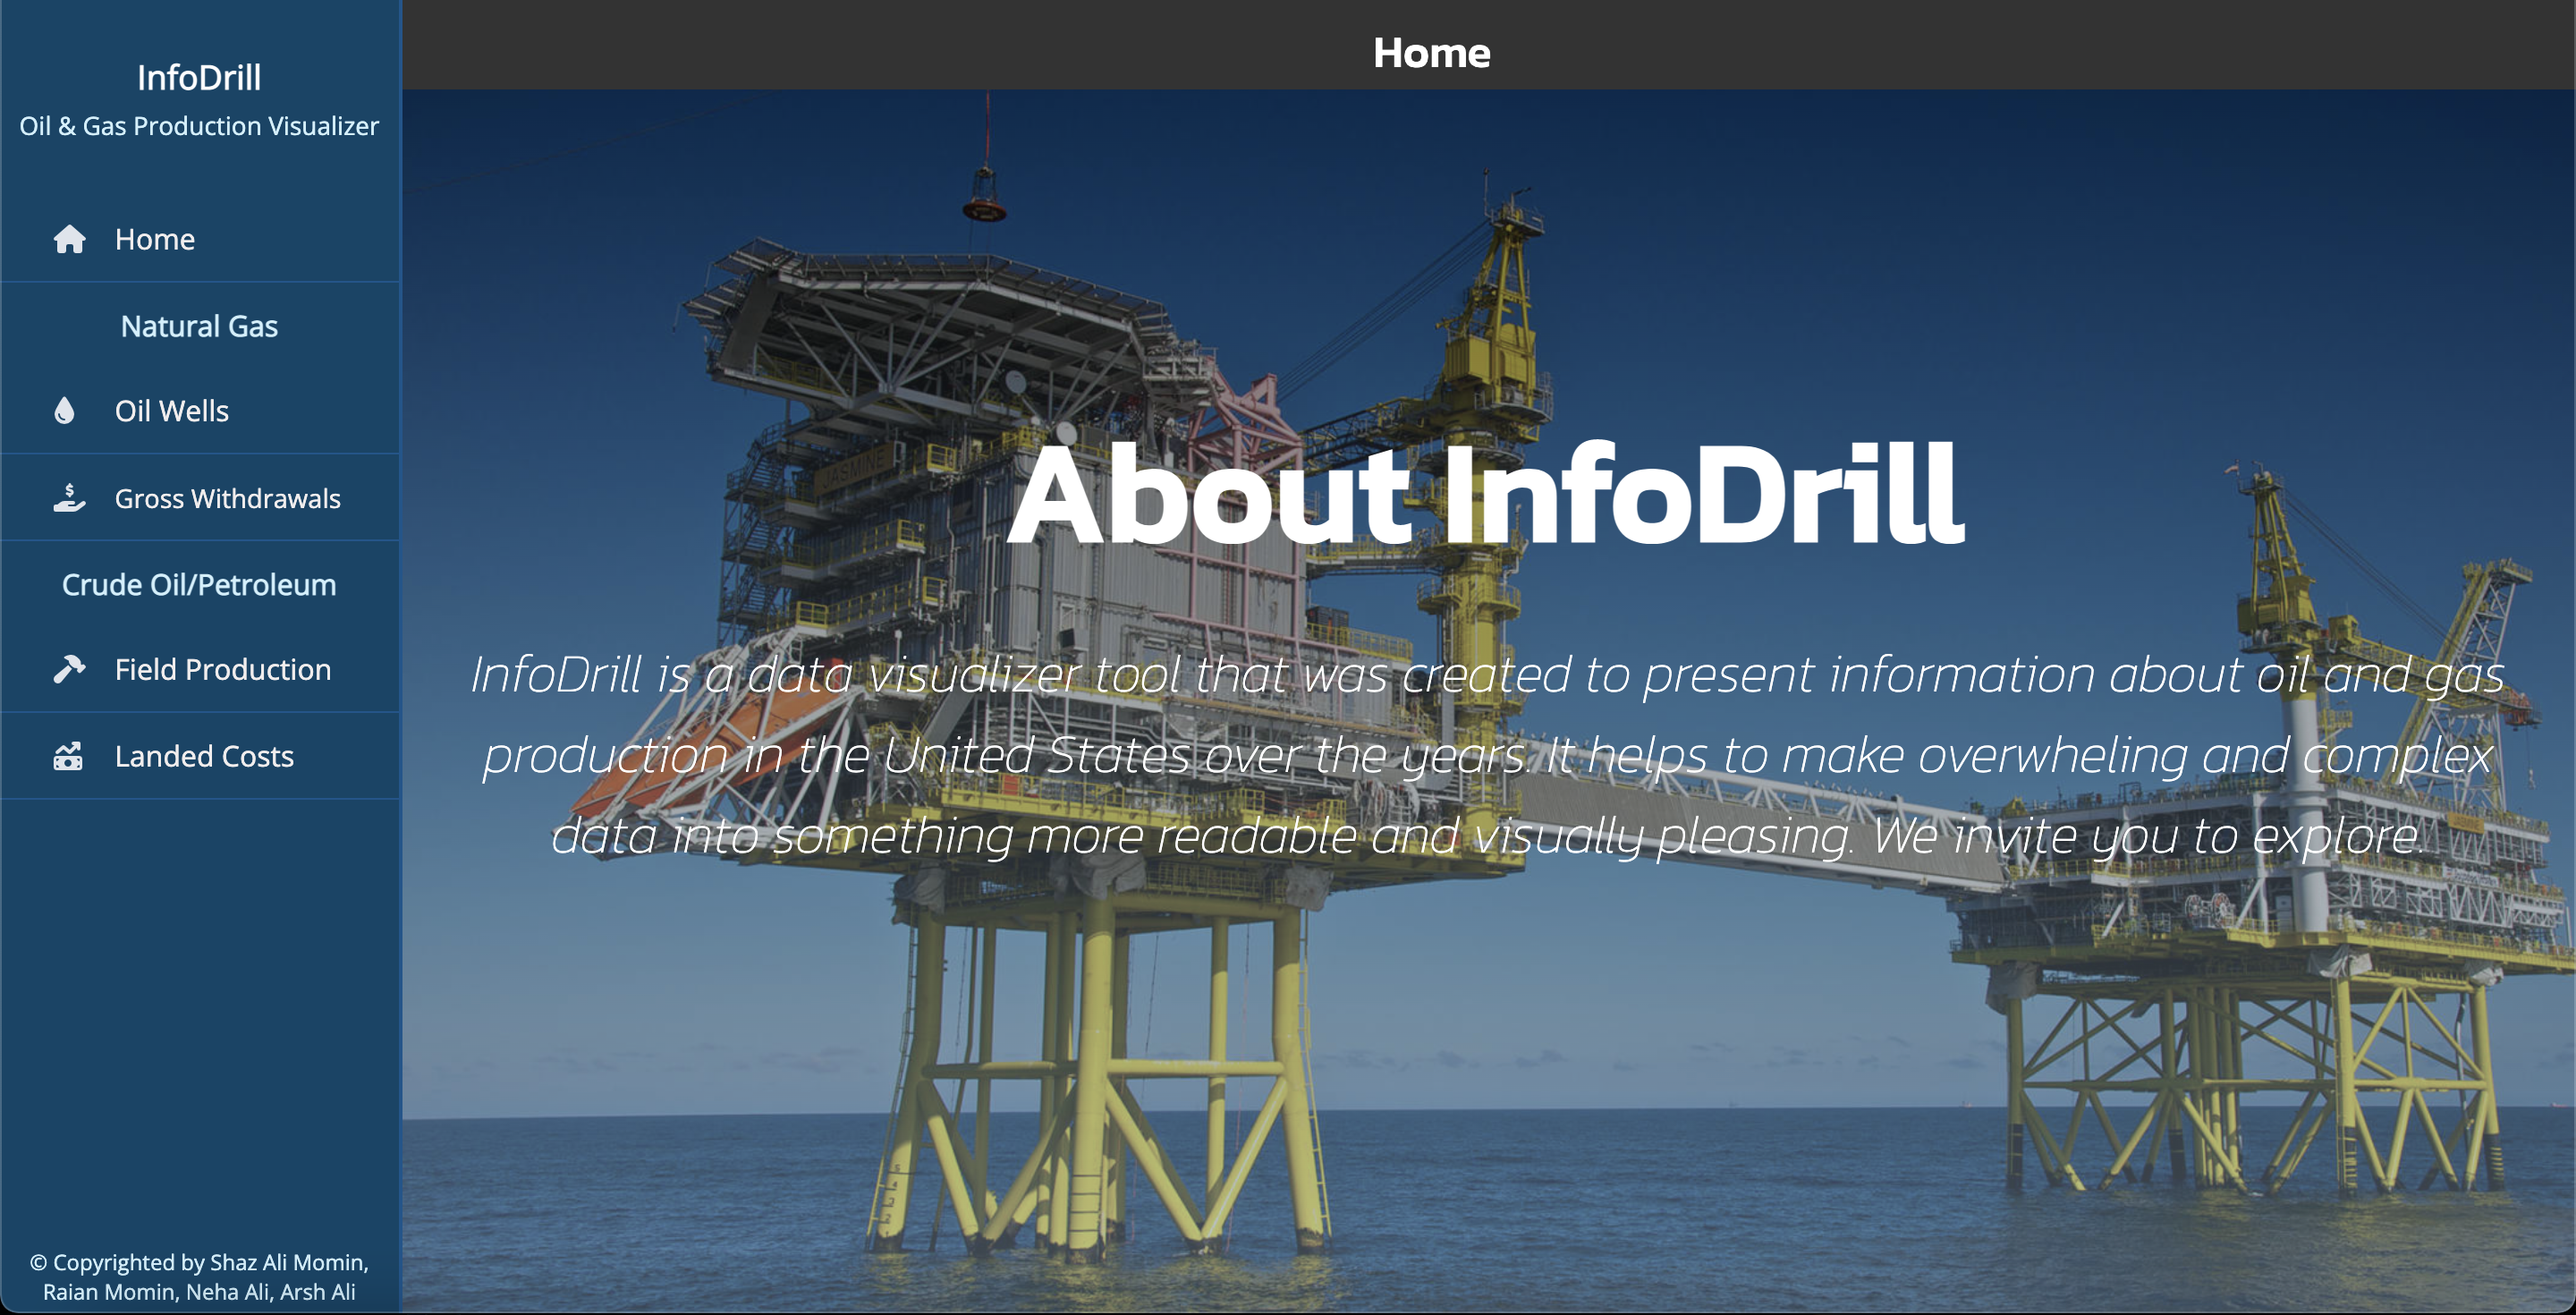
The visualizer shows 4 data sets taken from the EIA API for both Petroleum and Natural Gas Production in the United States (2 data sets each).
Users can see recent data on the number of Oil wells in a number of states, the gross withdrawal, Field Production, and Landed Costs.
The number of Oil Wells and Field Wells will allow users to select individual states and see changes over time for the specific state.
How we built it
We built this project using HTML, CSS, and JavaScript. We also used the EIA Petroleum and Natural Gas API to get the data we need to display.
Challenges we ran into
We are relatively new to front-end development, so we spent some time learning new technologies and modules.
Accomplishments that we're proud of
We were able to add everything we wanted to put in the 24hr time frame. Especially compared to the previous project we did for the hackathon.
What we learned
We were able to get a better understanding of how to bring in different technologies in order to create a web application. We learned how to request from and display data received from an API.
What's next for Info Drill
Hopefully, in time, we can come back to this project and add more functionality as we learn better and newer technologies.

Log in or sign up for Devpost to join the conversation.