-
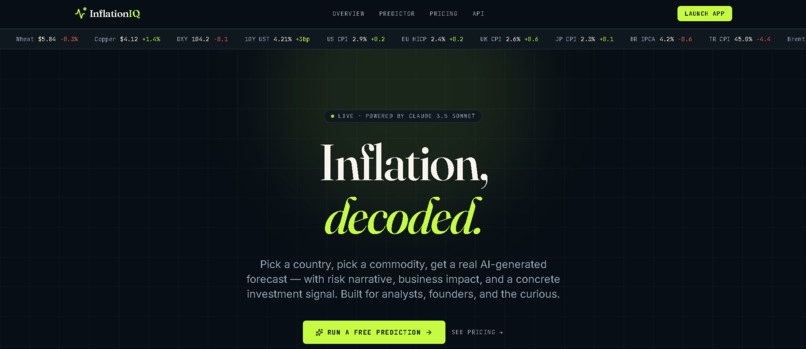
InflationIQ homepage — AI-powered inflation intelligence platform
-
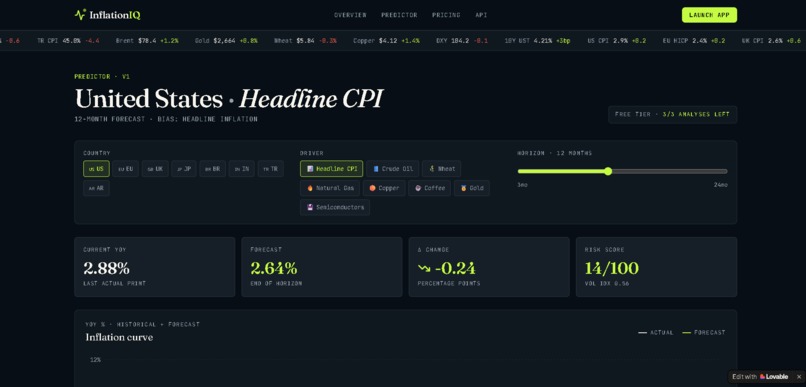
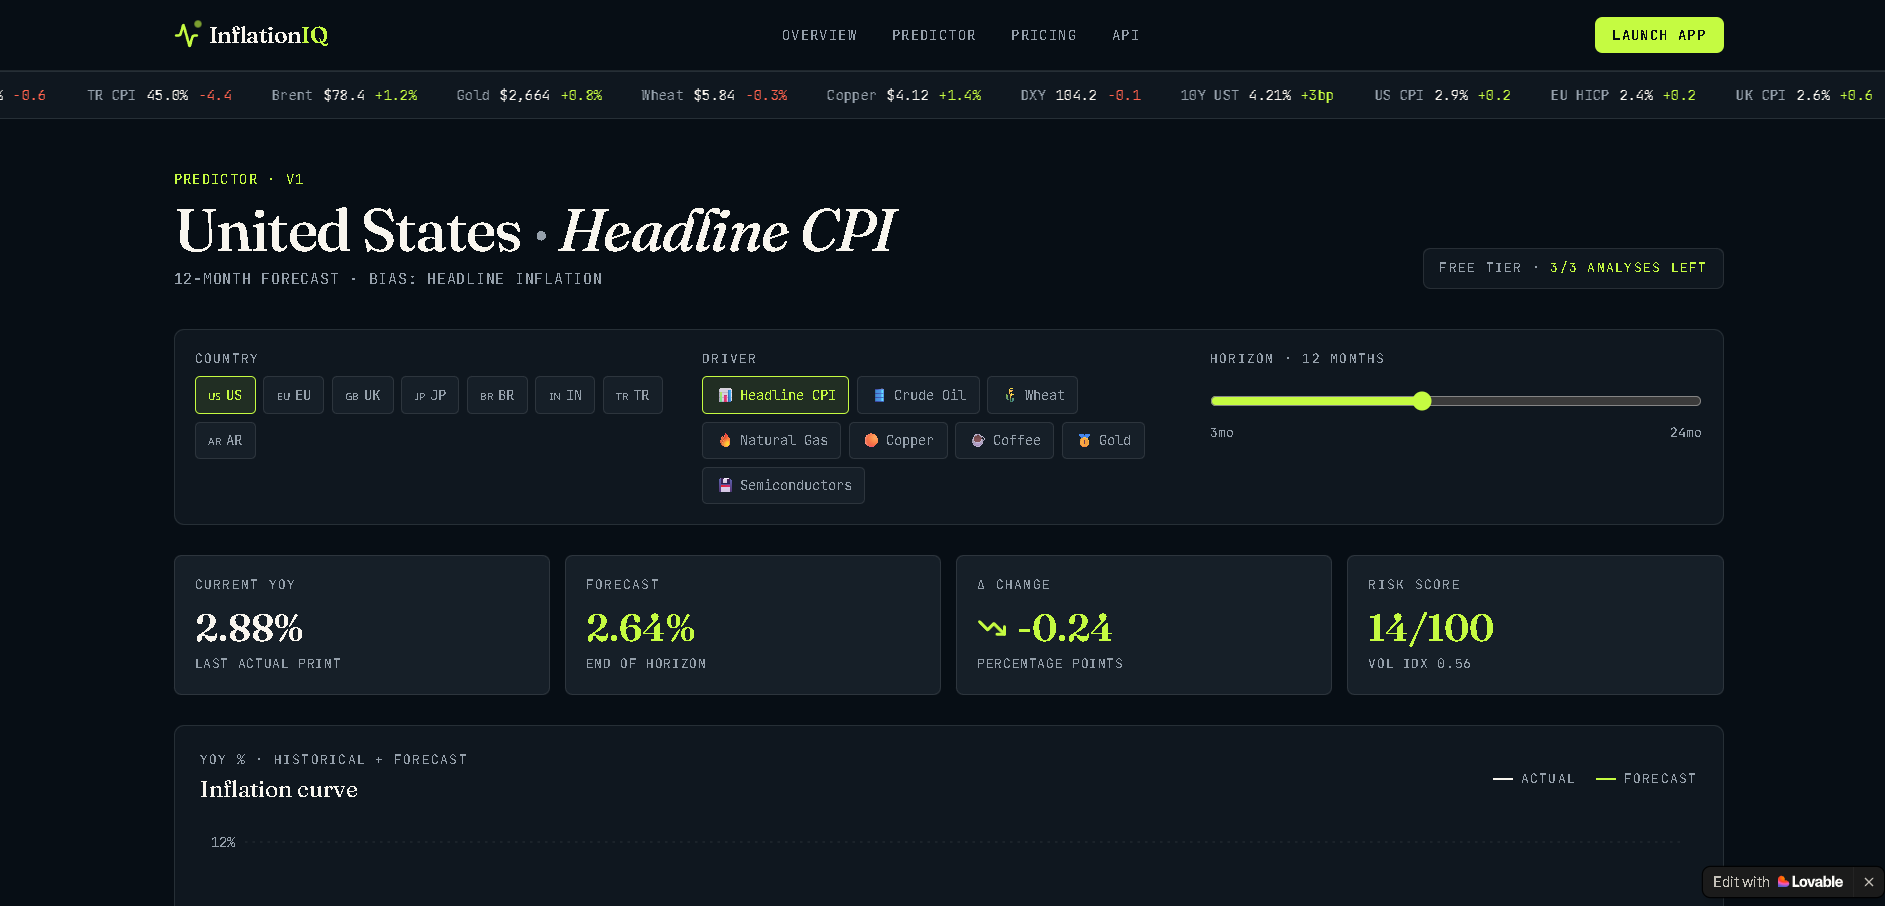
Country + commodity forecast with confidence intervals
-
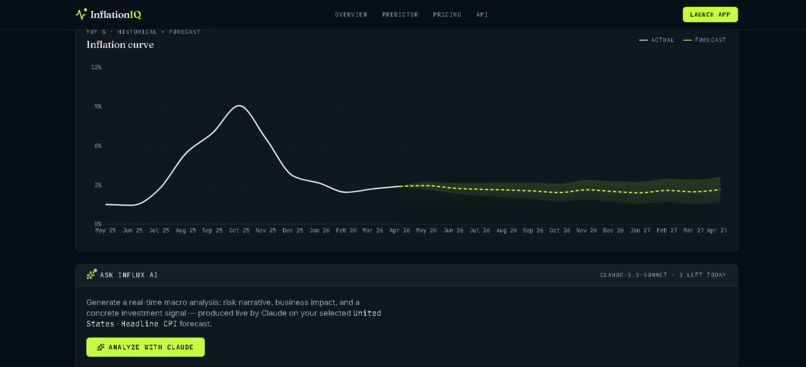
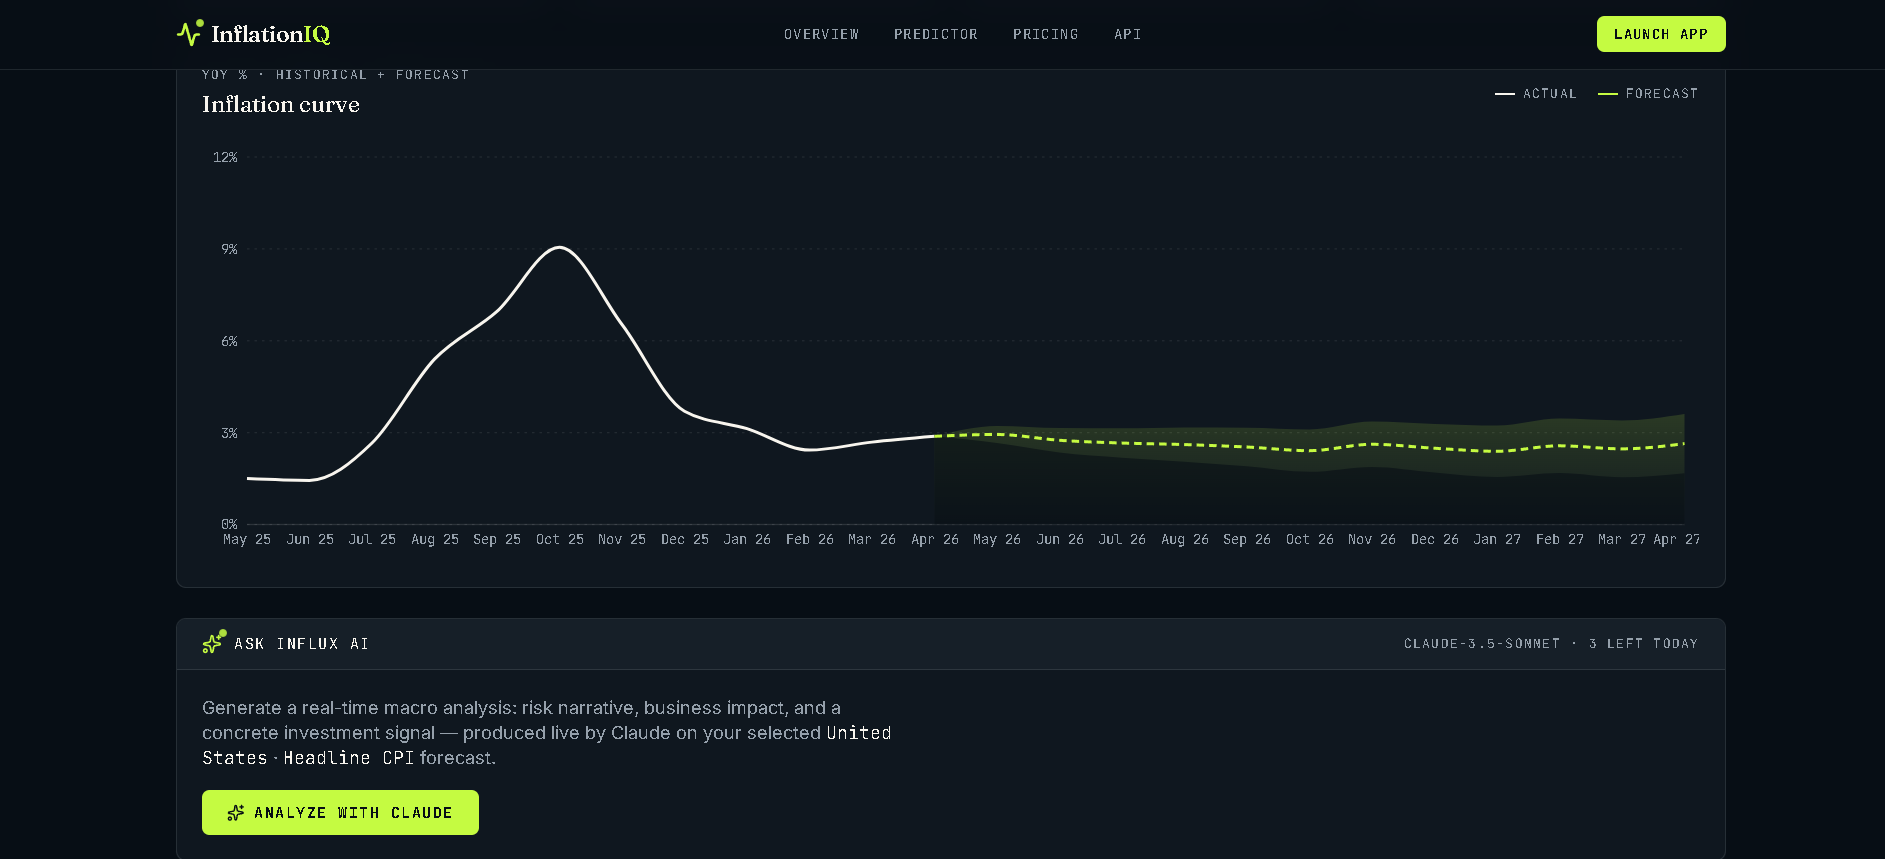
CPI trend visualization with risk scoring
-
Personalized investment signals — BUY/SELL/HEDGE/HOLD
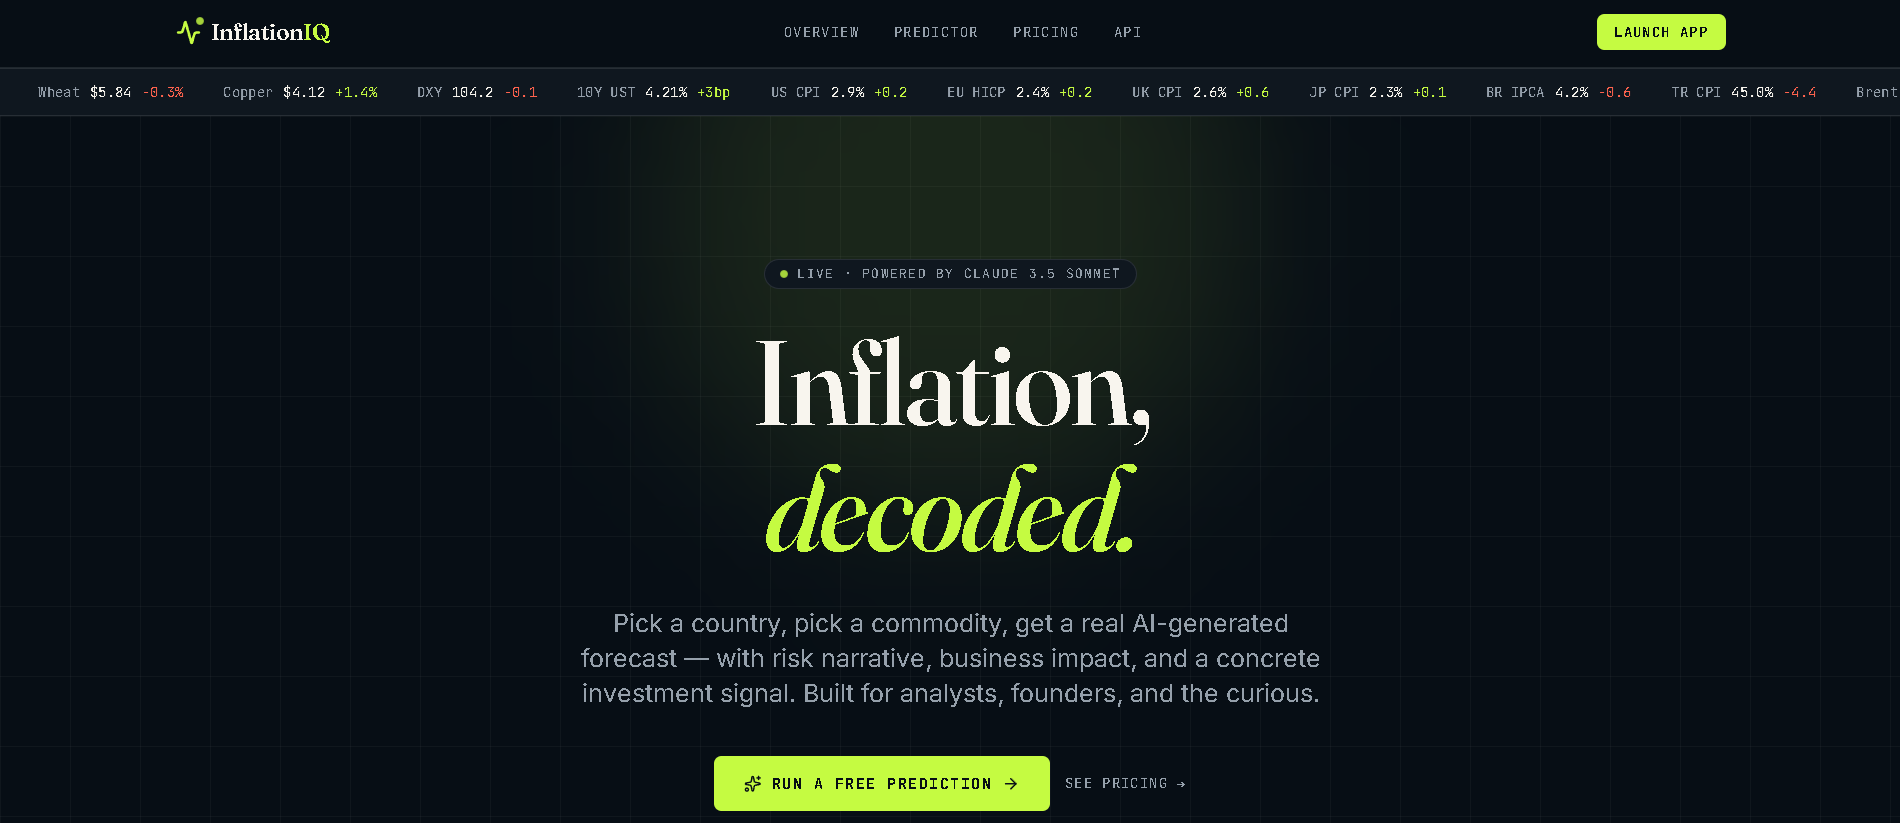

InflationIQ — Inflation, Decoded 🌐📈
Inspiration
Inflation is one of the most powerful yet least understood forces shaping everyday financial decisions. Whether you're a founder planning expenses, an analyst hedging a portfolio, or simply someone trying to understand why groceries cost more — the data exists, but the intelligence layer connecting raw economic indicators to actionable insight does not.
I wanted to build something that bridges that gap: a tool that doesn't just show you inflation numbers, but tells you what they mean and what to do about them.
The name Orion — this hackathon's namesake — symbolizes navigation into the unknown. InflationIQ is exactly that: a navigation system for economic uncertainty.
What It Does
InflationIQ is an AI-powered inflation forecasting platform that lets you:
- Pick a country + commodity (e.g. India + Natural Gas, US + Oil)
- Set a forecast horizon (3, 6, 12, or 24 months)
- Get a real AI-generated analysis including:
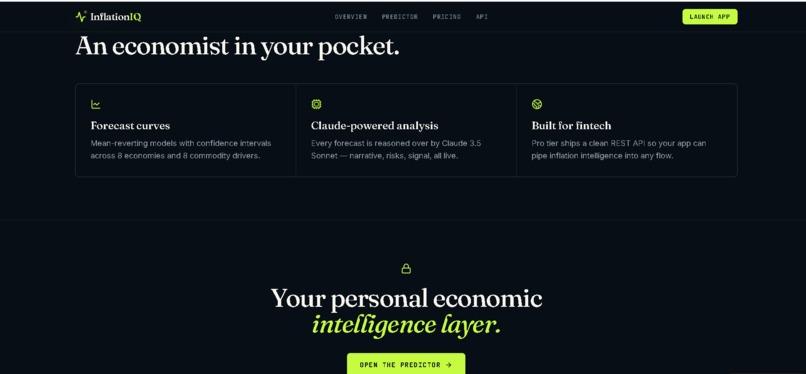
- Predicted CPI trajectory with confidence intervals
- Risk score and volatility regime classification
- A typed BUY / SELL / HEDGE / HOLD investment signal with tickers
- A full narrative explaining the economic reasoning
The free tier offers 3 analyses per day with no signup, making it accessible to anyone.
How I Built It
The stack is intentionally lean and fast to ship:
| Layer | Technology |
|---|---|
| Frontend | React + TypeScript + TailwindCSS |
| Routing | TanStack Router |
| AI Engine | Claude 3.5 Sonnet (Anthropic) |
| Build Tool | Vite + Bun |
| Deployment | Vercel |
The core intelligence loop works like this:
$$\text{Input}(\text{country}, \text{commodity}, \text{horizon}) \xrightarrow{\text{Claude 3.5}} {\hat{\pi}, \sigma, \text{signal}, \text{narrative}}$$
Where $\hat{\pi}$ is the predicted inflation rate, $\sigma$ is the volatility estimate, and the signal is one of the four typed action states.
The prompt is carefully engineered to keep all reasoning server-side, returning structured JSON with forecast, risk, signal, and narrative blocks — mirroring a real fintech API response format.
A live ticker across the top of the app displays real commodity and CPI data points (Gold, Wheat, Copper, DXY, US CPI, EU HICP, and more), giving users immediate market context before they run a prediction.
Challenges
1. Structured AI output reliability Getting Claude to consistently return well-formed JSON with all required fields across diverse country/commodity combinations required multiple prompt iterations and strict output validation.
2. Making forecasts feel credible without being misleading Economic forecasting is inherently uncertain. I spent significant time designing the confidence interval display and risk regime labels so users understand they're getting probabilistic intelligence, not guaranteed predictions.
3. Shipping a full product solo under time pressure From blank canvas to a deployed, multi-page app with a pricing page, API docs page, and working predictor — all within hackathon hours. Every architectural decision had to be fast and clean.
What I Learned
- How to engineer prompts for structured, typed AI outputs at scale
- Designing UX that makes complex financial data feel approachable
- The importance of progressive disclosure — showing just enough information at each step without overwhelming the user
- How real fintech products structure their API surface (forecast → risk → signal → narrative)
What's Next
- Server-side quota enforcement + user accounts
- PDF report export per analysis
- Full REST API for fintech developers (B2B tier)
- Historical backtesting: how accurate were past predictions?
- Expanding to 100+ countries and 20+ commodities
Built for the Orion Build Challenge 2026 — navigating economic uncertainty, one forecast at a time. 🔭
Built With
- 3.5
- anthropic
- api
- bun
- claude
- react
- router
- sonnet
- tailwindcss
- tanstack
- typescript
- vite

Log in or sign up for Devpost to join the conversation.