-
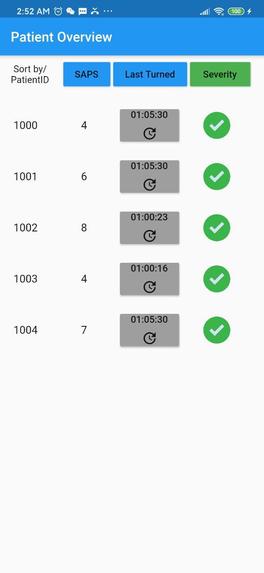
Figure 2: PatientOverview
-
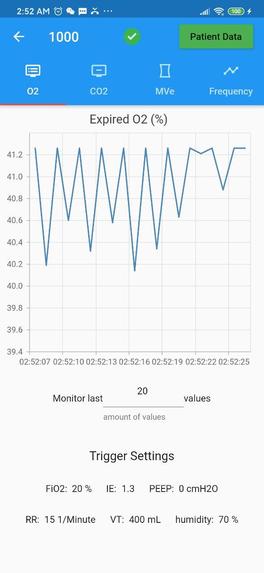
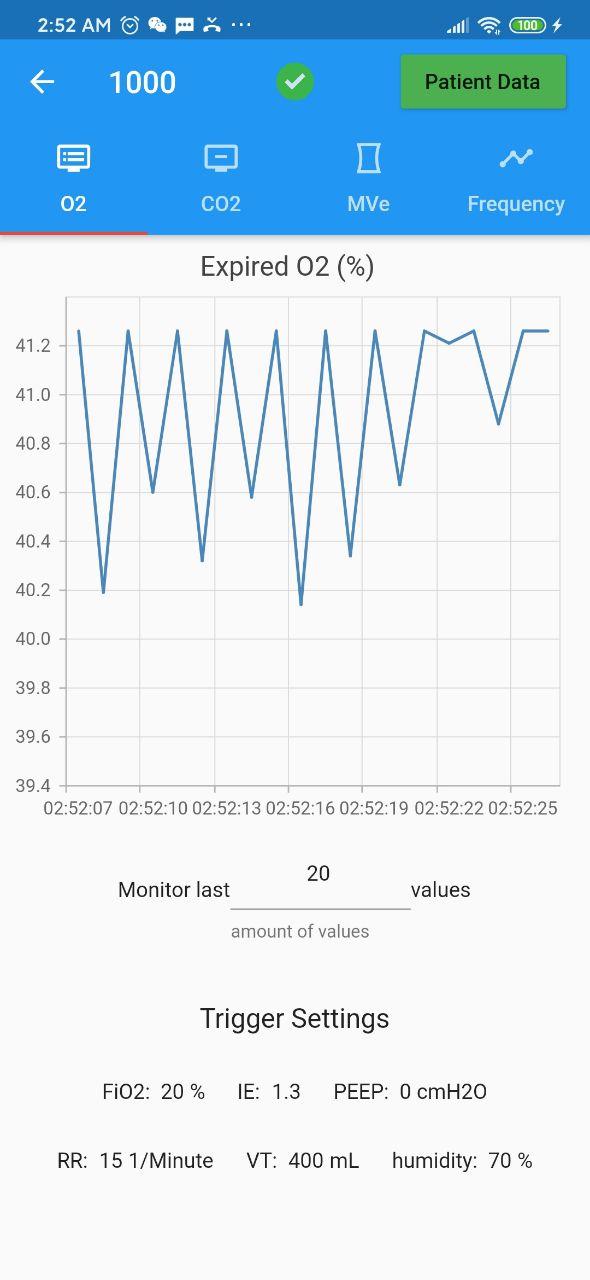
Figure 3: Real-time Curve of Expired O2 last 20s
-
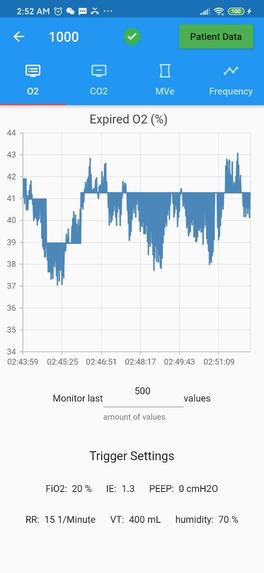
Figure 4: Real-time Curve of Expired O2 last 500s
-
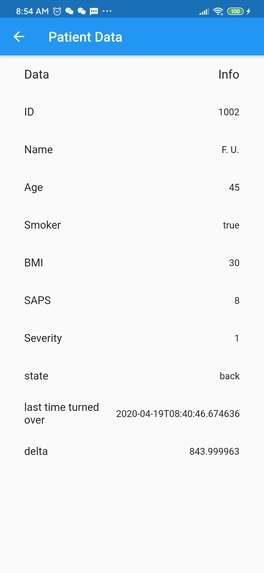
Figure 5: PatientData
-

Figure 1: TriggeredWarning


Inspiration
In December 2019 the first cases of Covid-19, a disease caused by the severe acute respiratory syndrome coronavirus 2 (SARS-CoV-2) were reported. Since then it has spread rapidly worldwide. According to the WHO, more than 2 million cases and around 146,200 deaths have already been documented worldwide. Older people and people with pre-existing conditions such as diabetes, cancer or chronic lung diseases are particularly at risk. The virus infects the lungs and can cause pneumonia. In severe cases mechanical ventilation is absolutely necessary. However, the devices are limited. Therefore, as part of the hackathon #WirvsVirus of the German government a project was initialized aiming to develop an open-source ventilator device. The OpenVent Project link focuses on simplicity, availability and scalability, which makes it a fast and user-friendly solution to the current problem. Thus, the device can be can be directly used in clinical practice to improve patients’ recovery and save lives. Our aim was to contribute to the OpenVent project by offering a software solution that allows medical staff to monitor multiple ventilators simultaneously via app. Besides, important or critical medical parameters are displayed and highlighted. Finally, data history is stored in a separate cloud, which can be reviewed manually by the user. In combination with the hardware solution, we want to develop a complete and applicable ventilation system that can be distributed and used as soon as possible.
What it does
The software is structured into a frontend and backend. The backend obtains its data from the different ventilation machines. Each ventilator has an ID, which is then assigned to the matching patient ID. Additional information about the patients risk factor, namely Simplified Acute Physiology Score (SAPS), is also entered to the backend. The combined data history is then transferred and stored in the server. Apart from that, the data is directly analyzed. Medical standard values for lung function were established on the basis of scientific sources (see References). Deviations from the standard were subdivided into different degrees of severity and evaluated with a scoring system. From the evaluations of the individual parameters an overall score was calculated to categorize the physiological condition of each patient into one of three severity groups. Furthermore, in case one of the basic parameters reaches a certain critical limit, a push message is triggered and sent to the app (see Figure 1). Other than that, the frontend (Flutter App) is requesting the data from the backend (Python web server with Flask) and displays it in an intuitive and user friendly way to the medical staff. The first screen shows a list of the current patients sorted by severity or time since last visit (see Figure 2). Right of every icon, a symbol indicates the severity score of the current condition. By tapping on the patient a second screen with the physiological data of the patient is displayed. Data is plotted in real-time. However, it can also be requested retrospectively and in selected time periods (see Figure 3 and 4). Another special feature is the display of the position of the Patient (see Figure 5). To release pressure from the lungs it is common to switch patients position between dorsal to abdominal for about four Hours. This treatment has an effect on the physiological values. Therefore, for example, the FiO2 level must be adjusted 30 minutes later. Our app provides information about the position as well as the duration since the last reallocation. For this purpose, the nursing staff can make an entry in the app, which is transferred to the backend and saved. This feature makes it possible to determine whether changes in individual parameters can be traced back to the position status. Furthermore, based on the history of data including the timestamps of each change of position it is possible to evaluate, which turning cycles have the best effect on the physical values. The resulting information can later be used in research to develop therapeutic guidelines.
How we built it
Our project is based on Flutter (frontend) and Python (backend) including a web server with Flask. The following key points how the program was built:
- Setting up the Python server
- Frontend: Design of user interface, Backend: Data Mining: setting up connection to API and server
- Frontend: Visualization of real-time data, Backend: Definition of object classes
- Implement functions to transfer information between frontend and backend
- Literature research about physiological values to generate the Severity Score.
- Adjust functions to real-time data
- Addition of extra functions
Challenges we ran into
- Adjustment of the sensitivity of severity score
- Server break downs
- Time objects cause problems when converting to Json format
- API responds too slowly to server requests
- Unstable API template, which also changed during the working process
Accomplishments that we're proud of
We are proud to have developed an app that processes data in real time and displays important information for the user. Especially the extra functions about the degree of severity and the position should help to optimize the treatment of patients.
What we learned
I personally can say that I have learned a lot from this project. It was the first major program I ever implemented and certainly not within a group. Nevertheless, it was a great experience. I benefited a lot from the support of my team mates and was able to acquire much new knowledge and manifest it through direct application.
What's next for Infineon Challenge: OpenVentApplication To be added
First of all, it would be important to ensure data protection, as the software processes sensitive patient data. Additionally, we suggest to adjust the critical values that trigger the alarm as well as the sensitivity of severity score according to the request of medical person. Other important features would be the integration of physiological data from other medical devices, such as heart rate and blood pressure. Besides, it would be interesting to store additional therapeutic measures such as drug administration in combination with the physiological values and characteristics (such as age, sex, pre-illness) of the patient und analyze them by machine learning algorithms. This would make it easier to identify correlations and help future patients by predicting the course of disease based on the recorded data and providing individualized therapeutic guidelines.
References
- Aumüller et al.: Duale Reihe Anatomie. 1. Edition Thieme 2006, ISBN: 978-3-131-36041-0. Schmidt et al. (Hrsg.): Physiologie des Menschen: mit Pathophysiologie. 31. Edition Springer 2010, ISBN: 978-3-642-01651-6.
- Silbernagl, Despopoulos: Taschenatlas der Physiologie. 6. Edition Thieme 2003, ISBN: 3-135-67706-0.
- Ulfig: Kurzlehrbuch Embryologie. 1. Edition Thieme 2005, ISBN: 3-131-39581-8.
- Vogt et al.: Bauchlagerung bei Beatmung – Schritt für Schritt. In: DMW - Deutsche Medizinische Wochenschrift. Vol: 144, Number: 14, 2019, doi: 10.1055/a-0665-6637, p. 978-981.
- Major, V. J., Chiew, Y. S., Shaw, G. M., & Chase, J. G. (2018). Biomedical engineer's guide to the clinical aspects of intensive care mechanical ventilation. Biomedical engineering online, 17(1), 169. https://doi.org/10.1186/s12938-018-0599-9
- Agasti, T. K. (2010). Textbook of Anesthesia for postgraduates. JP Medical Ltd.
Disclaimer: The material here is provided with no warranties explicit or implied. This project does not represent any official policies or procedures for medical advice.


Log in or sign up for Devpost to join the conversation.