-
-
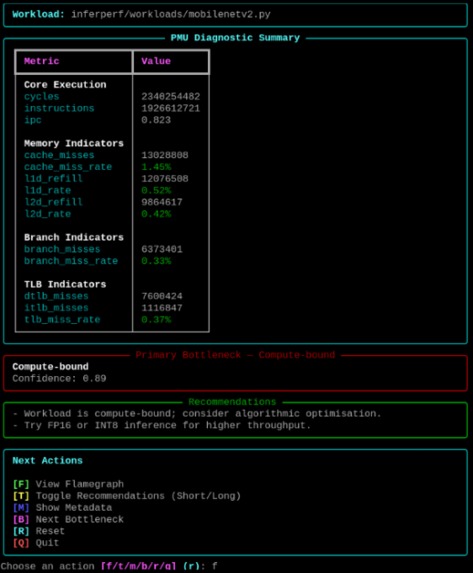
Example output from inferperf analyse showing PMU metrics, bottleneck classification, recommendations, and available actions.
-
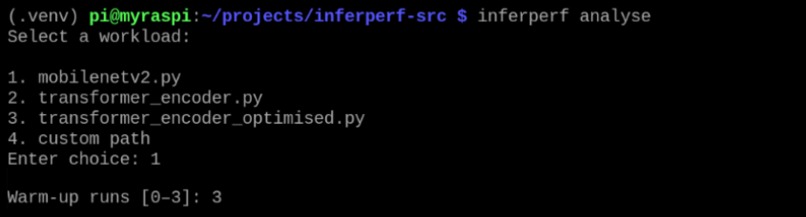
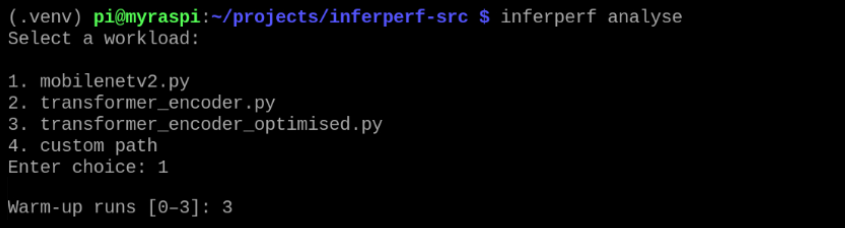
Example of guided selection menu prompt for the command inferperf analyse
-
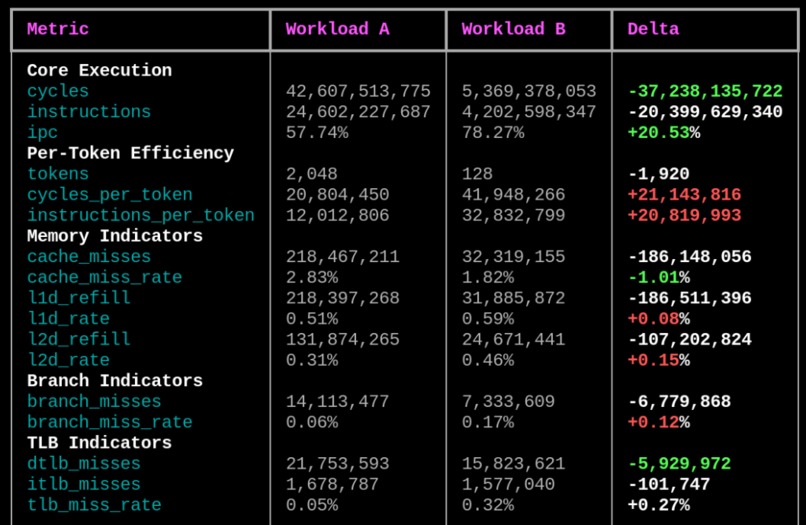
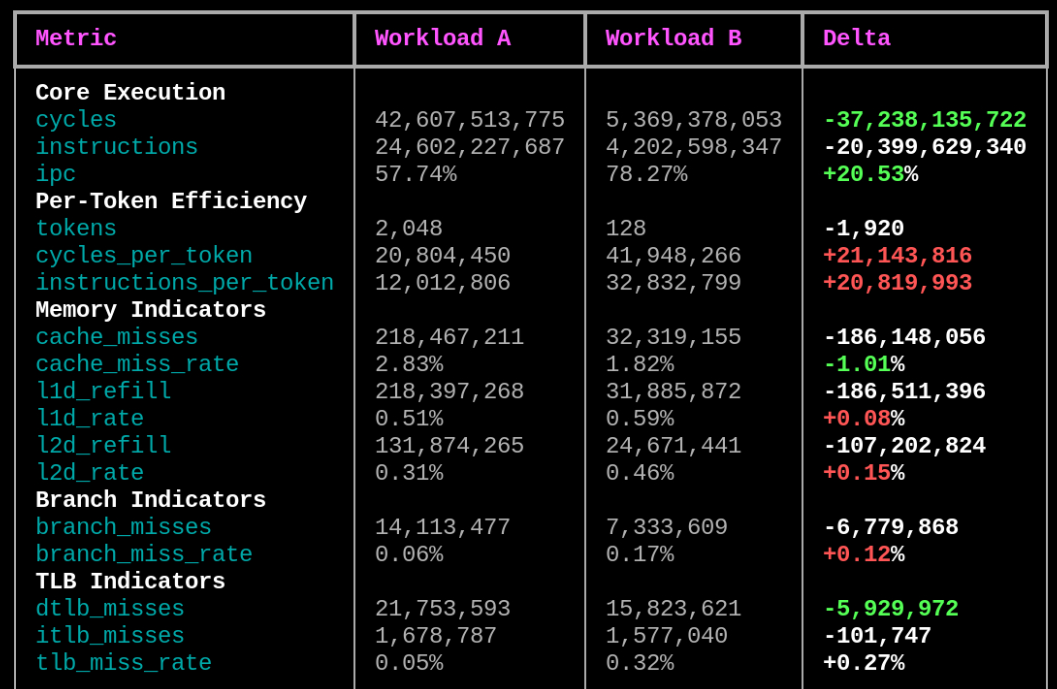
Output showing results of compare,py for the two demonstration workloads
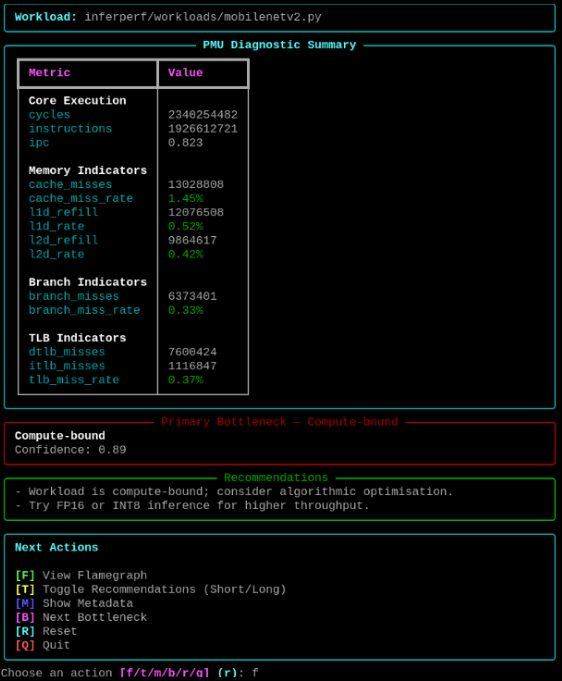
Inspiration
I knew from the start that I wanted to build something that would create real impact for AI engineers. Instead of refining a random model that might be obsolete in a few months, I wanted to build a tool that engineers could actually use - something practical, durable, and genuinely helpful for understanding and improving AI inference performance on Arm CPUs. I also wanted to build something that would remain useful no matter how much models evolve, rather than tying the project to a single architecture or trend. That goal shaped the entire direction of InferPerf.
A major motivation for the project was gaining visibility into the CPU itself. I have had a recent interest in CPU microarchitecture and wanted to understand whether there was a meaningful connection between low-level execution behaviour and higher-level AI workload characteristics. Existing inference tools focus on operators or model-level metrics, but they do not expose microarchitectural factors such as ILP limits, cache residency, TLB behaviour, branch predictor accuracy, or allocator overhead. As a result, engineers see latency and throughput, but not the underlying causes.
Bringing these motivations together, I wanted a practical tool that engineers could rely on while also exposing how low-level CPU behaviour influences higher-level AI workload performance. InferPerf was created to bridge that gap by profiling the CPU from the CPU's perspective and making those execution characteristics visible, stable, and actionable for AI engineers.
What it does
InferPerf is a PMU-driven AI inference profiler for Arm CPUs.
It reveals why an AI workload is slow by surfacing microarchitectural bottlenecks such as:
- IPC collapse
- L1 and L2 residency issues
- TLB churn
- Branch misprediction
InferPerf pairs PMU sampling with flamegraphs, steady-state runtime analysis, and workload regularisation to produce stable, reproducible performance profiles.
InferPerf is built around three simple commands:
analyse- run a workload, collect PMU data, classify bottlenecks, and generate flamegraphsvalidate- re-run the workload after an optimisation and compare it against the stored baselinecompare- compare any two workloads side-by-side, even if they were not part of the same optimisation cycle
This keeps the workflow simple and predictable: diagnose the workload, make a change, validate the improvement, or compare two different models or configurations. It is intentionally designed so the engineer can focus on optimisation while the tool handles the measurement and comparison steps without adding extra cognitive overhead.
It is important to note that InferPerf may seem similar to Arm Performix, however they are very different tools. InferPerf works alongside Arm Performix in a complementary way rather than intending to rival it: Performix explains what the model is doing, while InferPerf explains how the CPU is behaving while running it. Engineers can use the two simultaneously as Performix can show which operator is slow, while InferPerf shows why the CPU struggled to execute it.
InferPerf directly supports Arm's mission of making AI workloads efficient, predictable, and optimised on Arm CPUs by providing visibility into microarchitectural behaviour that model-level tools do not surface. It strengthens the Arm tooling ecosystem by giving engineers a lightweight, developer-friendly profiler focused specifically on CPU execution characteristics such as ILP limits, cache residency, TLB behaviour, branch predictor accuracy, and allocator overhead. These insights target a part of the inference pipeline that existing tools do not address, making InferPerf a practical way for engineers to understand why a workload is slow at the microarchitectural level.
Optimisation Results
Using InferPerf’s Analyse → Validate → Compare workflow, the transformer encoder workload achieved:
- +20.53 IPC uplift on Cortex‑A72
- Large reductions in cache, TLB, and branch misses
- 16× working‑set reduction (2048 → 128 tokens)
- Execution‑level improvements such as deterministic inputs, preallocation, persistent sessions, and hot‑path minimisation
These results were fully reproduced and validated using InferPerf’s PMU-driven profiling pipeline.
How I built it
InferPerf is built as a lightweight, CLI-driven profiling pipeline, but each part of that pipeline needed careful engineering to make the data stable, trustworthy, and actually useful.
The Python inference harness was the first component I focused on. I needed it to behave predictably under PMU sampling, so I added warmup passes to ensure the CPU was in a steady state before collecting any counters. This removed first‑run effects such as slow initial memory access and frequency ramp‑up, which made IPC and stall behaviour stable enough to analyse. Once the warmup system was in place, the profiler produced repeatable data that could be used reliably by the bottleneck classifier.
For PMU access, I used key hardware counters via perf. Selecting the right events and sampling frequency required experimentation, because some counters behave differently on Cortex‑A72 and certain combinations produce inconsistent or misleading output. I also found that perf results varied depending on the version and how it was built on the system. The final configuration uses a small, selective set of stable events that reliably capture ILP behaviour, cache activity, and branch performance without producing noisy or contradictory data.
Flamegraph generation uses Brendan Gregg's tooling (perf, stackcollapse, flamegraph.pl), but making it work smoothly on Arm required tuning. I built an automated path that records stacks, collapses them, and generates SVGs without manual steps. The goal was to make flamegraphs a normal part of the workflow that are readily available to the user, but not immediately thrown in their face if they don’t want to see them.
The bottleneck classifier was built to translate raw PMU counters into categories engineers can act on. It is intentionally simple – no ML or opaque heuristics – just clear logic based on ratios, stall patterns, and residency behaviour. The classifier evaluates ILP limits, cache activity, branch behaviour, and TLB usage, then assigns a bottleneck type that reflects the dominant microarchitectural constraint observed during analysis.
Alongside the classification, InferPerf provides tailored recommendations that are specific to AI engineers and AI workloads. Each recommendation is tied directly to the PMU signals detected, ensuring the guidance is relevant to the actual execution characteristics rather than generic CPU advice. Recommendations can also be toggled to reveal deeper technical detail when needed, allowing engineers to expand the information only when they want it. This keeps the main output clean while still giving access to actionable optimisation steps grounded in the underlying microarchitecture.
For workloads, I used one MobileNetV2-7 vision model and MiniLM-L12 for the transformer workload. Inputs were regularised and fixed so that every run behaved the same way, avoiding variation from dynamic shapes or allocation paths. This kept the profiler focused on CPU behaviour rather than model randomness.
Challenges I ran into
Understanding Arm-specific guidance and choosing the right tooling. Arm's PMU documentation is scattered across architecture manuals, kernel notes, and tooling references, which made it difficult to map events correctly and decide when to rely on
perf, pmu-tools, or custom sampling. A lot of time went into stitching these sources together into a coherent workflow.Stabilising inference workloads so IPC and PMU signals were meaningful and reproducible. Cold-start effects made early runs noisy due to allocator setup, cache coldness, and DVFS ramp-up. To mitigate this, I built a configurable warmup system that performs 1–3 pre-inference passes to bring the CPU, runtime, and memory allocator into a steady state before profiling. This dramatically improved PMU stability and made the bottleneck classifier far more reliable.
Model size limits on the Raspberry Pi 4B. I could not push model sizes high enough to break out of the caches without crashing the Raspberry Pi 4B. Anything large enough to stop being compute-bound caused instability or full system crashes, limiting exploration of memory-bound behaviour.
Only secondary bottlenecks were optimisable. As a result of the above, I could only optimise secondary bottlenecks rather than the primary compute-bound bottleneck. This still produced meaningful improvements - for example, reducing ILP-limited behaviour or improving L1 residency - but naturally it was not as satisfying as seeing the top bottleneck confidence score drop. The hardware ceiling meant the primary bottleneck remained fixed no matter how much optimisation I applied.
Building InferPerf as a solo developer. Every subsystem - PMU integration, perf tooling, workload stabilisation, flamegraphs, classifier logic - had to be designed, debugged, and validated by me alone. It made progress slower, but it also meant the architecture stayed coherent. It is interesting to consider how a team might have changed the trajectory: faster parallel development, or more communication overhead and less unity of design.
Accomplishments I am proud of
- Achieving +20.53 IPC uplift on Cortex-A72 through workload regularisation
- Building a stable, automated flamegraph workflow tailored for Arm inference workloads
- Creating a bottleneck classifier that turns raw PMU counters into readable insights
- Producing a tool that is genuinely useful to Arm engineers
- Making AI inference profiling on Arm transparent, not mysterious
What I learned
I learned quickly that PMU data only becomes meaningful once the workload is properly warmed and stabilised. Before adding warmup passes, the counters were inconsistent because the CPU was still ramping clocks, touching cold memory, and setting up allocators. After stabilising the runtime, the numbers became repeatable and actually reflected the processor's behaviour.
I also realised that operator-level profiling does not explain much on its own. Most of the useful insights came from the CPU side - ILP limits, cache residency, branch behaviour, allocator patterns. Looking at the microarchitecture answered questions that model-level tools simply cannot.
Another takeaway was how much impact small structural changes can have. Preallocating buffers, shaping inputs, and cleaning up hot paths consistently moved IPC more than any model tweak I tried. Practical, low-level adjustments often mattered more than high-level optimisation ideas.
Working on the Raspberry Pi 4B also made the Cortex-A72's constraints very clear. It handles compute-bound workloads predictably, but once the model size pushes toward memory-bound behaviour, the system becomes unstable. Understanding that limitation helped me interpret the profiler's output realistically.
I also had to think carefully about how much complexity to expose. PMU data can get extremely technical, but oversimplifying it makes it useless. A lot of the design work went into finding a middle ground - showing engineers why something is happening without requiring them to already be microarchitecture experts.
What is next for InferPerf - PMU-Driven AI Inference Profiler for Arm CPUs
Expanding InferPerf to the Raspberry Pi 5. The Pi 5's stronger CPU, better thermals, and improved memory subsystem would finally allow models large enough to exceed cache capacity without crashing, unlocking true memory-bound profiling. Fingers crossed I can get my hands on a Pi 5 soon and put this to the test!
Making InferPerf accessible on any Arm platform. The long-term vision is a portable, reliable profiler that works across the entire Arm ecosystem, regardless of whether it is running on a Raspberry Pi, an Arm laptop, a mobile SoC, or a cloud Arm server.
Getting real users to test InferPerf and provide feedback. I would love to have the opportunity for other engineers to test InferPerf on their own workloads and provide meaningful feedback on their experience of the tool. This could allow me to expand and upgrade InferPerf using real information from real people, going beyond the initial creation of the tool that was built simply on my own intuition.
Ultimately, I would love for InferPerf to continue evolving as a tool, whether through new features or broader accessibility across different Arm platforms, so it remains a reliable way for engineers to understand CPU behaviour as AI workloads and hardware continue to advance.

Log in or sign up for Devpost to join the conversation.