-
-
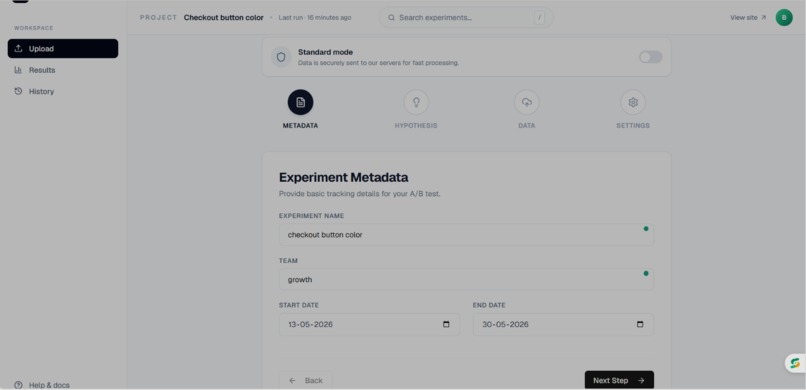
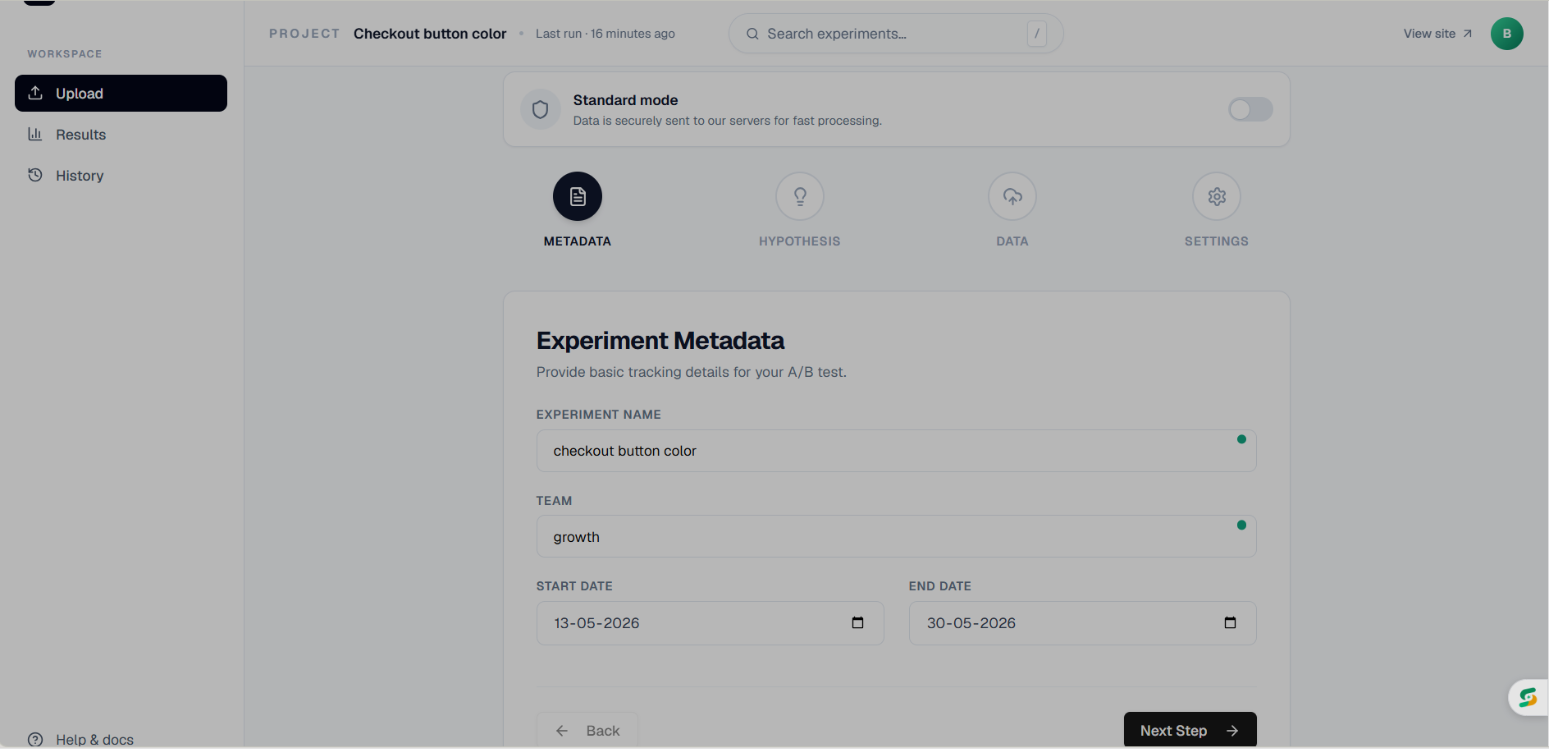
Experiment Metadata
-
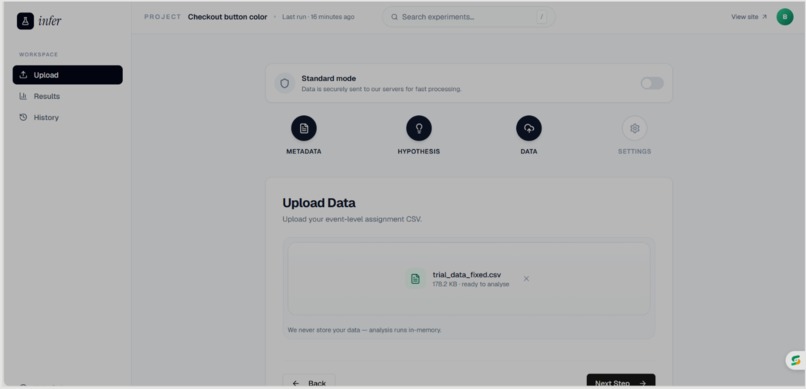
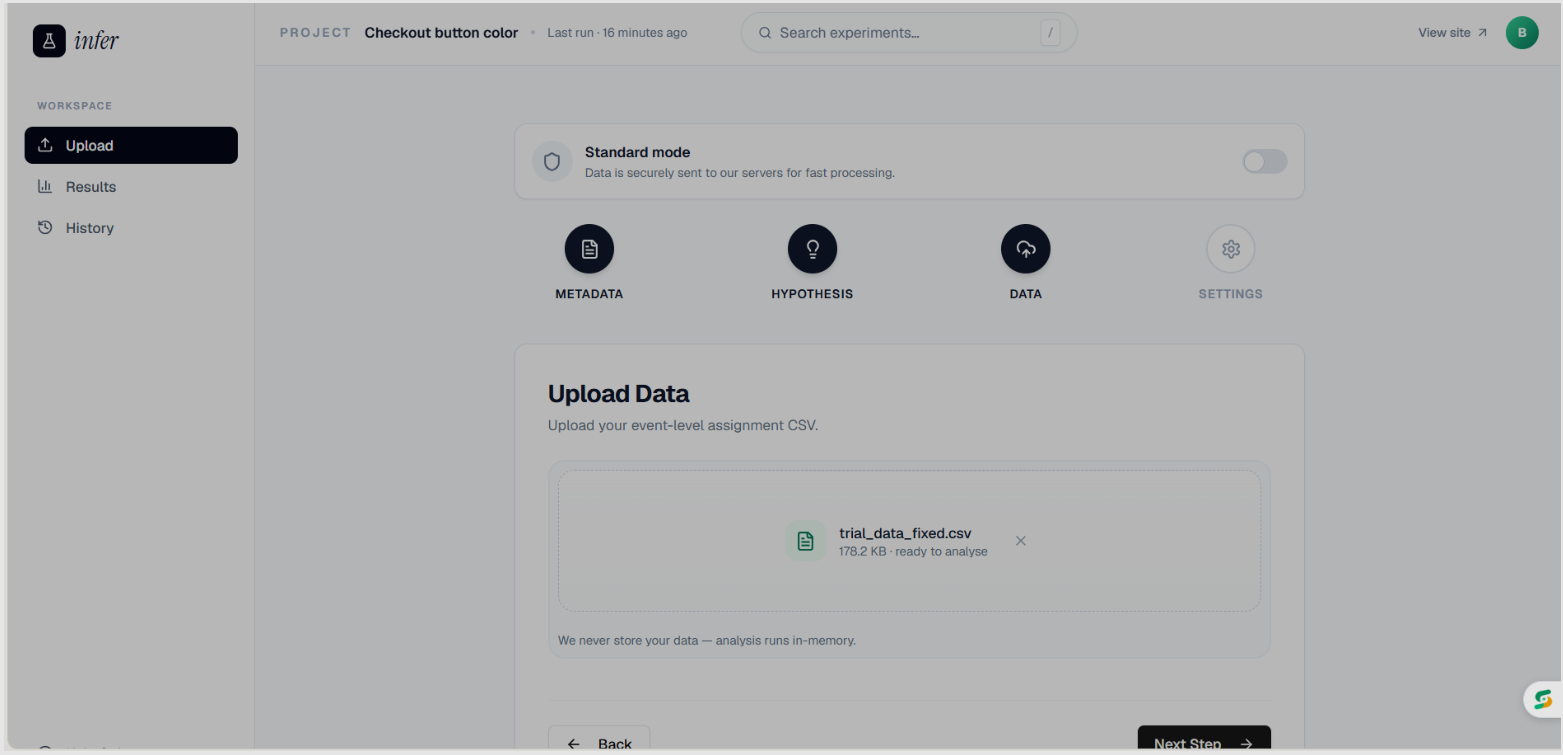
CSV Upload page
-
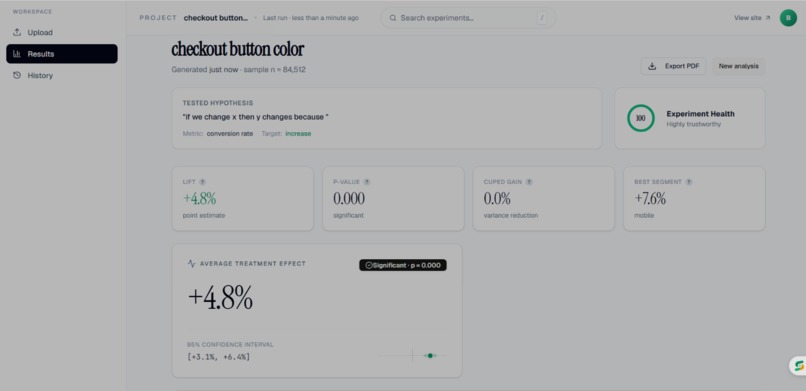
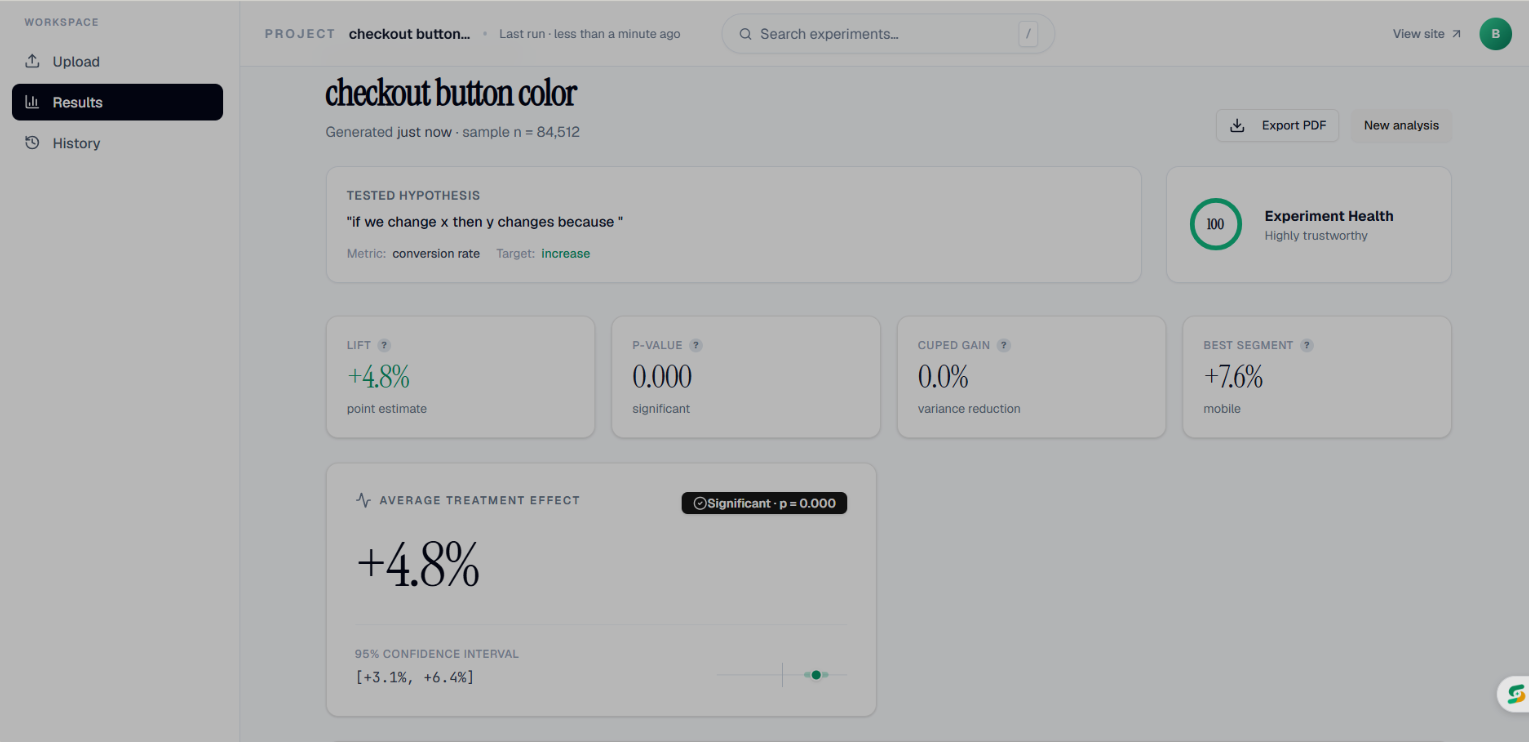
main dashboard page
-
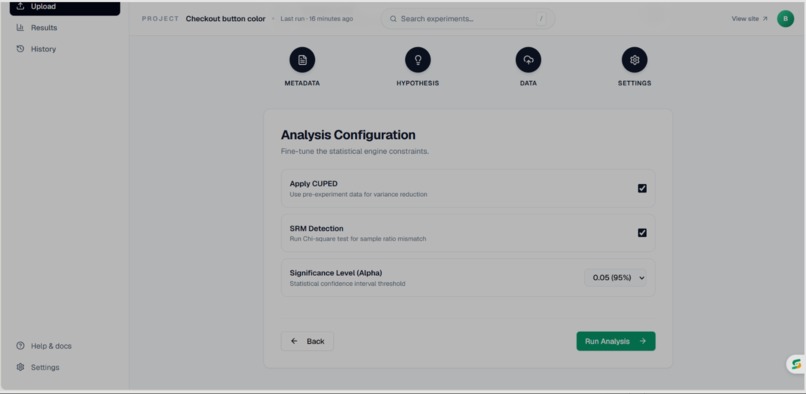
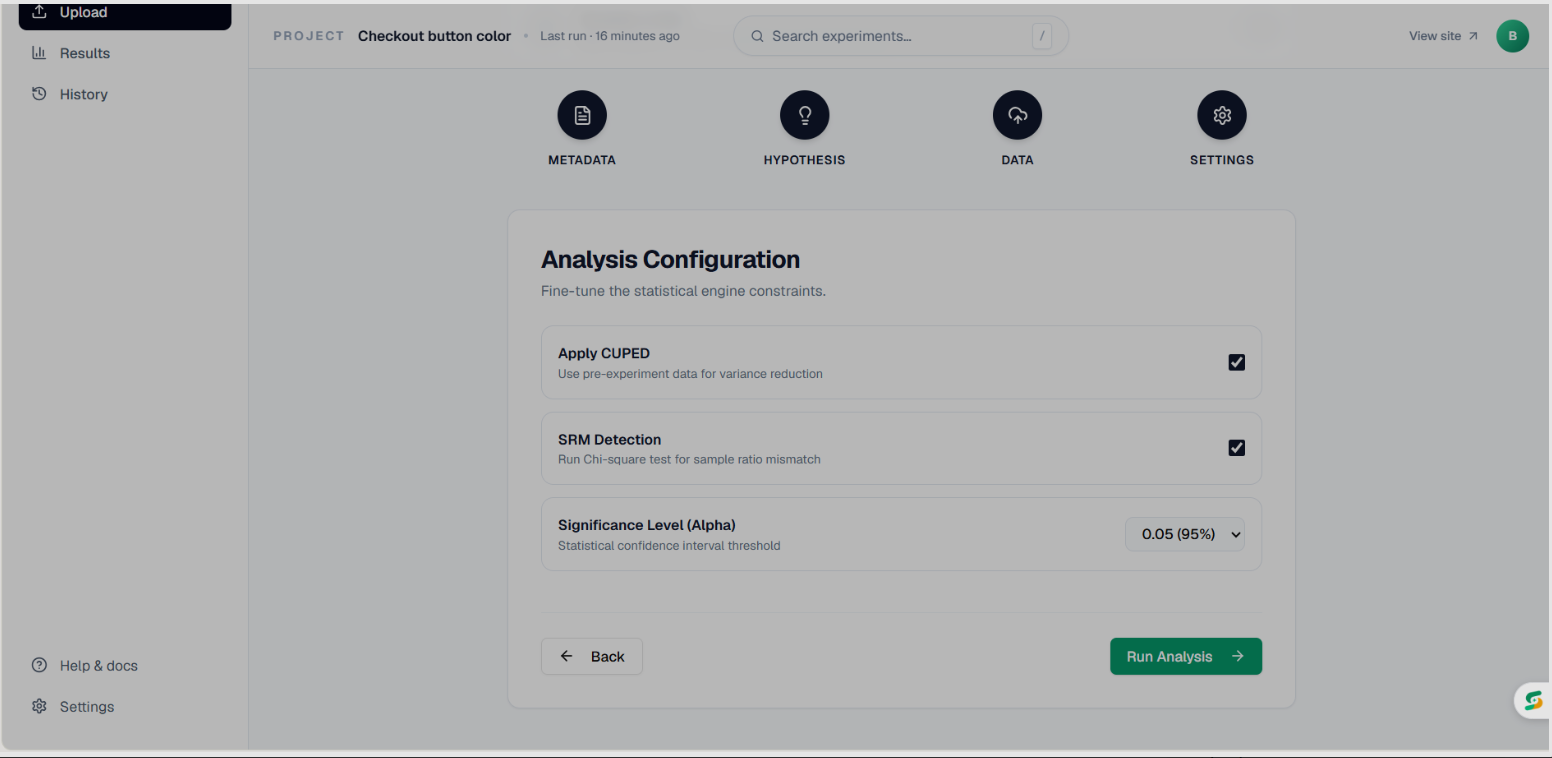
Analysis configuration page
-
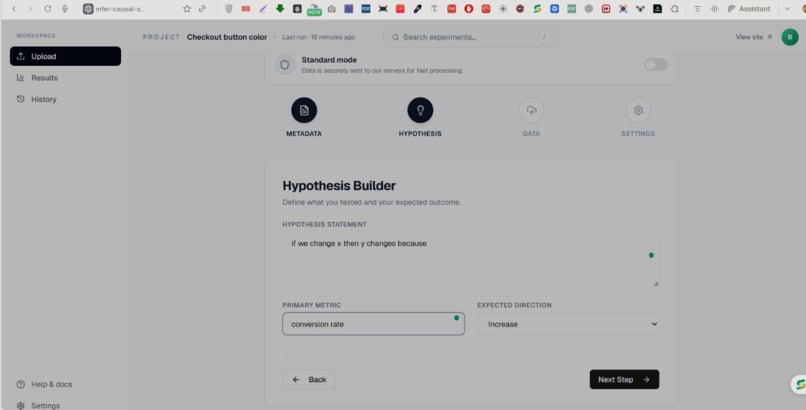
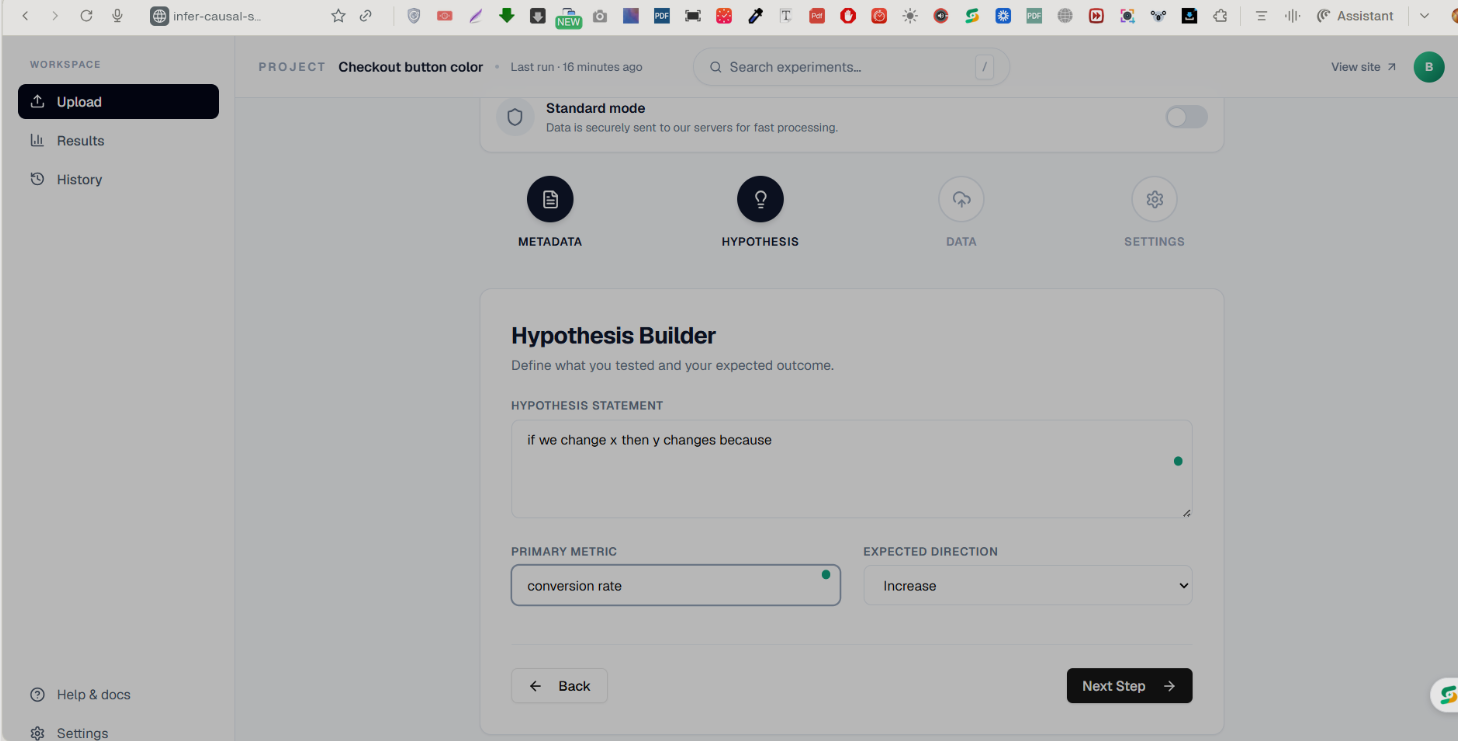
Hypothesis builder page
-
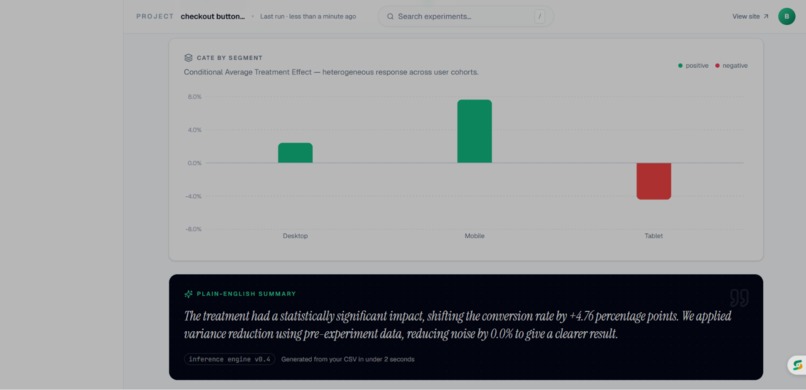
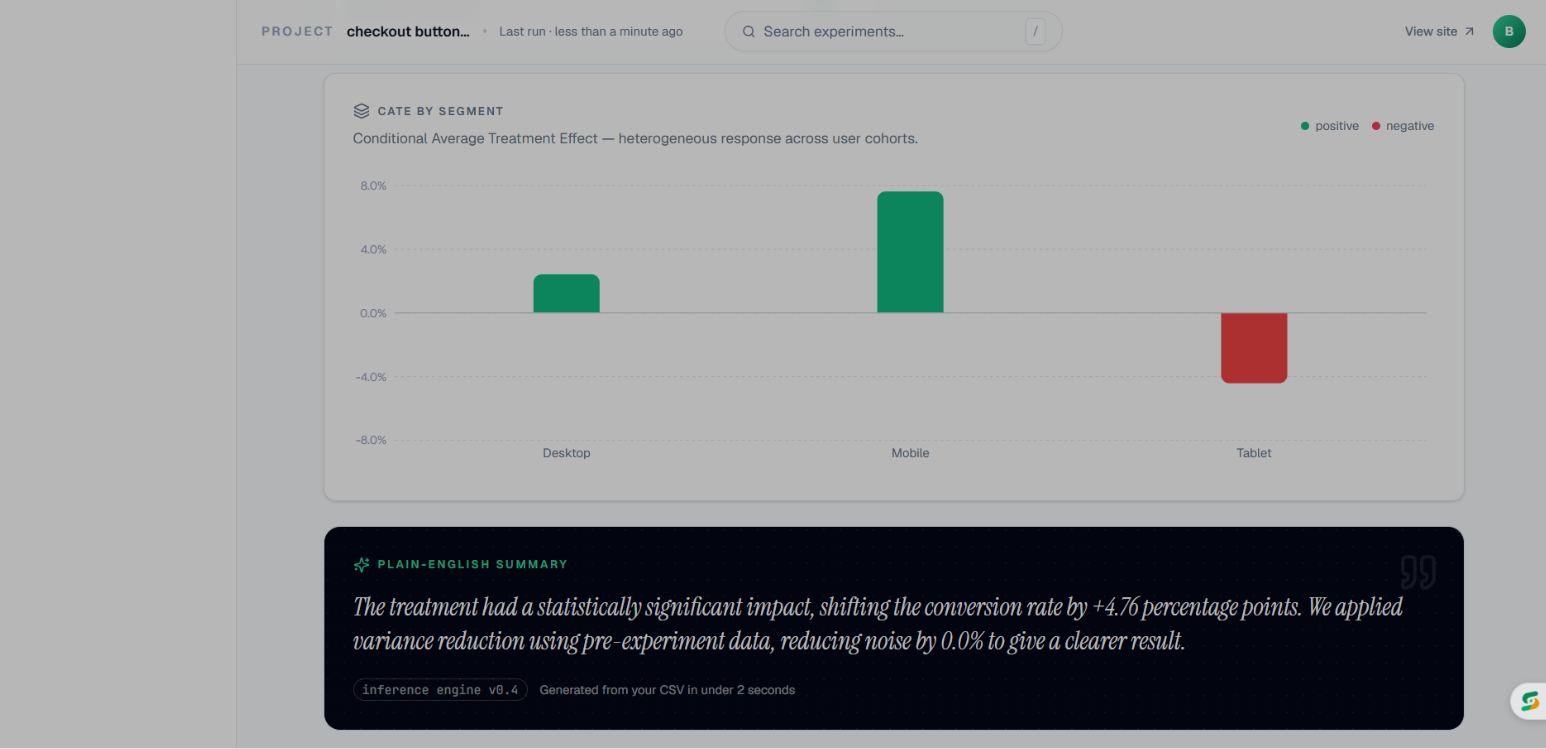
CATE by Segment and summary
-
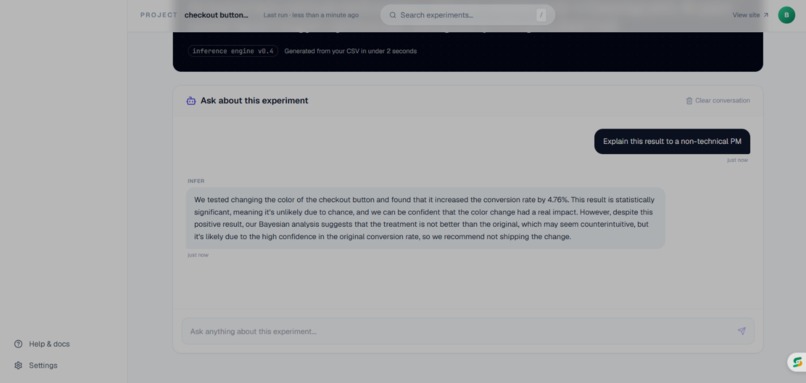
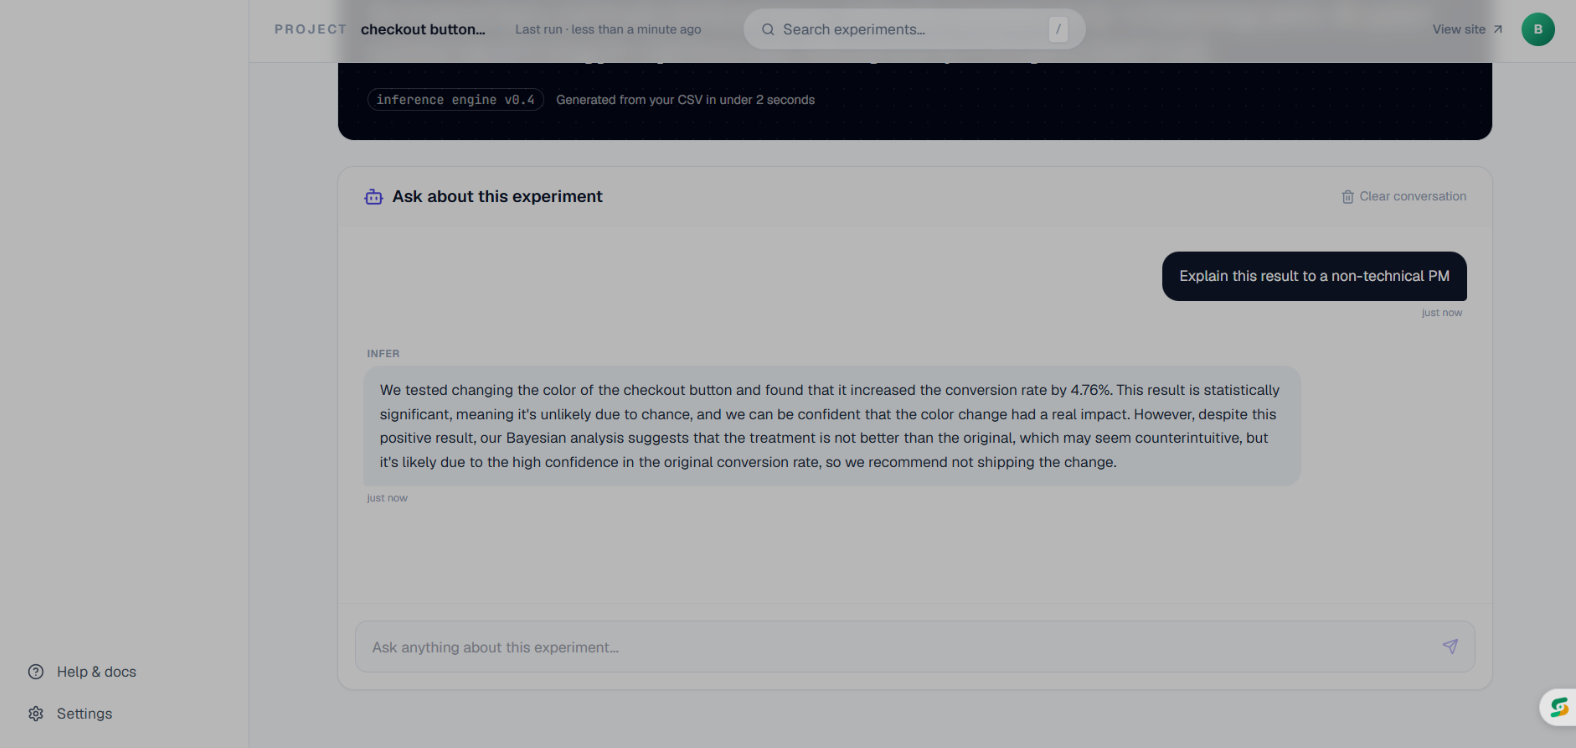
AI Chat
-

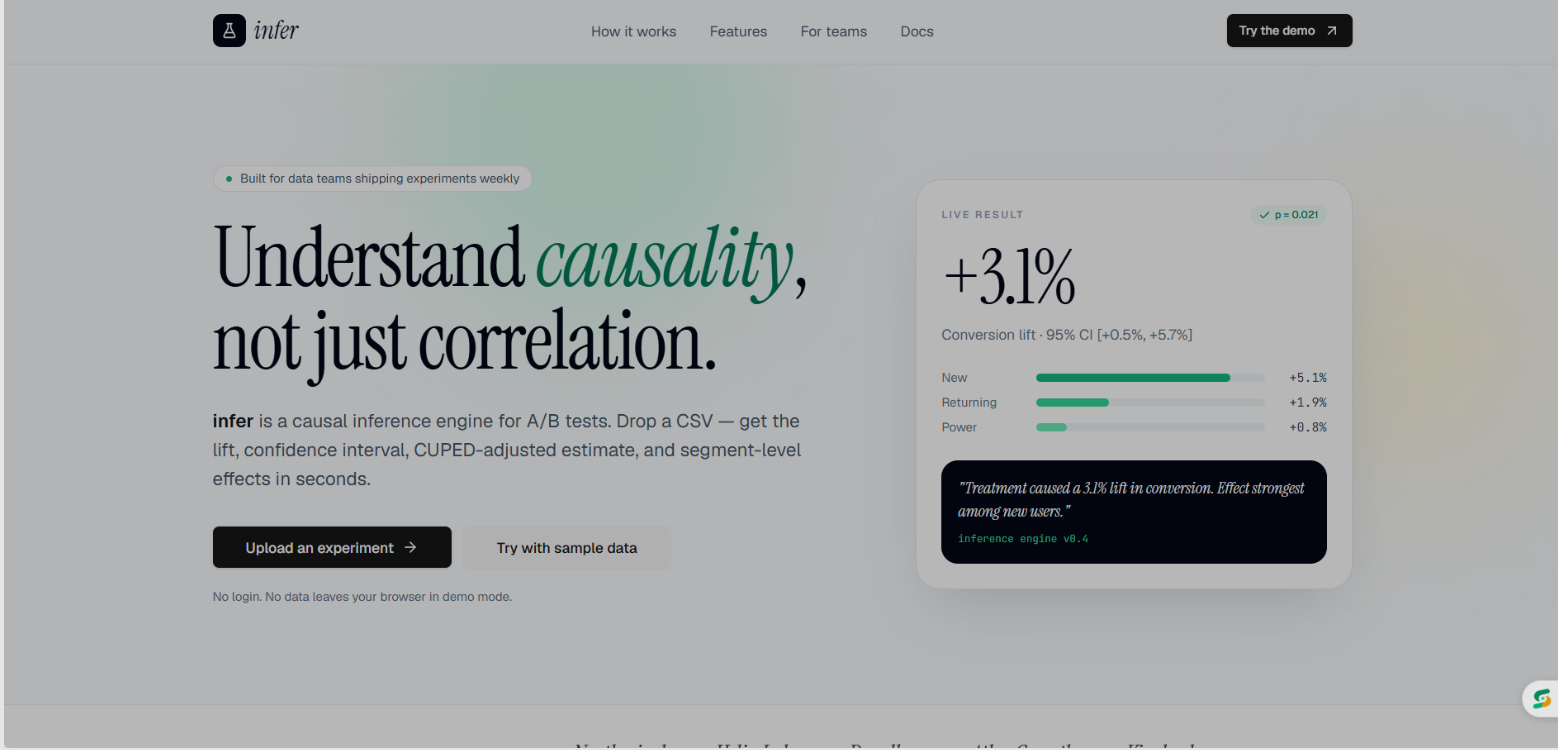
Home page
Inspiration
Every PM I've spoken to has lived this exact moment: the experiment finishes, the data is sitting there, and you're waiting 2–3 days for a data scientist to run a script they've essentially run before.
That's not a talent problem. It's a tooling problem.
The bigger issue is that when the analysis does arrive, it's usually a single p-value from a basic t-test. No variance reduction. No segmentation. No check on whether the randomization was even valid. Just a number and a "looks good."
I wanted to build the tool that closes that gap — something that runs production-grade statistical analysis automatically and then explains what it means in plain English, without requiring anyone to write a line of code.
What it does
Infer is a full-stack causal inference and A/B testing platform. You upload an experiment CSV, and the platform runs six statistical analyses simultaneously:
- ATE (Average Treatment Effect) — the core causal impact of your treatment
- CUPED — variance reduction using pre-experiment covariates, which reduces the sample size needed to reach significance
- CATE (Conditional Average Treatment Effect) — segments results by user attributes to surface heterogeneous effects ("works for new users, not existing ones")
- Sequential Testing (SPRT) — Wald's test for early stopping without inflating Type I error
- Bayesian Inference — probabilistic confidence intervals beyond p-values
- SRM Detection — chi-square test that flags broken randomization before you trust any result
After the stats engine runs, a Groq/Llama-3 AI layer reads the full output and generates a business recommendation — not a stats summary, an actual decision: "Roll this out to new users only before a full launch."
The platform also includes experiment history with SQLite persistence, interactive charts (Recharts), one-click PDF export, and JWT-based multi-user authentication.
How we built it
Backend: Python 3.11 + FastAPI. All statistical logic lives in a dedicated
stats_engine.py module — separating computation from routing made it easier
to test each method independently. NumPy and SciPy handle the heavy lifting;
Pandas manages the CSV ingestion and validation pipeline.
AI Layer: Groq API with Llama-3 70B. The prompt is context-aware — it receives the full statistical output alongside the experiment name and metric, so the AI interpretation is specific to your data, not a generic template response.
Frontend: React 18 + Tailwind CSS. Charts are built with Recharts. The UI was designed to surface the most decision-relevant outputs first — the AI summary and ATE at the top, with deeper statistical outputs below for users who want to go further.
Database: SQLite via SQLAlchemy ORM. Every analysis is persisted — searchable, renameable, and exportable.
Auth: JWT tokens with Passlib password hashing for secure multi-user access.
Challenges we ran into
CUPED implementation correctness. The math behind CUPED variance reduction is straightforward on paper — regress out the pre-experiment covariate and adjust the metric. Getting it to handle edge cases correctly (missing pre-experiment data, zero-variance covariates) without silently failing took significant iteration.
Making the AI output genuinely useful. The first versions of the AI interpreter were too generic — they restated the statistics in slightly different words. The breakthrough was restructuring the prompt to force the model to make a concrete recommendation rather than summarize. That required multiple prompt engineering iterations.
SRM detection UX. A triggered SRM warning invalidates the entire experiment, but displaying that clearly without alarming users who had minor ratio drift (vs. genuine randomization failure) required careful threshold calibration and UI copy.
CSV validation robustness. Real experiment exports are messy. Building validation that catches missing columns, wrong data types, duplicate user IDs, and unsupported variant labels — with clear user-facing error messages — was more work than the stats logic itself.
Accomplishments that we're proud of
The CUPED + CATE combination is what separates Infer from every "A/B testing tool" portfolio project. CUPED means you can reach significance faster with smaller samples. CATE means you don't just know if an experiment worked — you know who it worked for. Together, they turn a binary "ship/don't ship" into a segmented rollout strategy.
The AI layer being decision-oriented rather than summary-oriented is a product instinct I'm particularly proud of. The difference between "p-value is 0.003" and "roll this out to new users before a full launch" is the difference between data and a decision.
Building the full product end-to-end — stats engine, AI integration, React frontend, auth, persistence, export — as a solo student project demonstrated that this kind of internal tooling, which growth-stage companies typically build in-house, can be productized and shipped.
What we learned
Statistical rigor and product usability are in tension. The technically correct output (six methods with confidence intervals and test statistics) is also the most overwhelming output for a non-technical user. The solution was layered disclosure — AI summary first, raw stats available below. That hierarchy took multiple UI iterations to get right.
Prompt engineering is real engineering. Getting the AI to produce consistently useful, specific, non-hallucinated business recommendations required the same systematic debugging process as the stats engine. Vague prompts produce vague outputs. Structured, context-rich prompts with explicit output constraints produce recommendations you can actually act on.
Separation of concerns pays off fast. Keeping stats_engine.py isolated
from routing and the AI layer meant I could debug statistical logic independently
and swap the AI provider without touching the core analysis code.
What's next for Infer - AI-Powered A/B Testing & Causal Inference Platform
- Multi-metric analysis — analyze conversion rate and revenue simultaneously in a single experiment run
- Experiment comparison view — A vs B vs C with side-by-side statistical outputs
- Slack/email alerts — notify teams automatically when an experiment reaches significance or triggers SRM
- Cloud deployment — Docker + Railway/Render for a publicly hosted version
- CSV template generator — reduce upload friction for teams exporting from Mixpanel, Amplitude, or internal databases
- Covariate auto-detection — automatically identify the best pre-experiment metric for CUPED from the uploaded dataset

Log in or sign up for Devpost to join the conversation.