-
-
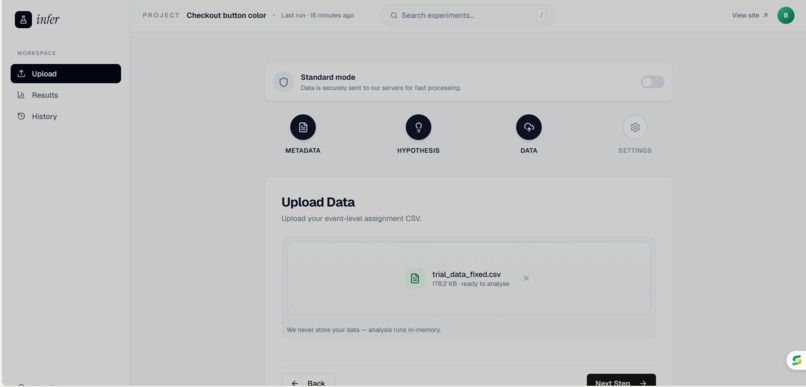
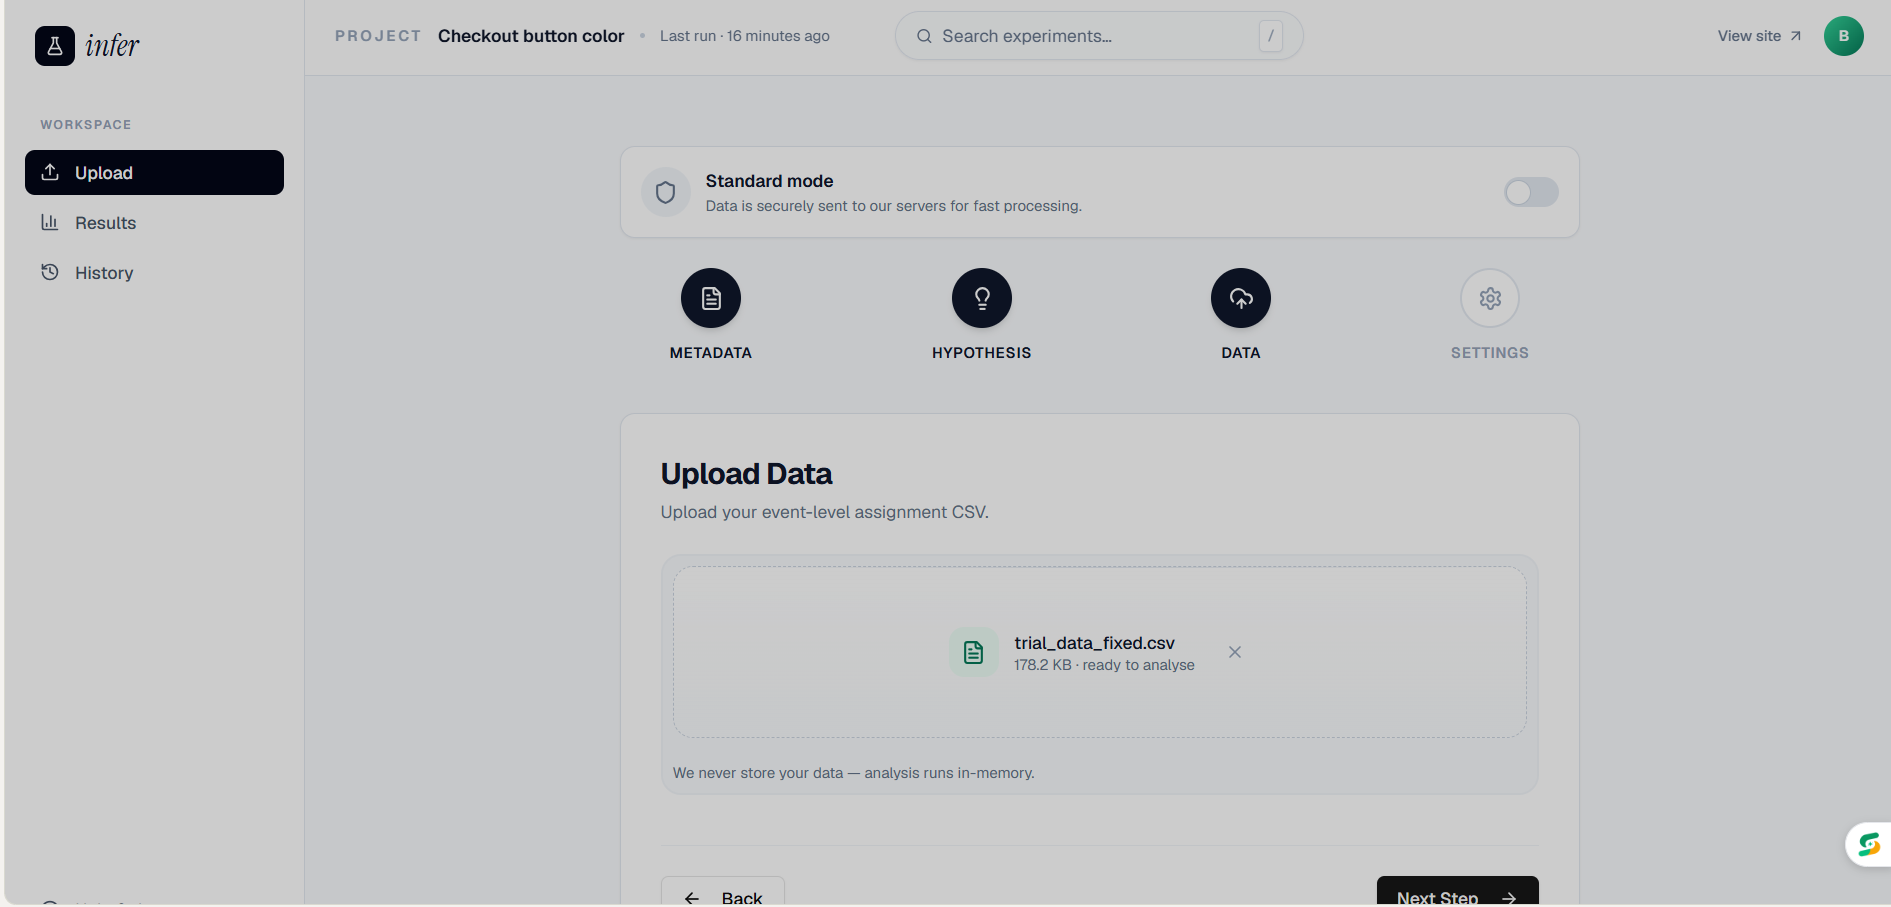
Upload data page
-
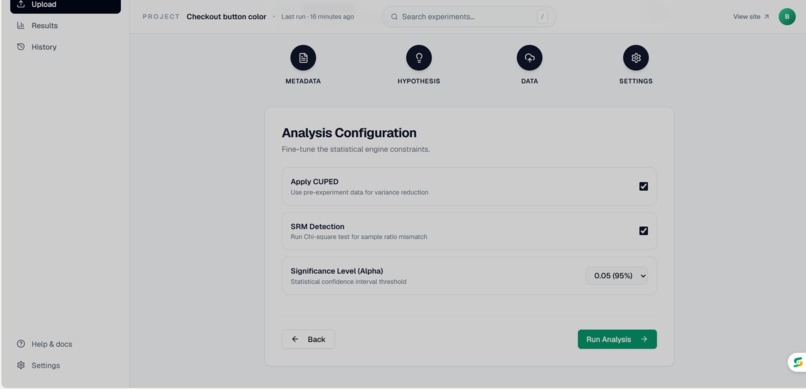
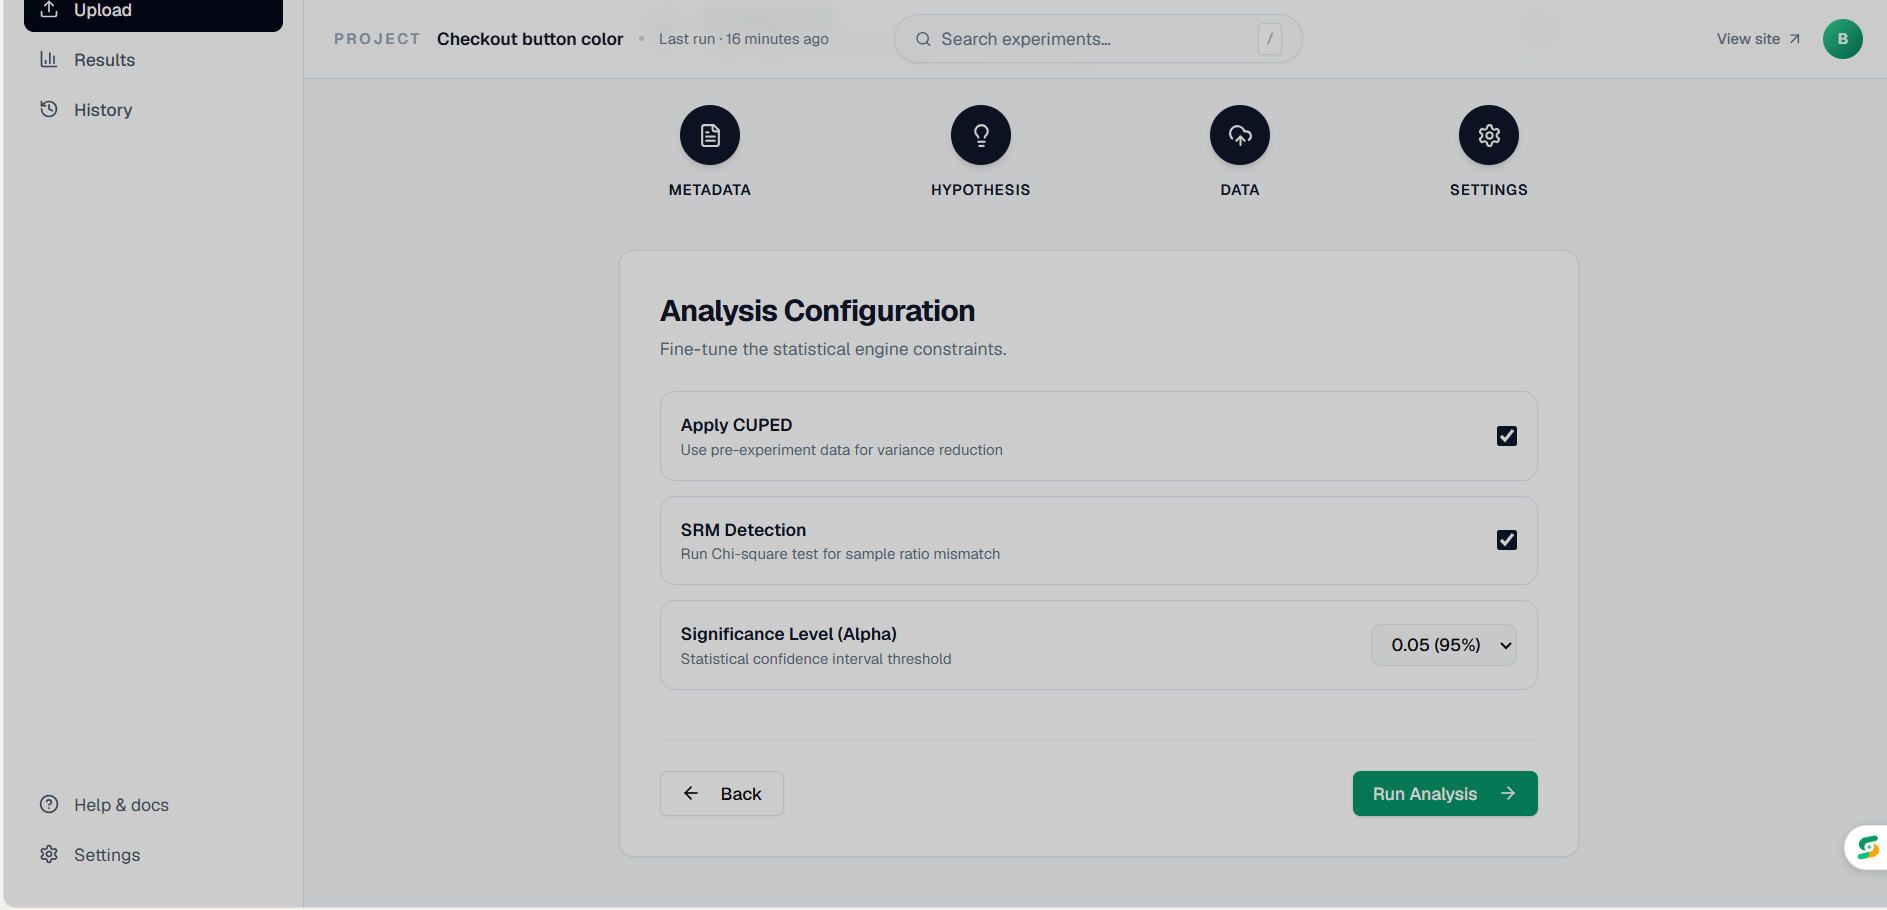
Analysis configuration page
-
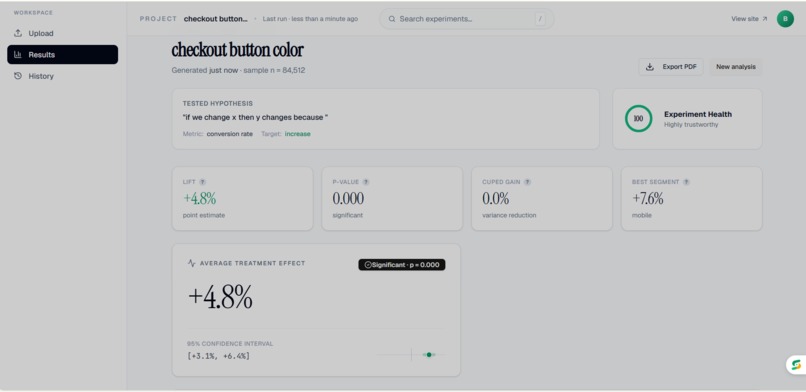
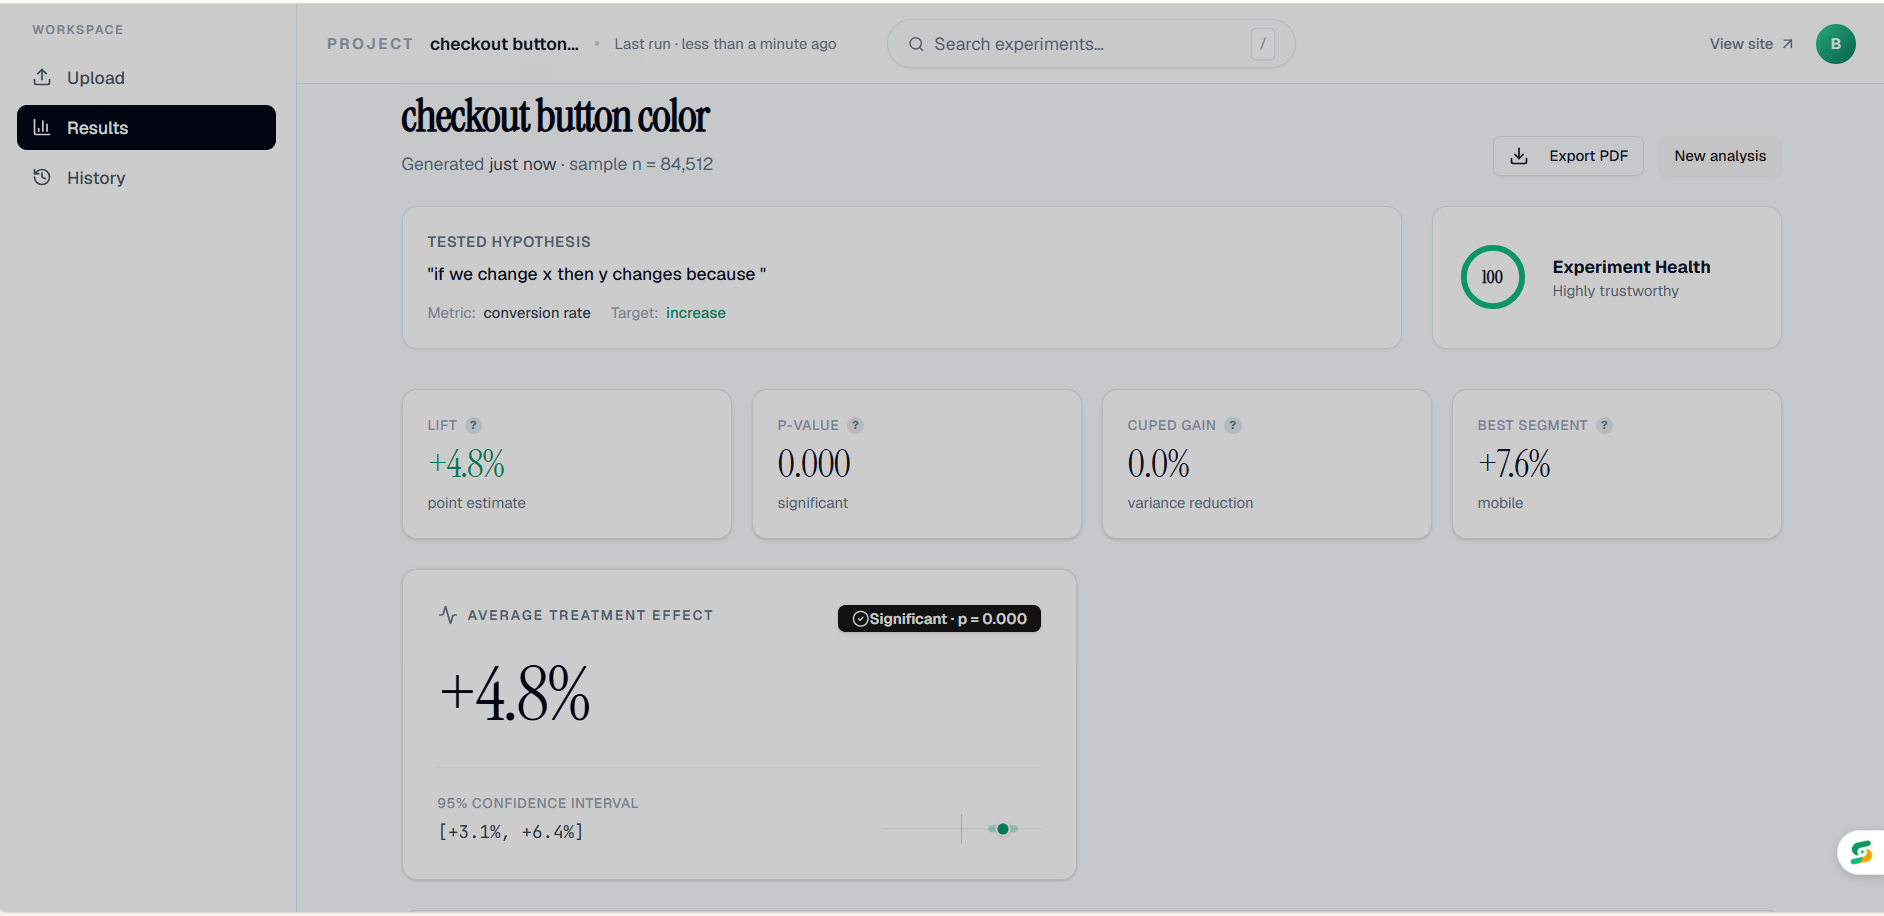
Main dashboard page
-
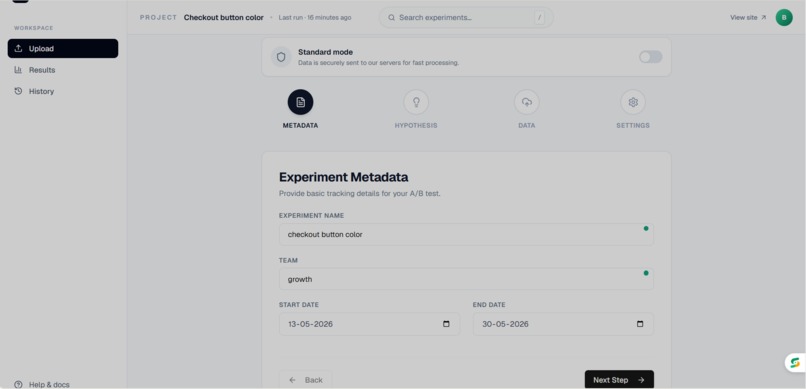
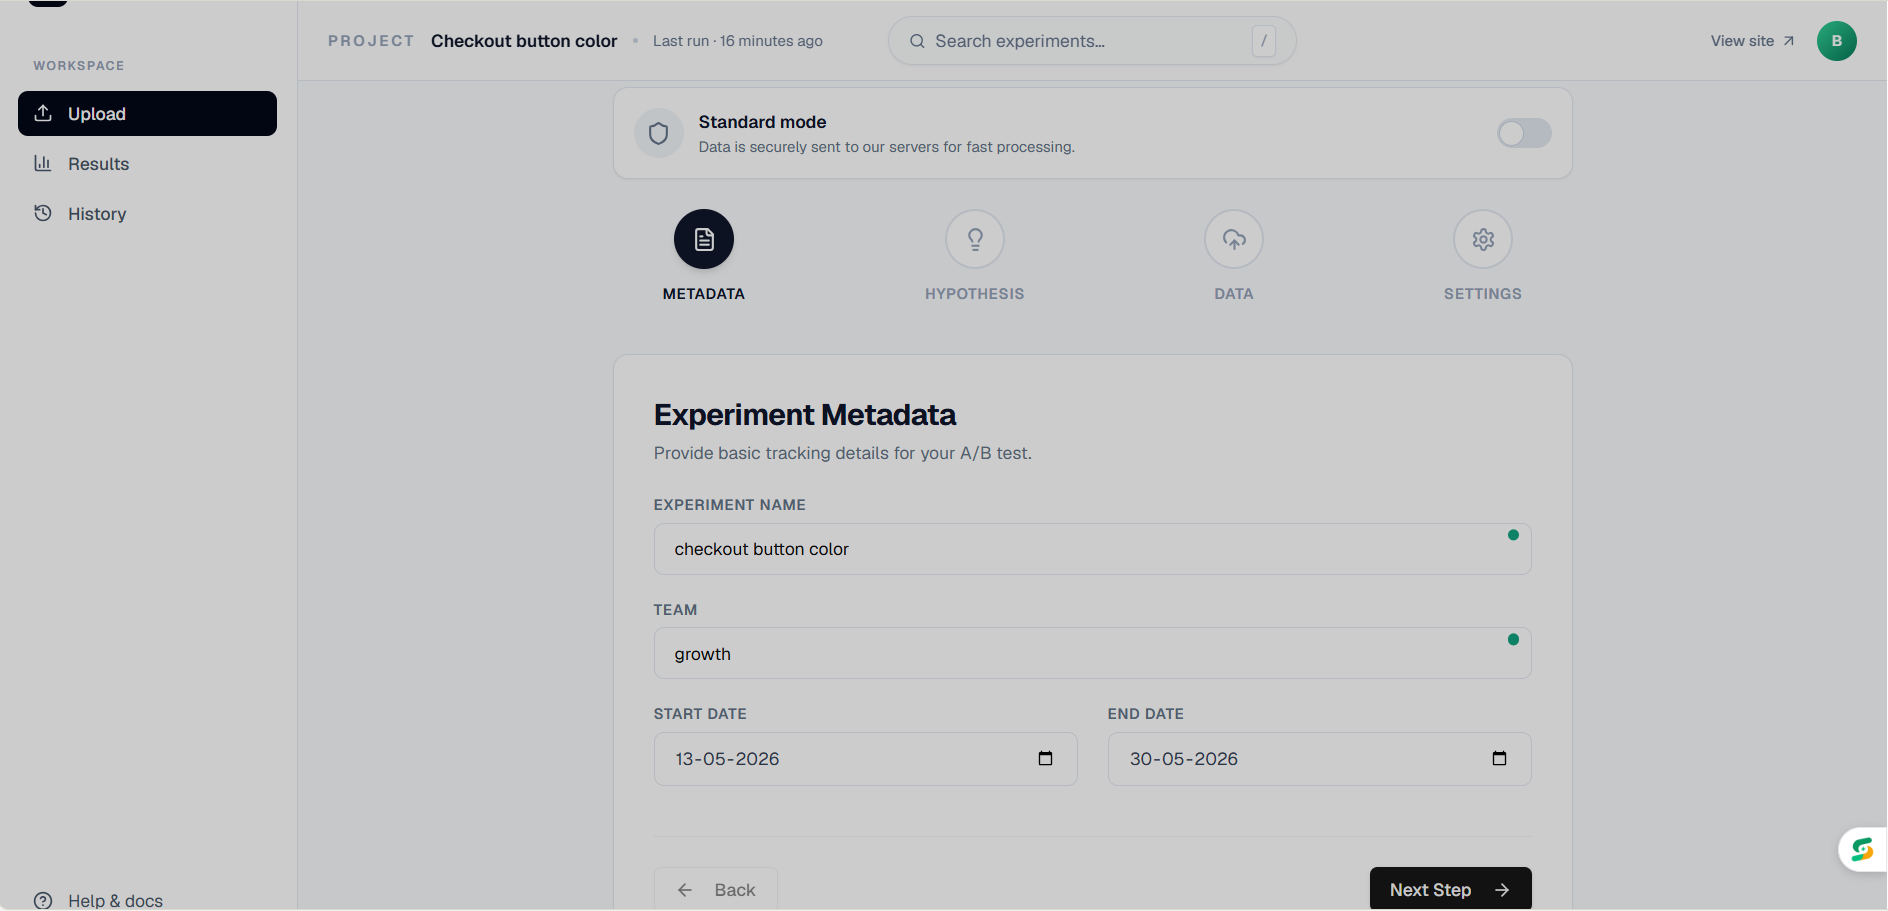
Adding Metadata page
-
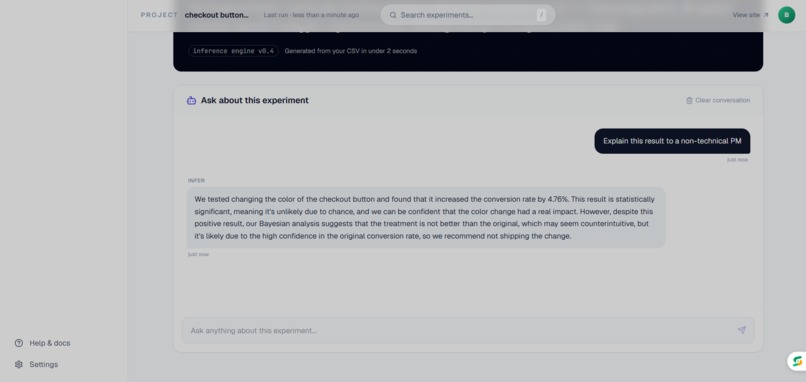
Main dashboard page - AI interpreter
-
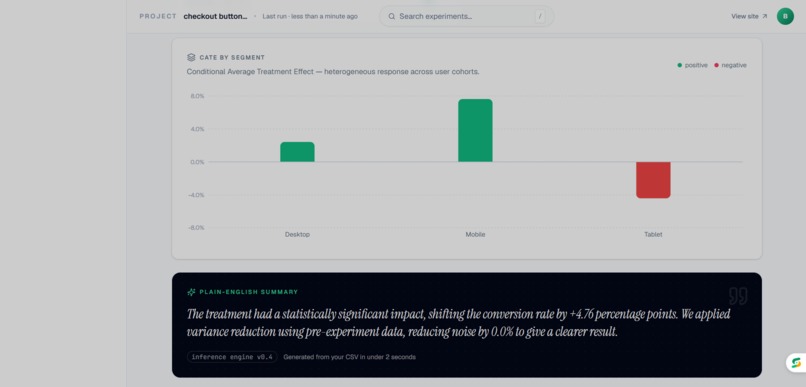
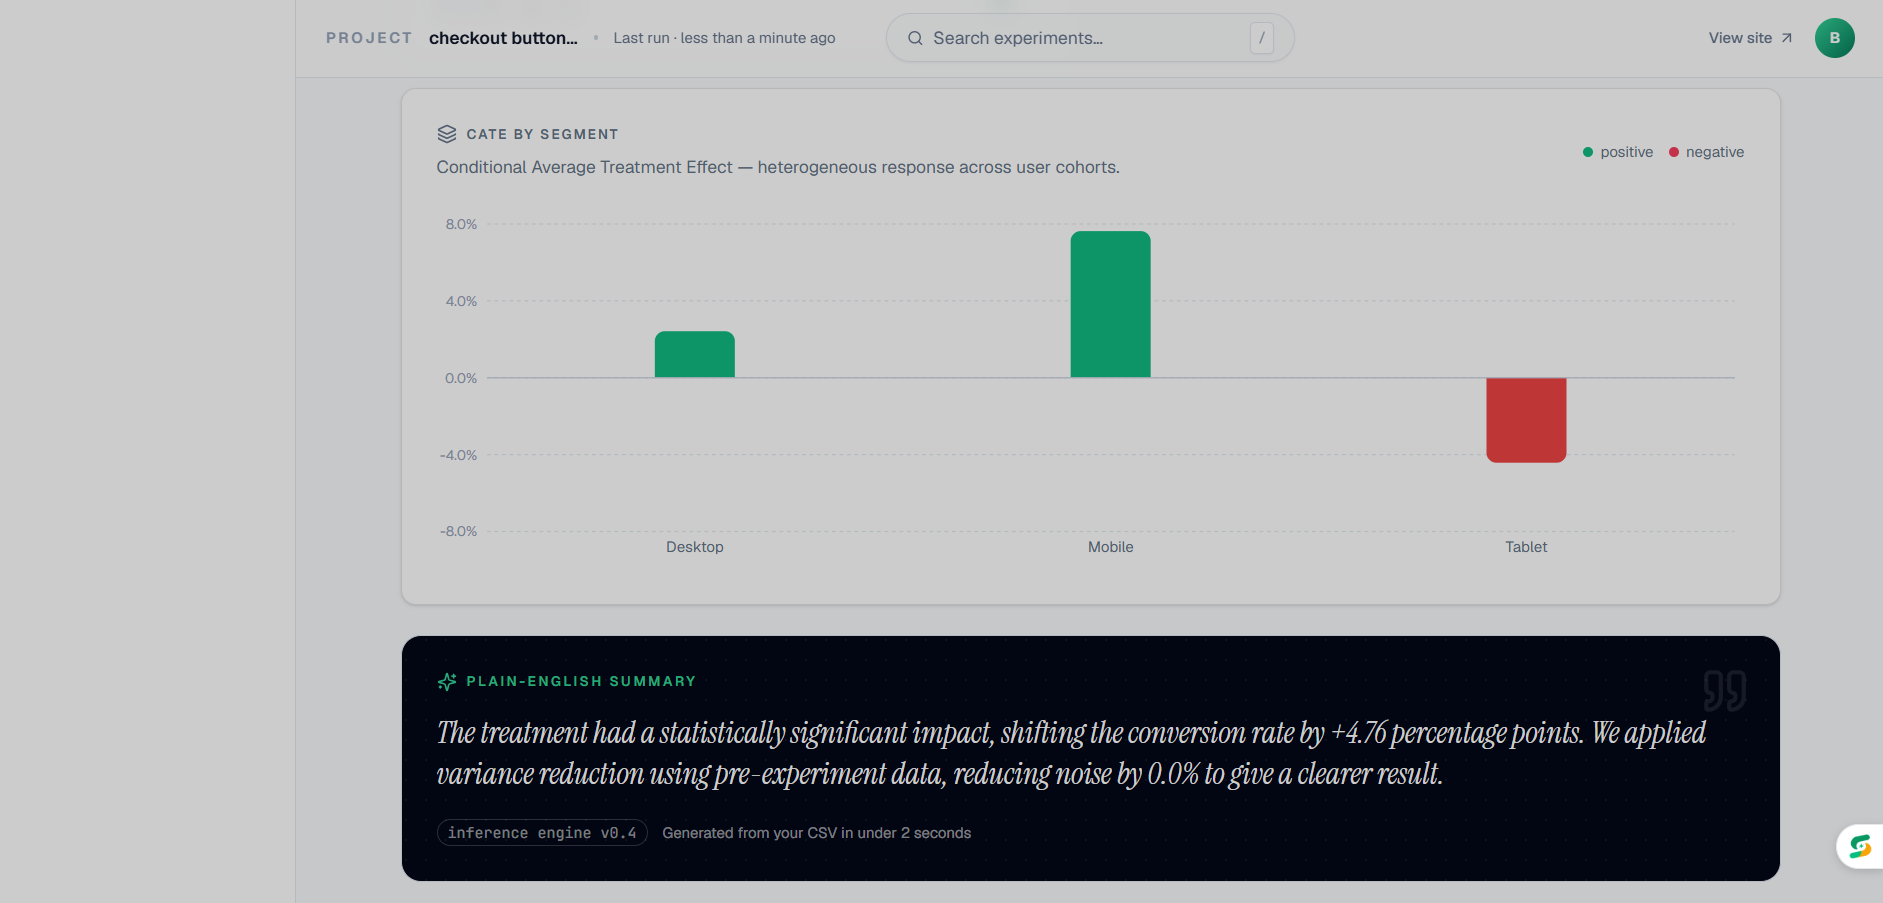
Main dashboard page - CATE By Segment and Summary
-
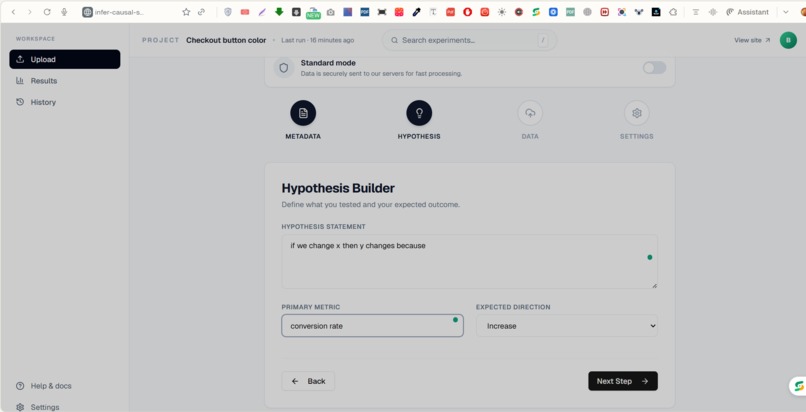
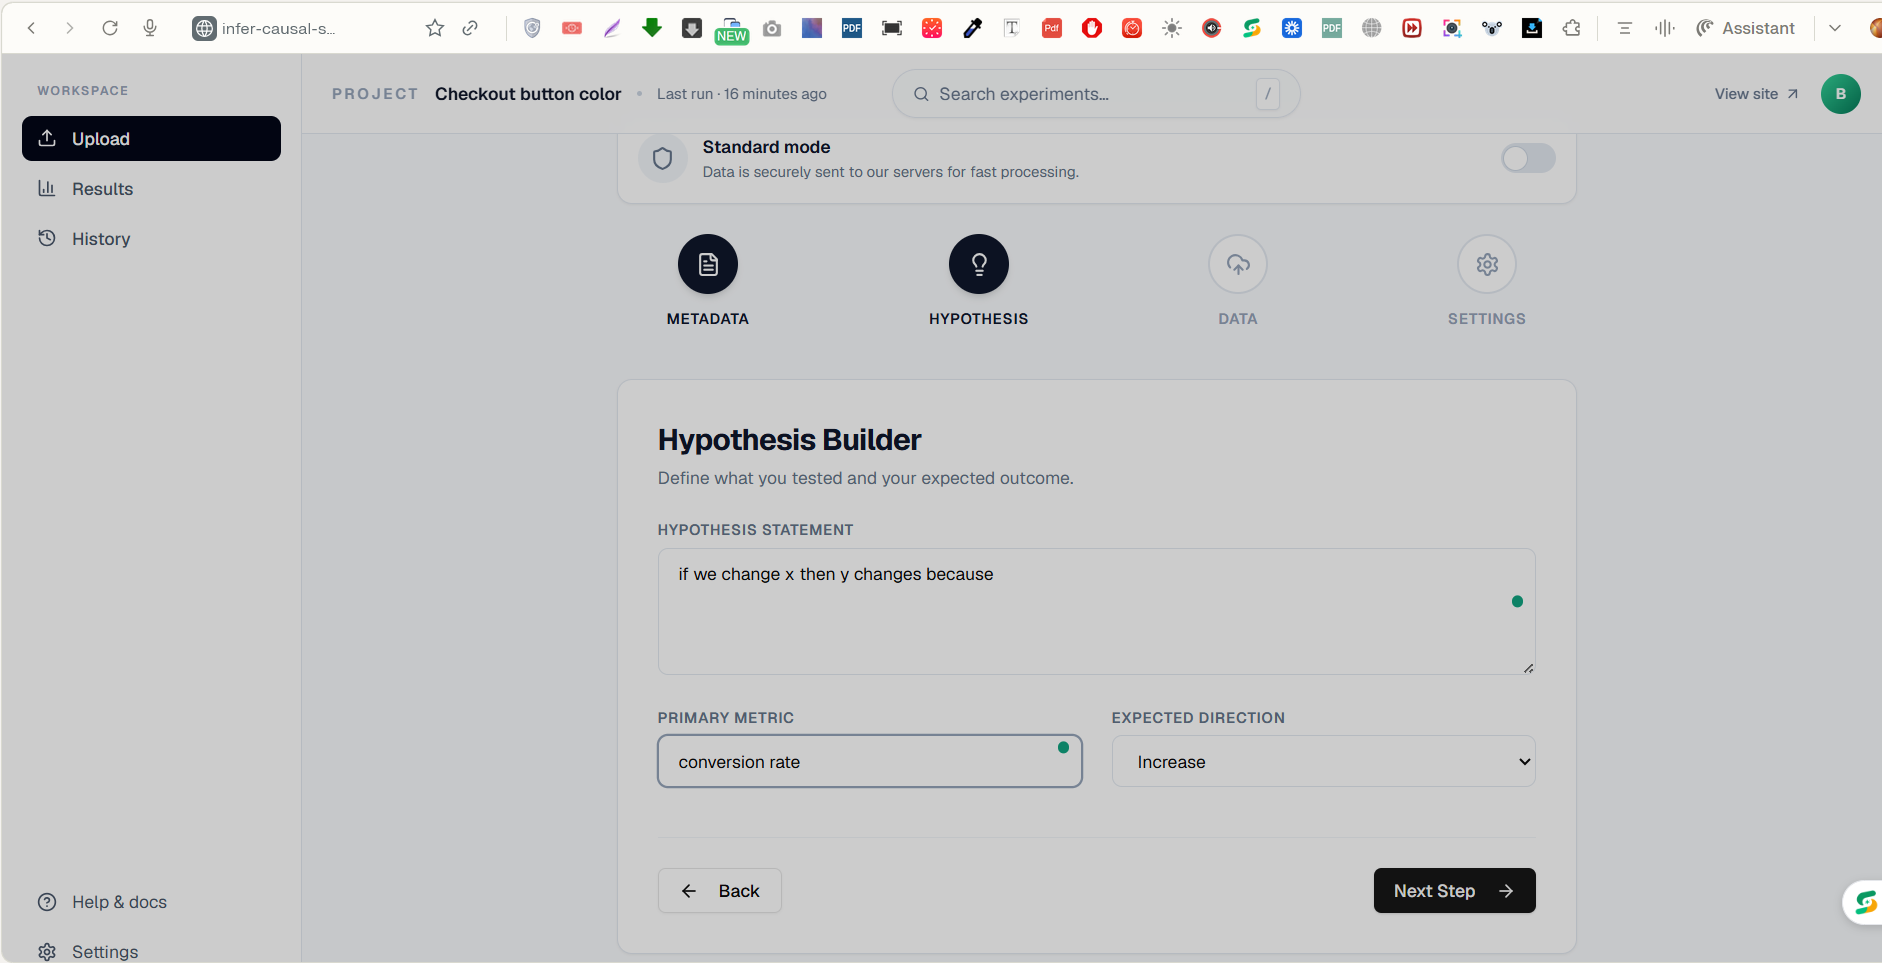
Hypothesis Builder page
-
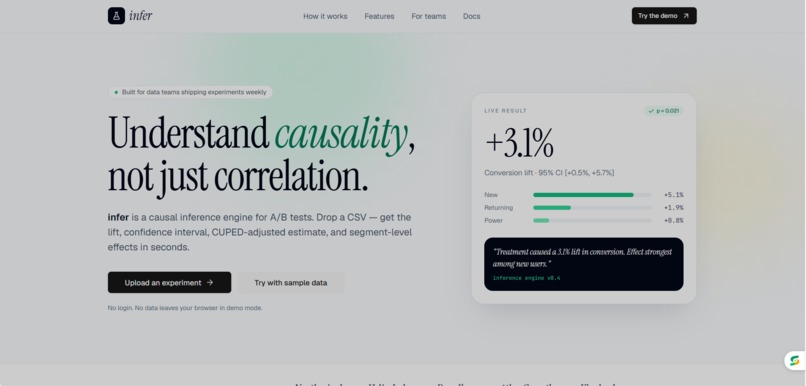
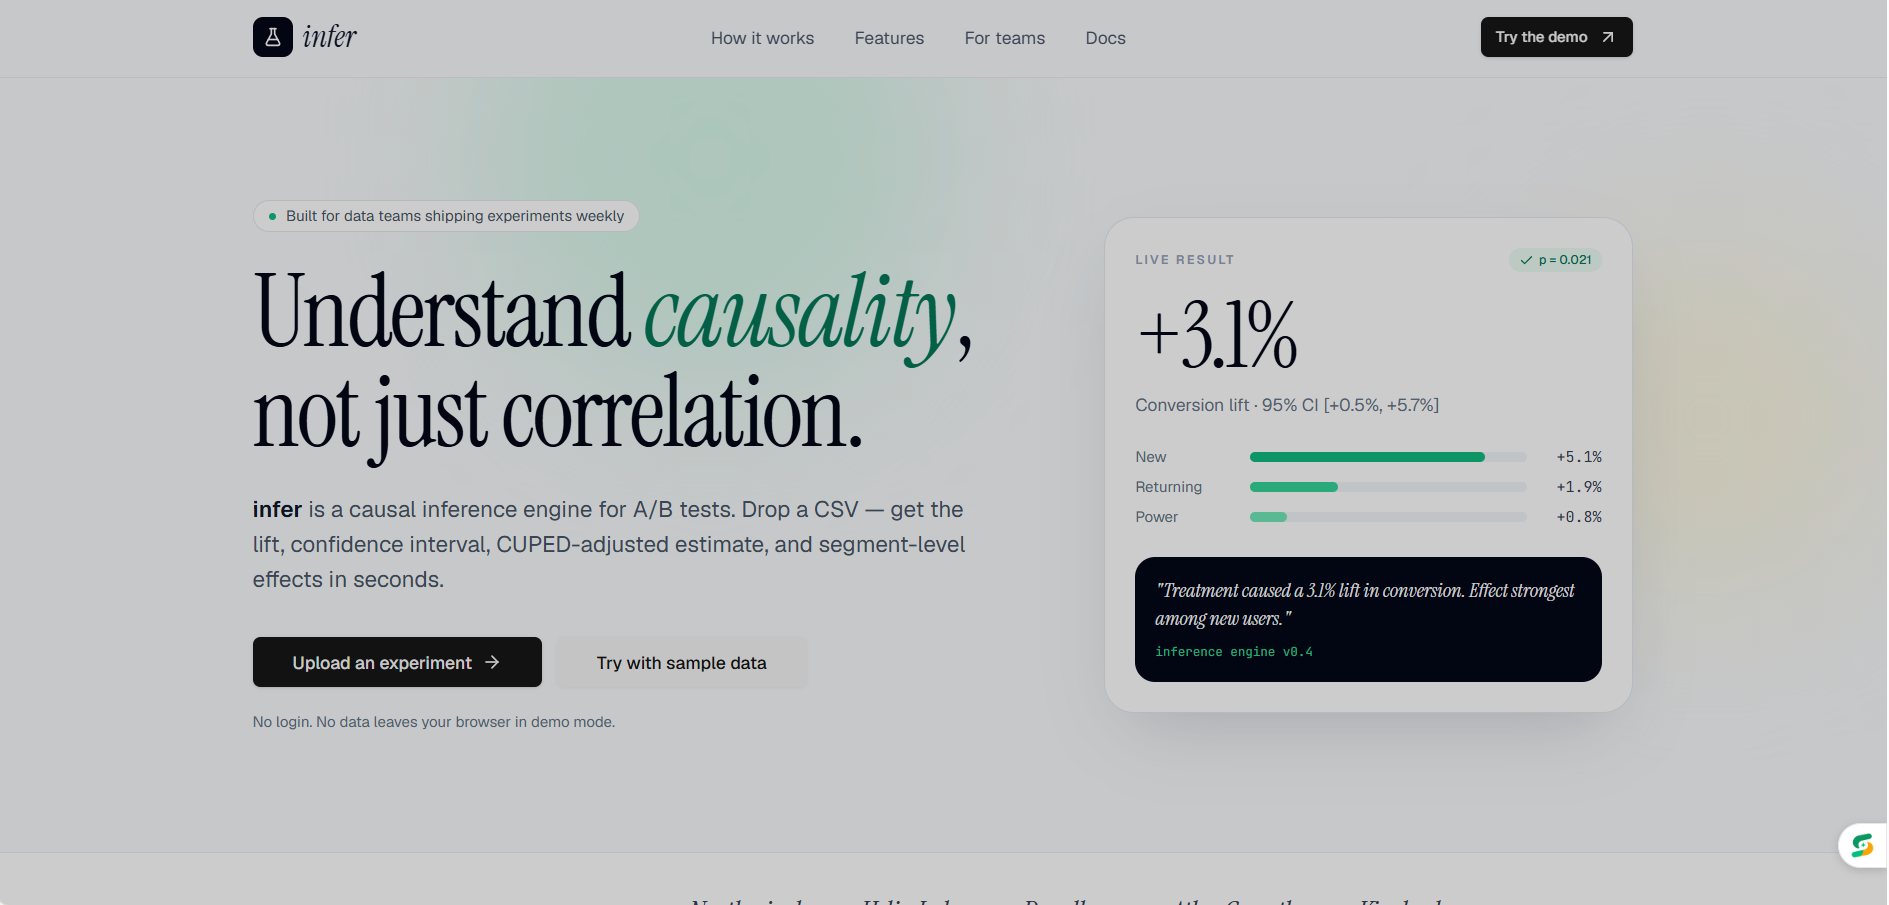
Home page

Inspiration
During my internship as a Data Analyst, I kept watching the same thing happen: a product team would run an experiment, get results, and then wait — sometimes days — for a data scientist to be free enough to actually analyze it. And when the analysis finally came back, it was usually just a p-value and a thumbs up or thumbs down.
I knew there had to be a better way. Not just faster, but deeper.
What it does
Infer lets any team upload their experiment CSV and instantly get a full causal analysis. Not just a basic t-test, but six methods running simultaneously: ATE, CUPED variance reduction, CATE segmentation, Sequential Testing, Bayesian inference, and SRM detection.
Then an AI layer reads all of it and tells you in plain English what actually happened and what you should do. Not "p=0.003, significant." More like: "This works really well for new users but is slightly hurting retention for existing ones. Consider a targeted rollout."
How we built it
The backend is Python + FastAPI handling all the stats heavy lifting. NumPy, SciPy, Pandas doing the actual math. The frontend is React + Recharts for visualizations. SQLite stores experiment history. Groq's Llama-3 powers the AI interpretation layer.
I ran the full product lifecycle solo. Market research, architecture, build, and deployment in 10 days.
Challenges we ran into
CUPED was harder than I expected. The math is straightforward on paper but getting it to work reliably across messy, real-world CSVs with missing pre-experiment data took a lot of edge case handling. Same with the CATE segmentation, automatically detecting which columns to segment on without the user having to specify anything.
Getting the AI to reason causally rather than just summarize numbers was also a challenge. The prompt engineering to make it say "the effect is driven by X segment" rather than "the treatment group had higher conversion" took many iterations.
Accomplishments that we're proud of
Honestly? That it actually works end-to-end on real data. I tested it on actual experiment datasets and the AI output matched what a trained data scientist would conclude. That felt like the moment it went from a project to something real.
Also the Privacy Mode. Running the entire statistical analysis client-side via Pyodide/WASM so sensitive experiment data never leaves the browser. That was a late addition but I'm really glad I built it.
What we learned
That statistical rigor and usability are usually in tension, and bridging that gap is the actual hard problem. Anyone can run a t-test. Making six methods explainable to a product manager who just wants to know "should I ship this?" is a completely different challenge.
I also learned that 10 days is enough to build something meaningful if you stay focused and cut scope ruthlessly.
What's next for Infer
Multi-metric analysis (conversion AND revenue in one run), experiment comparison views, and Slack alerts when significance is reached. Long term, I want to make Infer the tool that makes every product team self-sufficient on experimentation, no data scientist required.

Log in or sign up for Devpost to join the conversation.