-
-
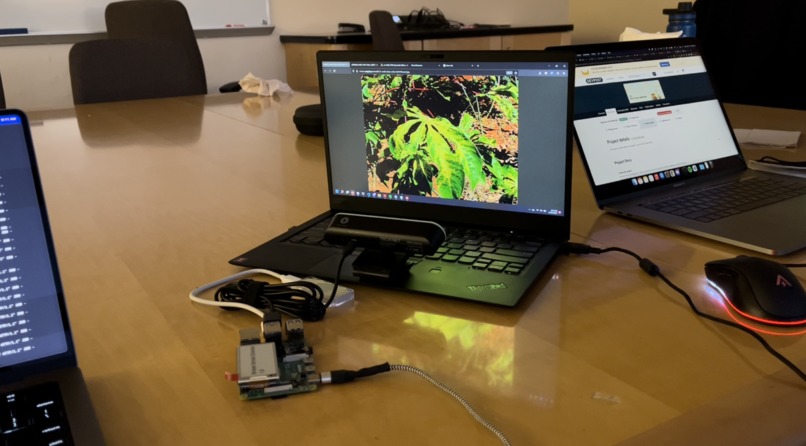
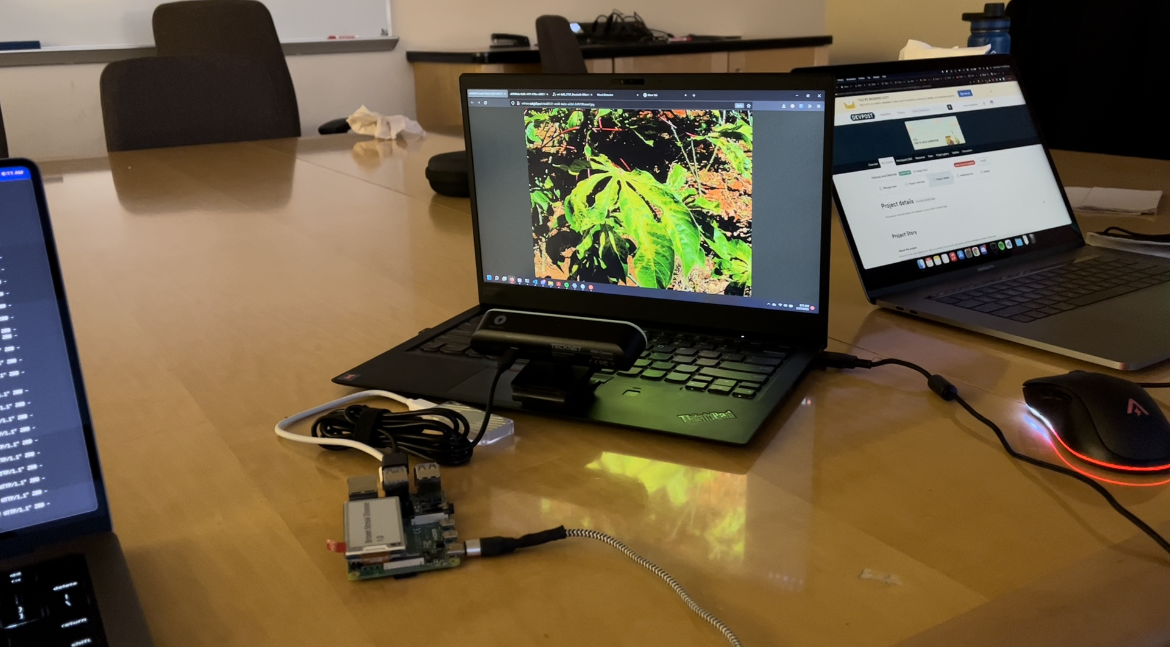
Infected & Detected scanning a plant
-
 GIF
GIF
Waveshare E-Ink display updating with inference and confidence
-
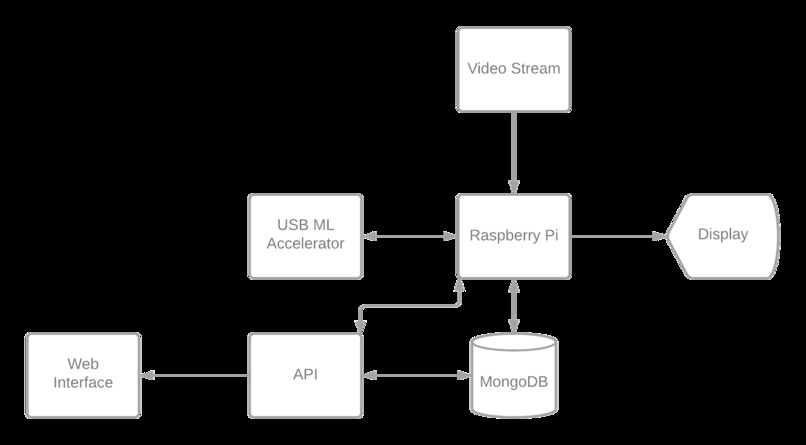
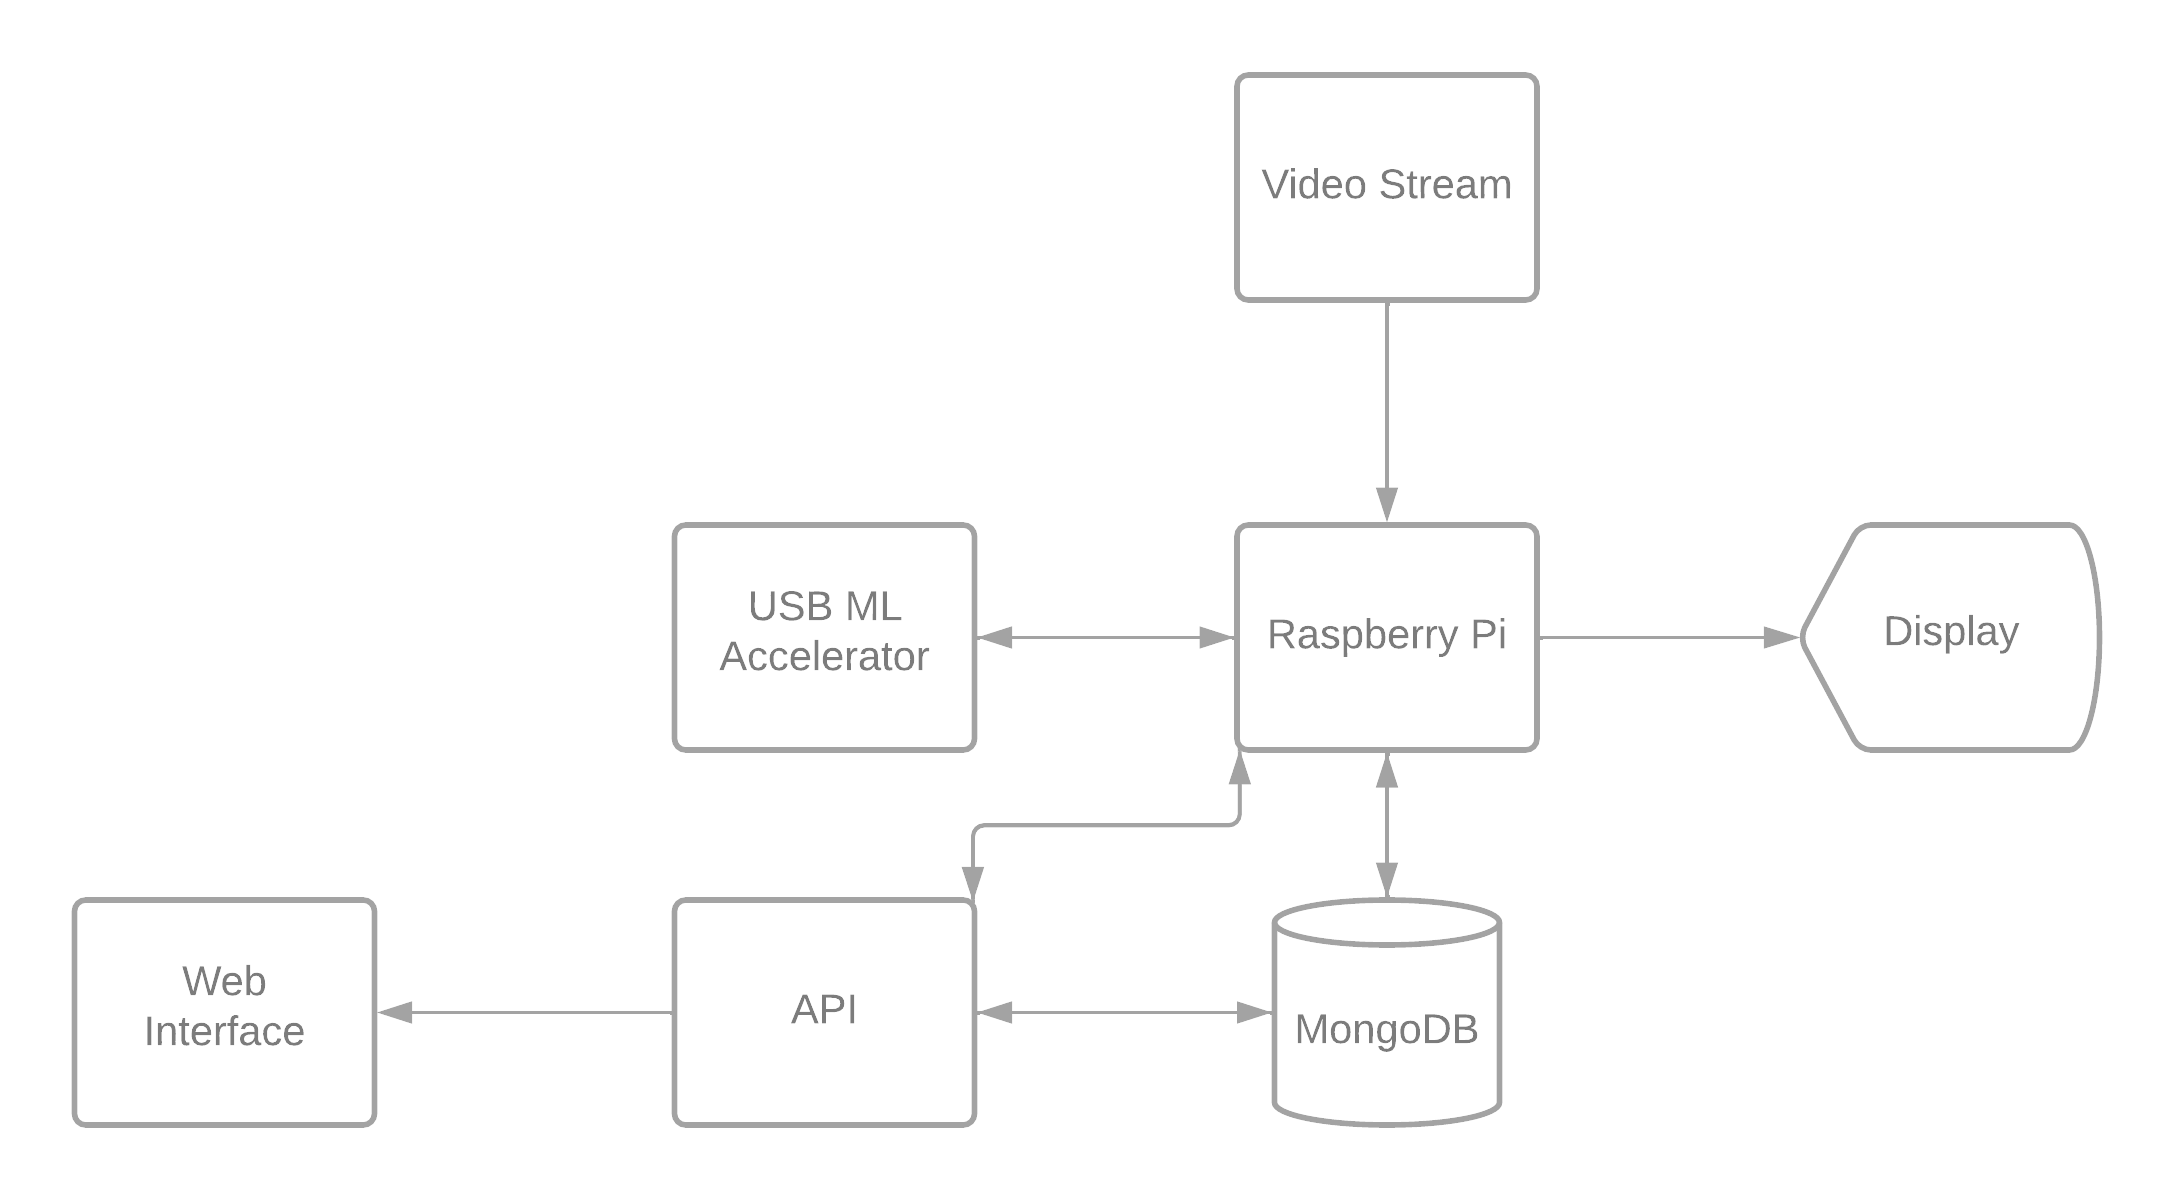
System diagram of hardware and software components
-
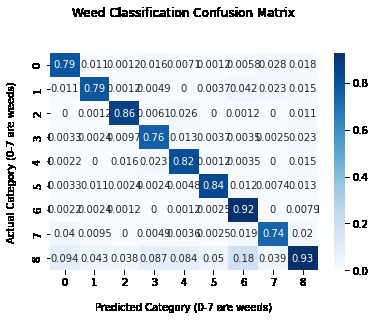
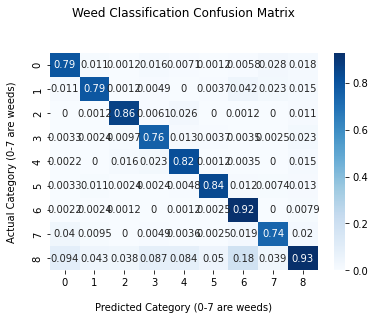
Weed classification confusion matrix
-
 GIF
GIF
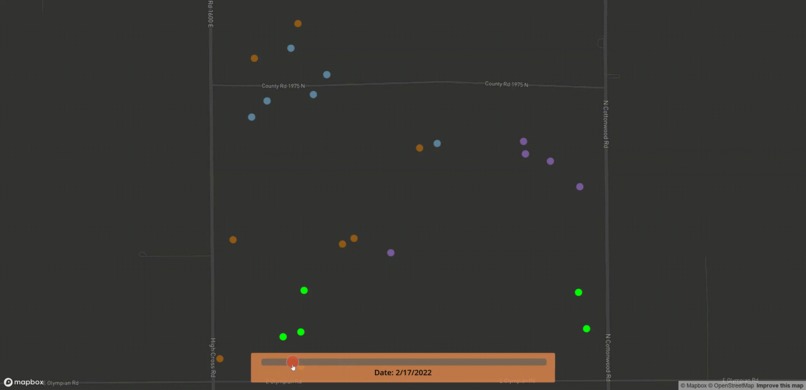
Disease spreading in clusters on Mapbox
-
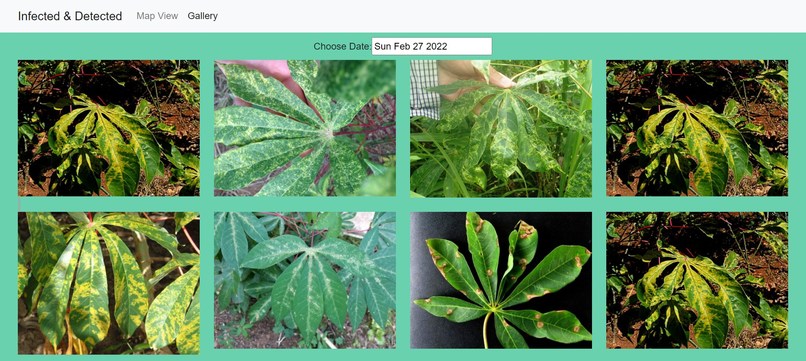
Gallery view of identified disease plants
-

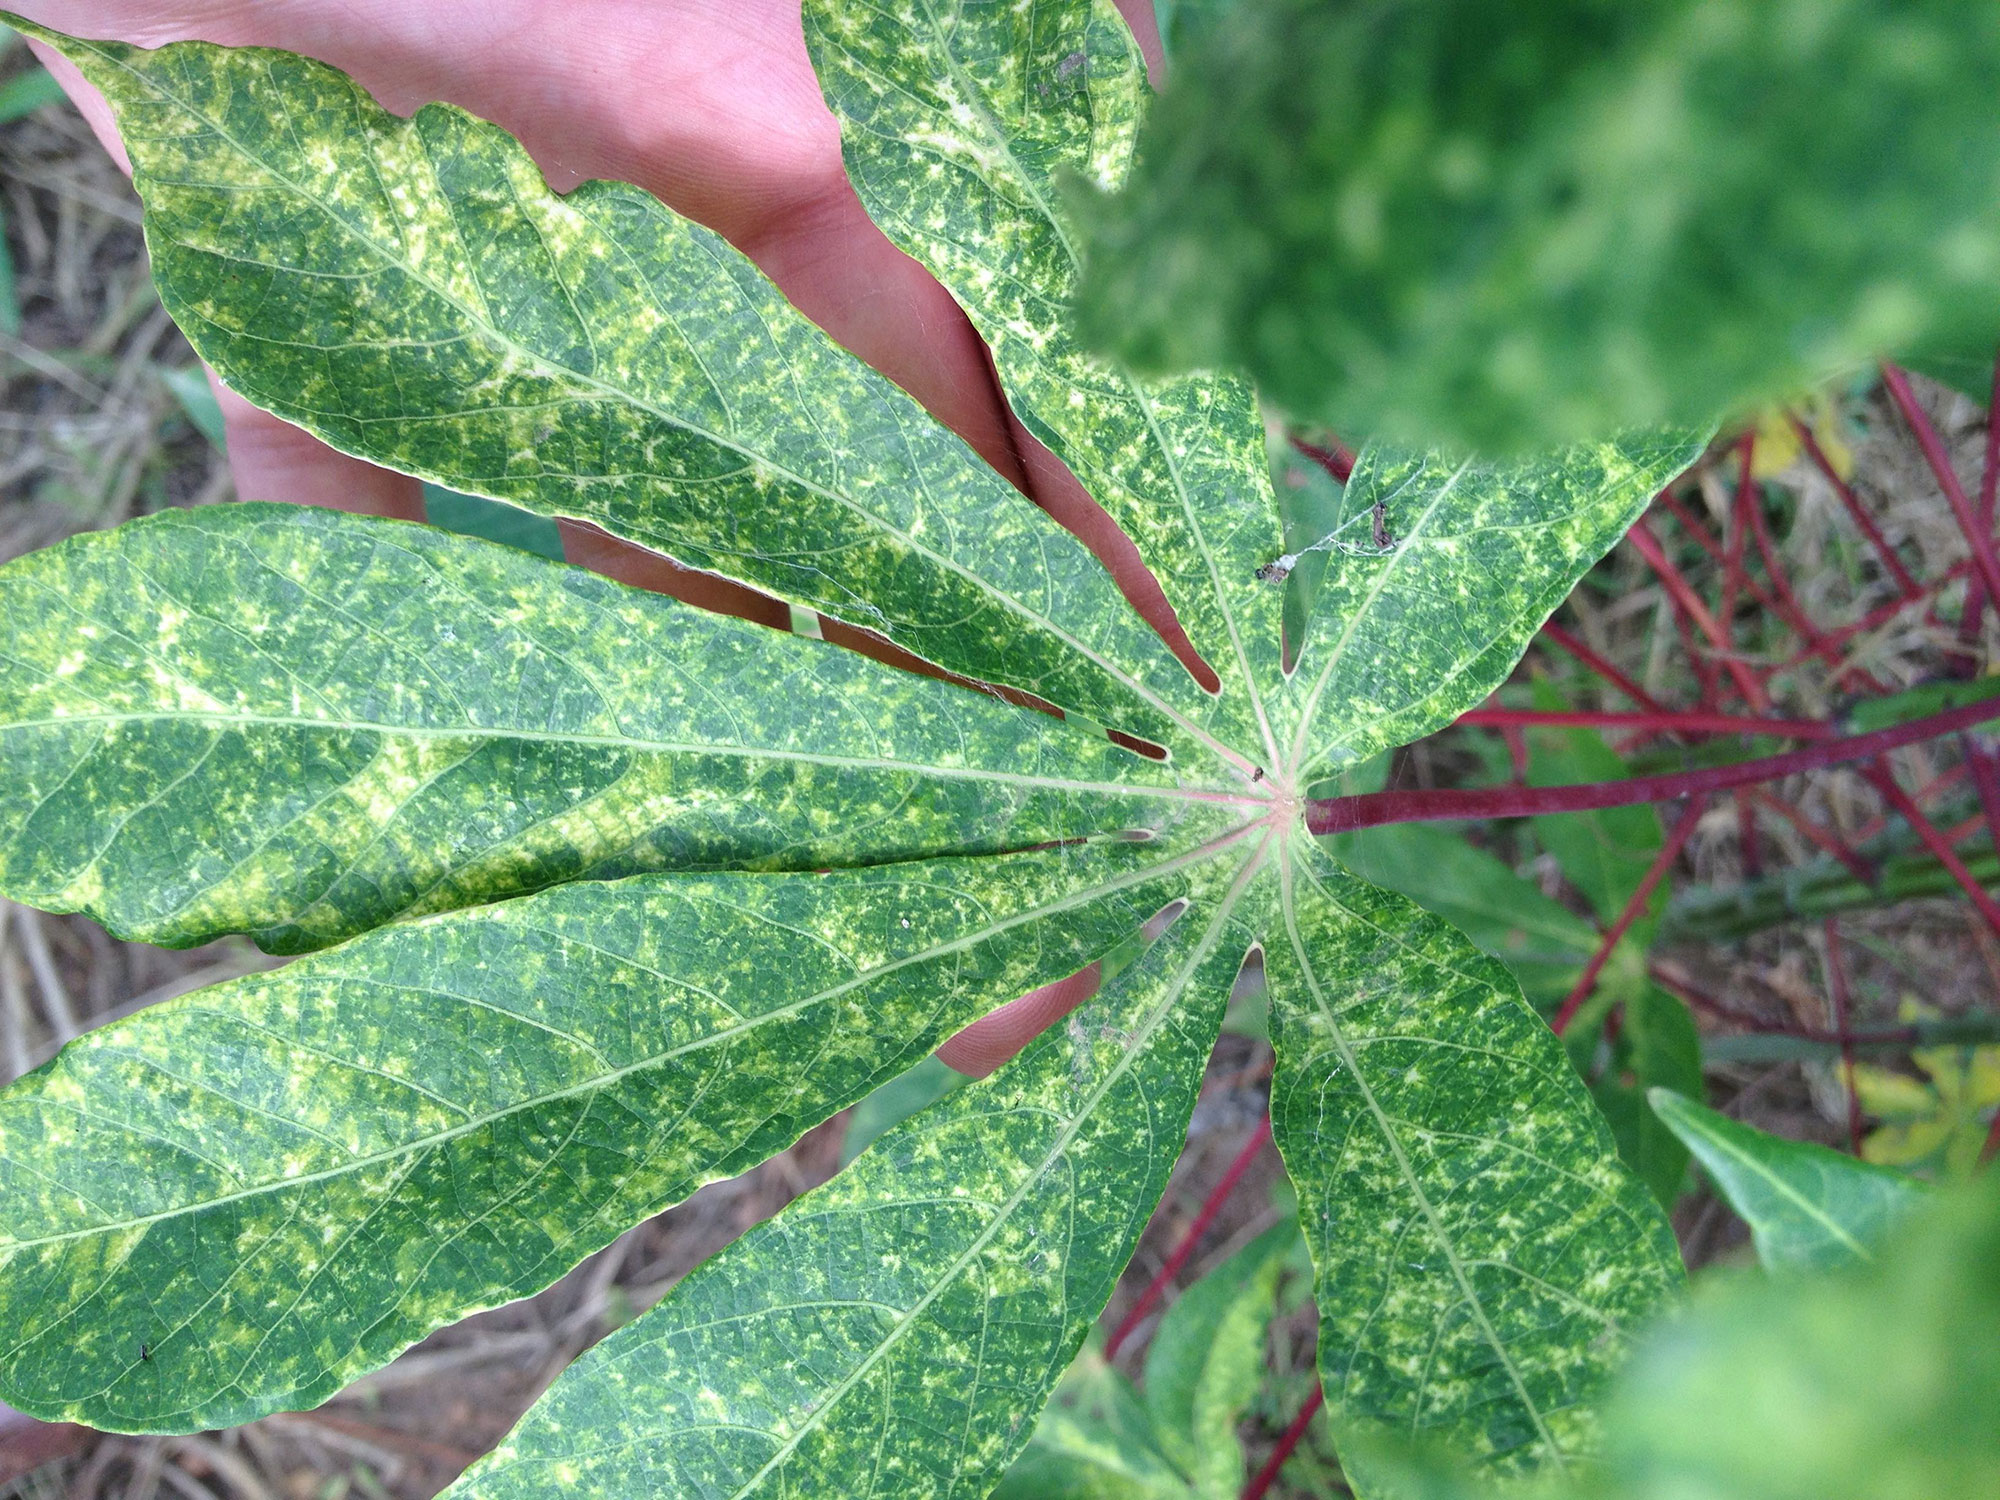
Cassava plant with Mosaic Disease

Inspiration
With improvements in efficiency and productivity of farm machinery, US agricultural yield has steadily increased over the last century. However, along with growth, farmers now also face an increasing number of issues plaguing crop production. For example, The Food and Agriculture Organization of the United Nations estimates that around US$220 billion is lost every year to plant diseases. Upon seeing John Deere's 'See & Spray' innovation, we were motivated to increase the preventability of these economic damages for farmers around the world, and provide technology that could help combat the spread of invasive plants and diseases.
Problem
Given our background in knowledge regarding crops going to waste due to disease susceptibility, we decided to narrow our focus to the ‘cassava’ plant. Amongst a given group of healthy and diseased cassava plants, we wanted our program to be able to detect not only what was healthy and what wasn’t, but identify the specific disease afflicting the individual plant. This would work in tandem with identifying whether a given plant was the cassava plant or a weed, something the ‘See & Spray’ is already capable of doing.
What it does
Our project consists of a machine learning model deployed on the edge along with a web interface that farmers can use to get analytics on their diseased crops. The machine learning model is built using TensorFlow Lite, runs on a Raspberry Pi that is accelerated using a Coral Edge TPU accelerator board, and detects whether a given plant in the frame is healthy or diseased or if it is a weed that needs removal. This application also provides the user with access to an online video stream that displays current predictions for the plants in the frame along with a confidence level for each.
Each data point from the machine learning model is tagged with a location along with whether it is healthy, diseased, or a weed and an associated GPS coordinate. Using a Flask API to seed the data from the MongoDB database, we developed a Mapbox interface along with an image gallery that provides insights and visuals into detected problematic plants. In the Mapbox map, a farmer can select individual data points representing diseased plants and determine further action. The Mapbox map continuously polls for data every second from the Flask API and updates the map automatically without the user needing to reload the page. When changing dates on the map, the next cluster of data points is zoomed into automatically as well.
To filter the data and reduce the plotted points on the graph, we created an algorithm to tell if we were looking at the same plant from a different frame by using historical data and the current inference. When a new plant does get detected, its information is saved to the database and the Waveshare E-Ink display is updated with the name of the disease and the confidence of the prediction.
Challenges we ran into
The main problem we faced was not having access to real plants to test our models on. We tried to find plants near us, but after a recent snowstorm, it proved impossible. With datasets from the internet, the video input would be inconsistent from those taken with a camera and affect the inference. We tried to solve this by using another teammate’s computer and finding images of plants with disease, plants without, and weeds. At times, glare would completely block the camera from being able to see the plant to infer.
We struggled with connecting the Raspberry Pi to the U of I wireless network without a monitor or a keyboard as the network did not allow access to the network without approving the MAC address. However, we couldn’t find the MAC address to the Raspberry Pi without SSHing into it. We solved this after 4 hours by editing the boot configuration on the SD card and connecting the Pi to a mobile hotspot.
We tried training already existing models to classify both weeds and diseased plants, but many existing implementations and research papers either did not provide the training dataset or the code to train the model. Others had broken file uploads and non-functional code. Near the end of the hackathon, we were able to apply transfer learning to classify weeds, but we could not do the same for the Cassava model from Tensorflow Hub.
Accomplishments that we're proud of
Both the MongoDB database and the Flask app are run completely locally on the Raspberry Pi, allowing for offline data collection, analysis, and inference. As our application does not use the internet, latency is reduced and user privacy is preserved. Instead of streaming video data to a server in the cloud, the Coral Edge TPU allows for all inference to be done locally while using 1 watt per TOP. For each video frame, the average inference time was between 80 and 180 milliseconds. Compared to making HTTP requests over the internet, the minimal number of hops makes our solution much faster. In addition, the video frames are stored on the device and there are less opportunities for requests to be intercepted in transmission.
What we learned
We learned a lot about quantizing Tensorflow Lite models to make them smaller and faster. We found that at times, the model became almost four times smaller but twice the speed.
We also learned about streaming video frame data from OpenCV. Previously, we thought that this would not be performant, but the “multipart/x-mixed-replace” header allows for dynamically updated content to be easily pushed to the user’s browser while being performant. It also appears to the user as a continuous and smooth video stream, which was not expected.
What's next for Infected & Detected
With more time and resources, we would aim to be able to train our model on a larger dataset which includes many species of plants and diseases. This would allow for the model to be applied to a greater variety of crops and plants rather than only cassava.
We would hope to test our application on real environments with plants, rather than feeding pictures into the system. This would allow for more reliable results when testing and could improve models. In a similar vein, a way we could improve our model for different environments would be to adjust for exposure and contrast between the background and foreground. This would remove any unwanted parameters when analyzing the plant itself and be able to return a reliable result for various situations.
Another prospect for improving the project would be to add a battery to the Raspberry Pi so that we were not chained to a power source by a cable. This restricted a lot of movement of the hardware of the project as the Raspberry Pi had to be continued to be plugged in.
Built With
- bootstrap
- flask
- javascript
- mapbox
- mongodb
- python
- raspberry-pi
- tensorflow-lite
- waveshare


Log in or sign up for Devpost to join the conversation.