-
-
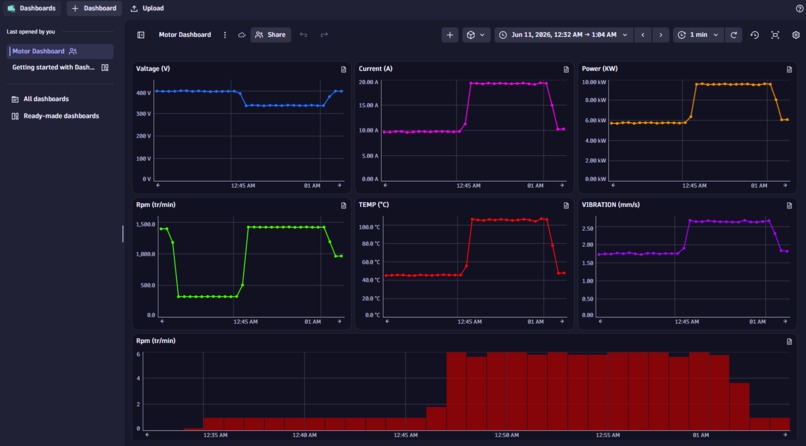
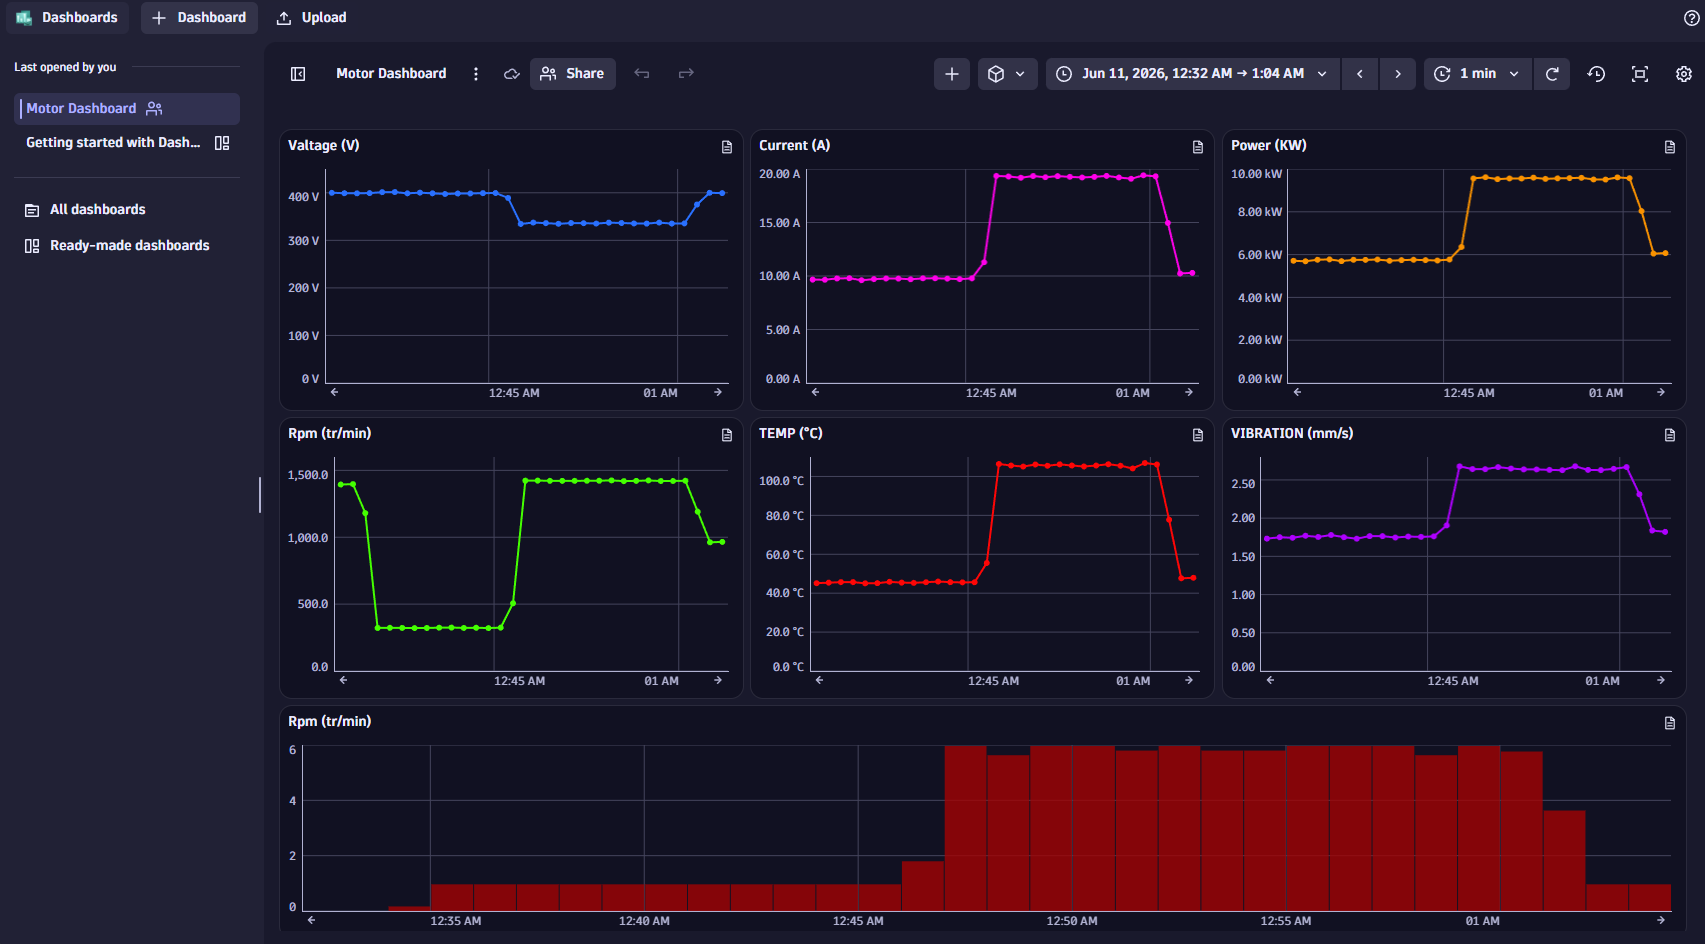
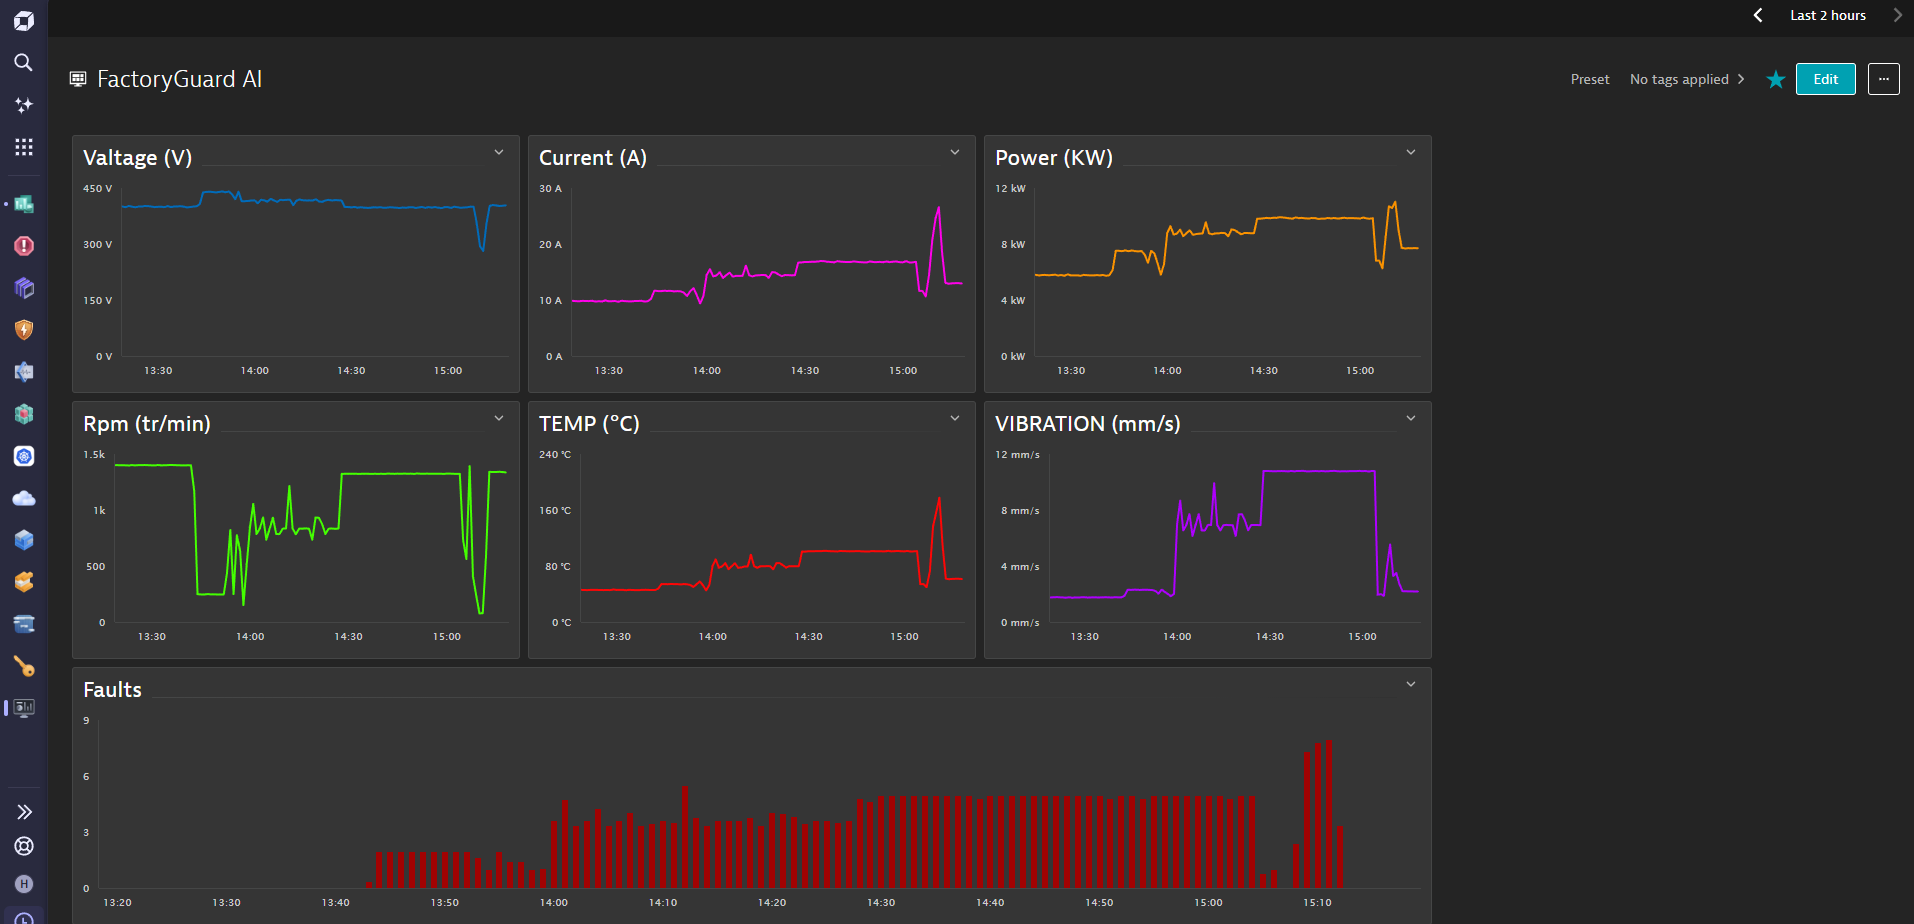
Dynatrace dashboard
-
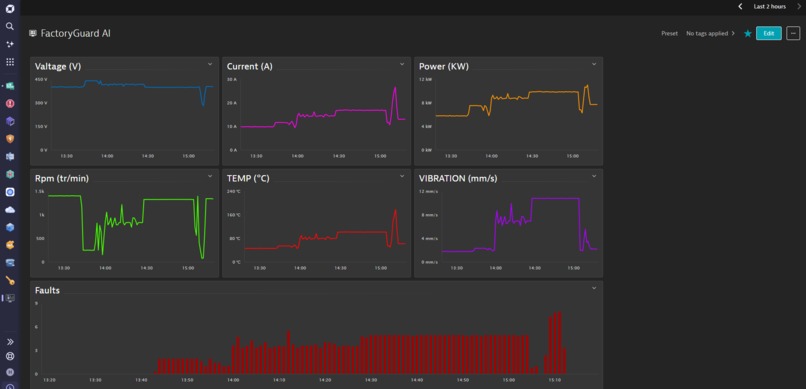
Dynatrace dashboard classic
-
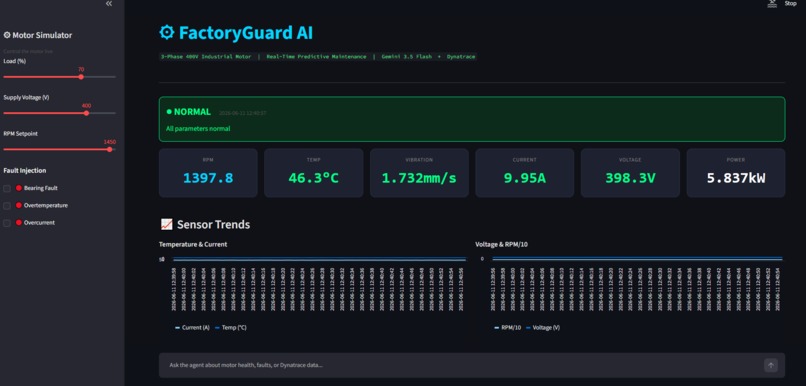
Factoryguard AI 1
-
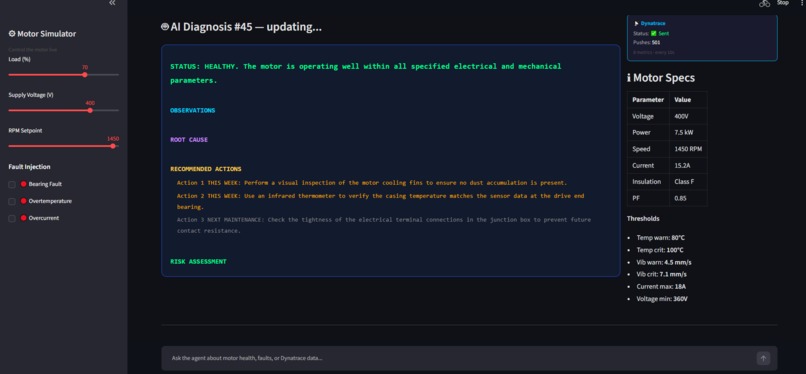
Factoryguard AI 2
-
Factoryguard AI 3
-
Factoryguard AI 4
-
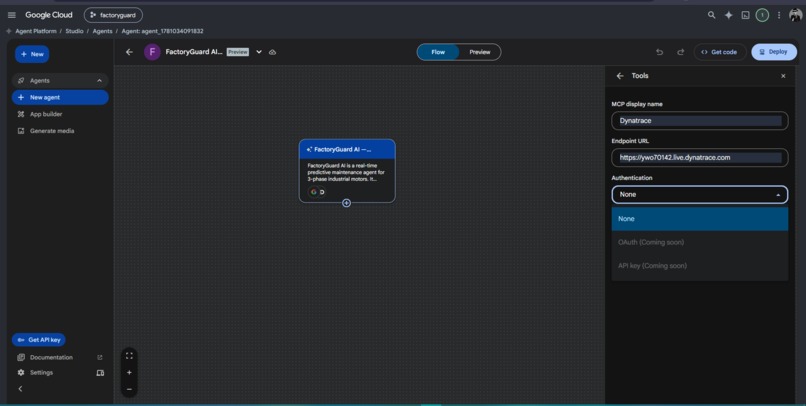
Limitation of the Connection with Dynatrace
-

Dynatrace free trial ending soon

FactoryGuard AI
Inspiration
During my studies in Industry 4.0 and predictive maintenance, I kept running into the same frustrating reality: factories lose thousands of dollars every hour when a motor breaks down unexpectedly — and most of the time, the data to prevent it was already there.
The monitoring systems I studied during my engineering courses could tell operators that something was wrong. But they never explained why, and they never said what to do next. The engineer still had to figure it out alone, often under pressure, in the middle of a production halt.
That gap bothered me. I have a background in electrical engineering and I've worked around industrial machines long enough to know that a good maintenance engineer doesn't just read numbers — they reason about them. So I decided to build something that does the same thing: a system that detects problems, understands the physics behind them, and gives you a real answer.
That's how FactoryGuard AI started.
What It Does
FactoryGuard AI is a real-time predictive maintenance agent I built for three-phase industrial motors.
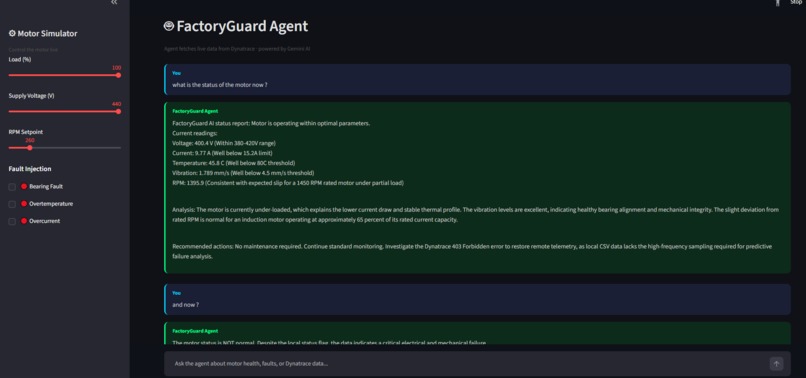
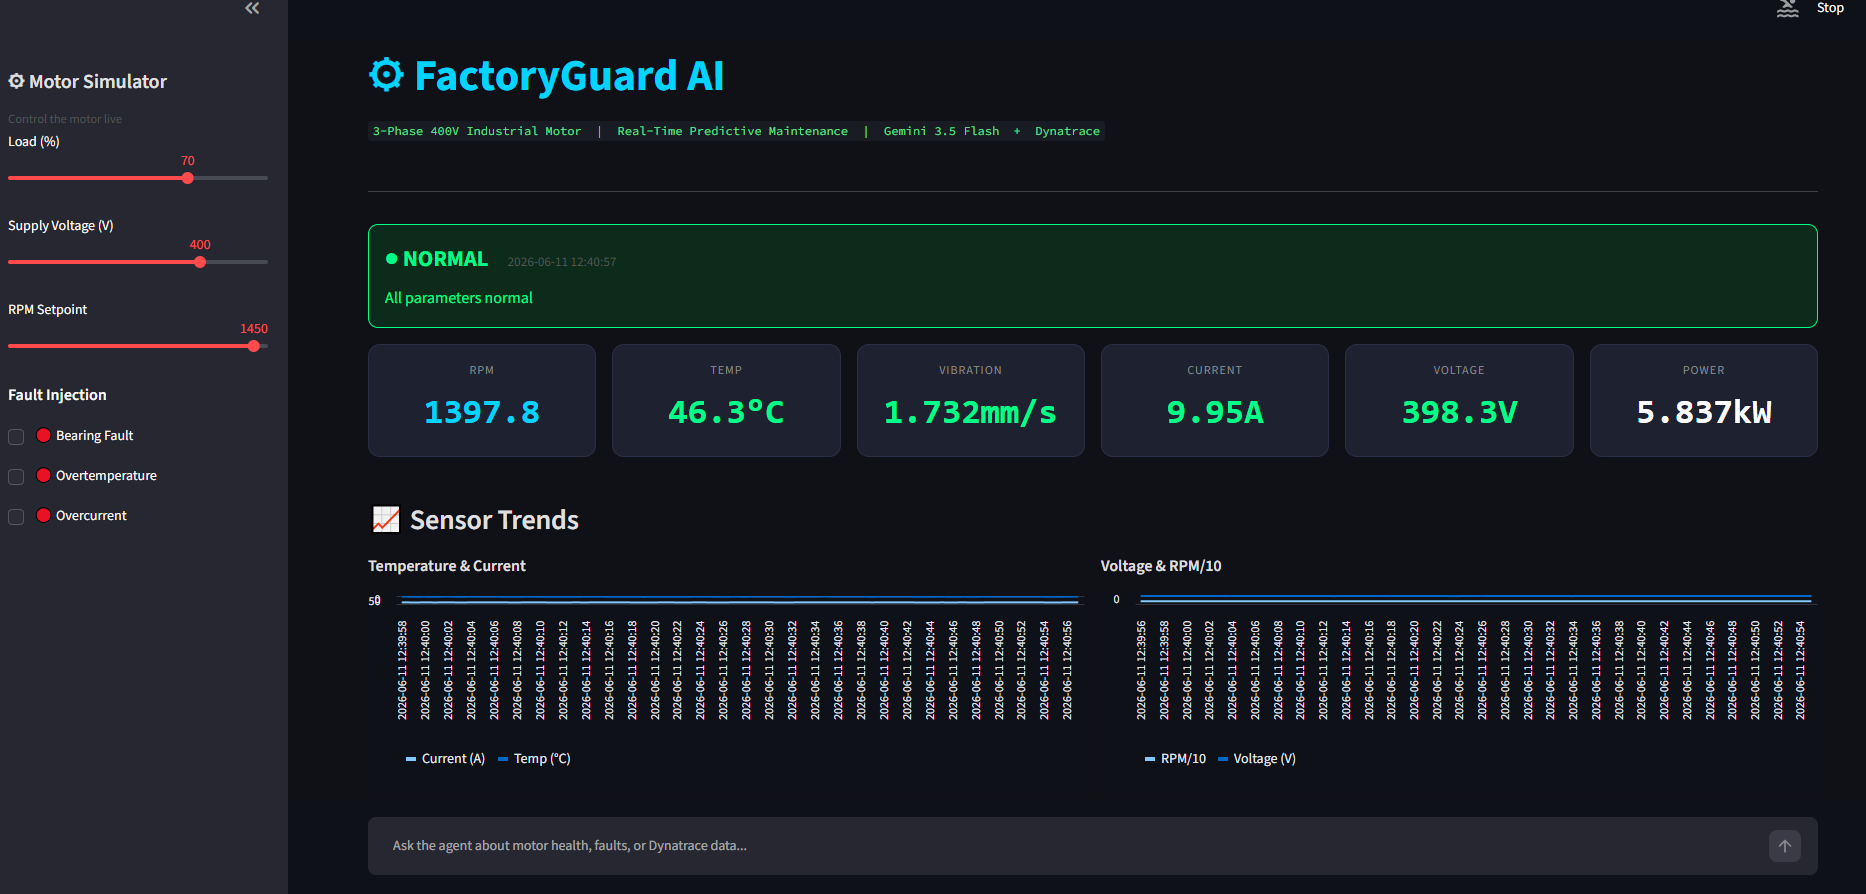
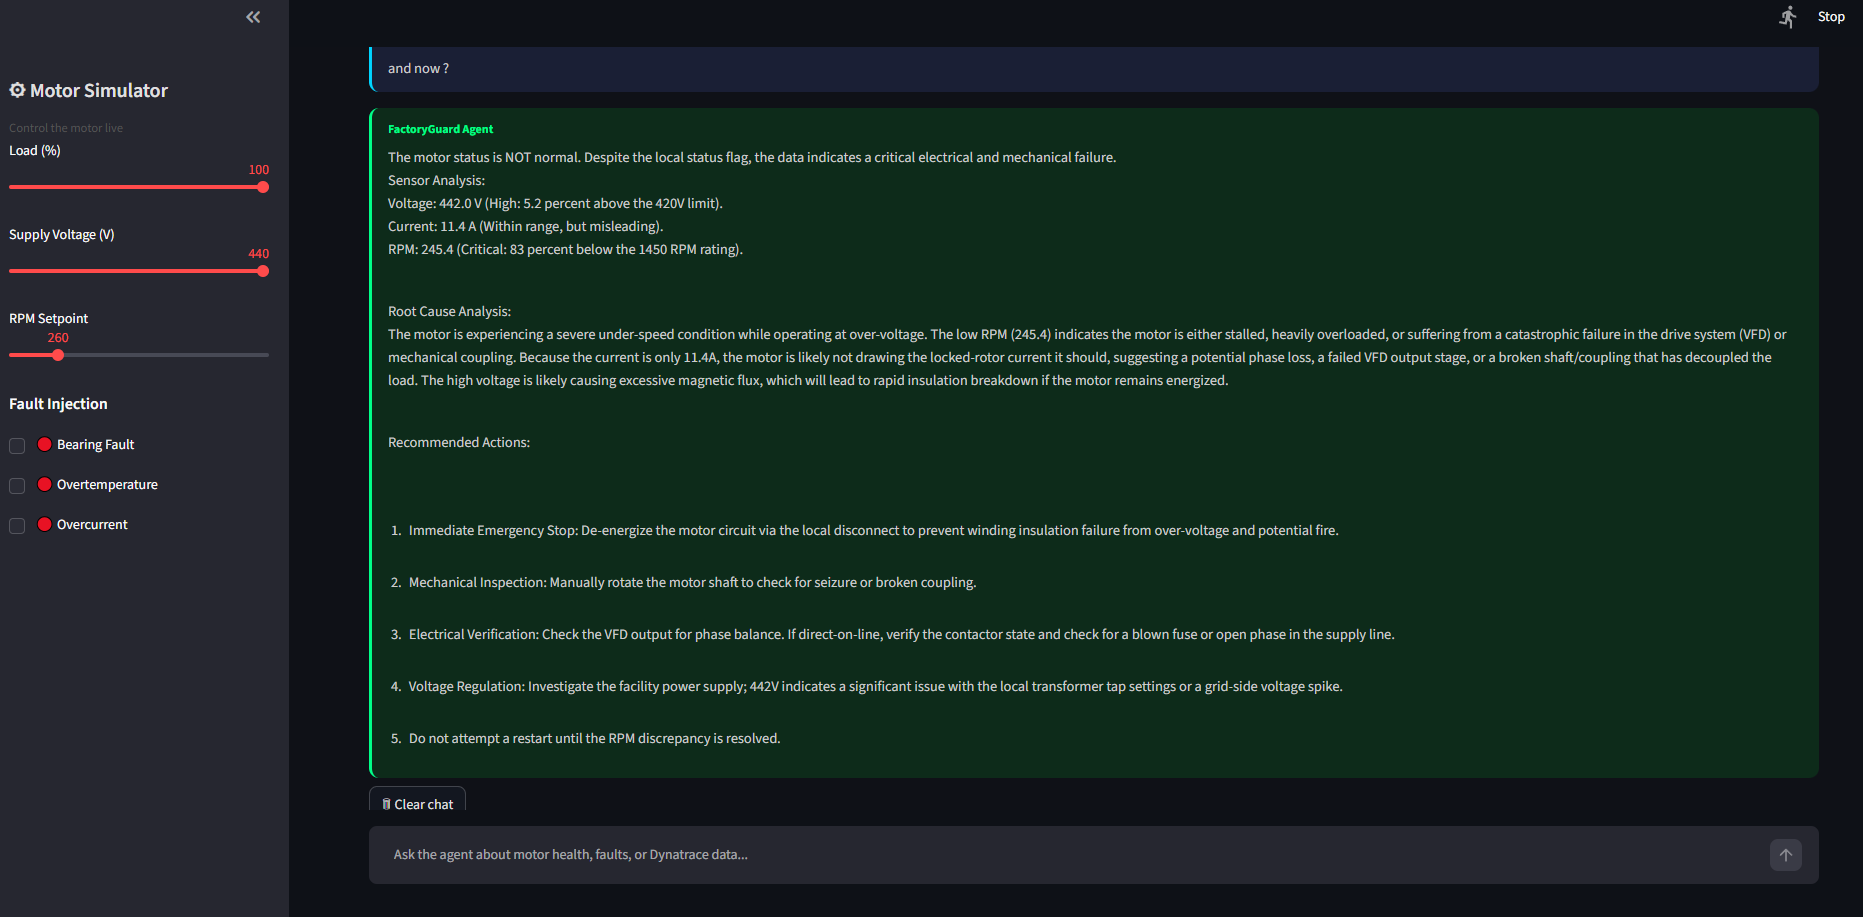
I simulated a 400V / 7.5kW / 1450 RPM induction motor with six live sensor channels — voltage, current, temperature, vibration, RPM, and power. From the browser, you can control the motor directly: adjust the load, drop the supply voltage, inject a bearing fault, and watch everything react in real time.
Here's what I built into it:
- A 23-rule fault detection engine I wrote from scratch using real electrical engineering thresholds
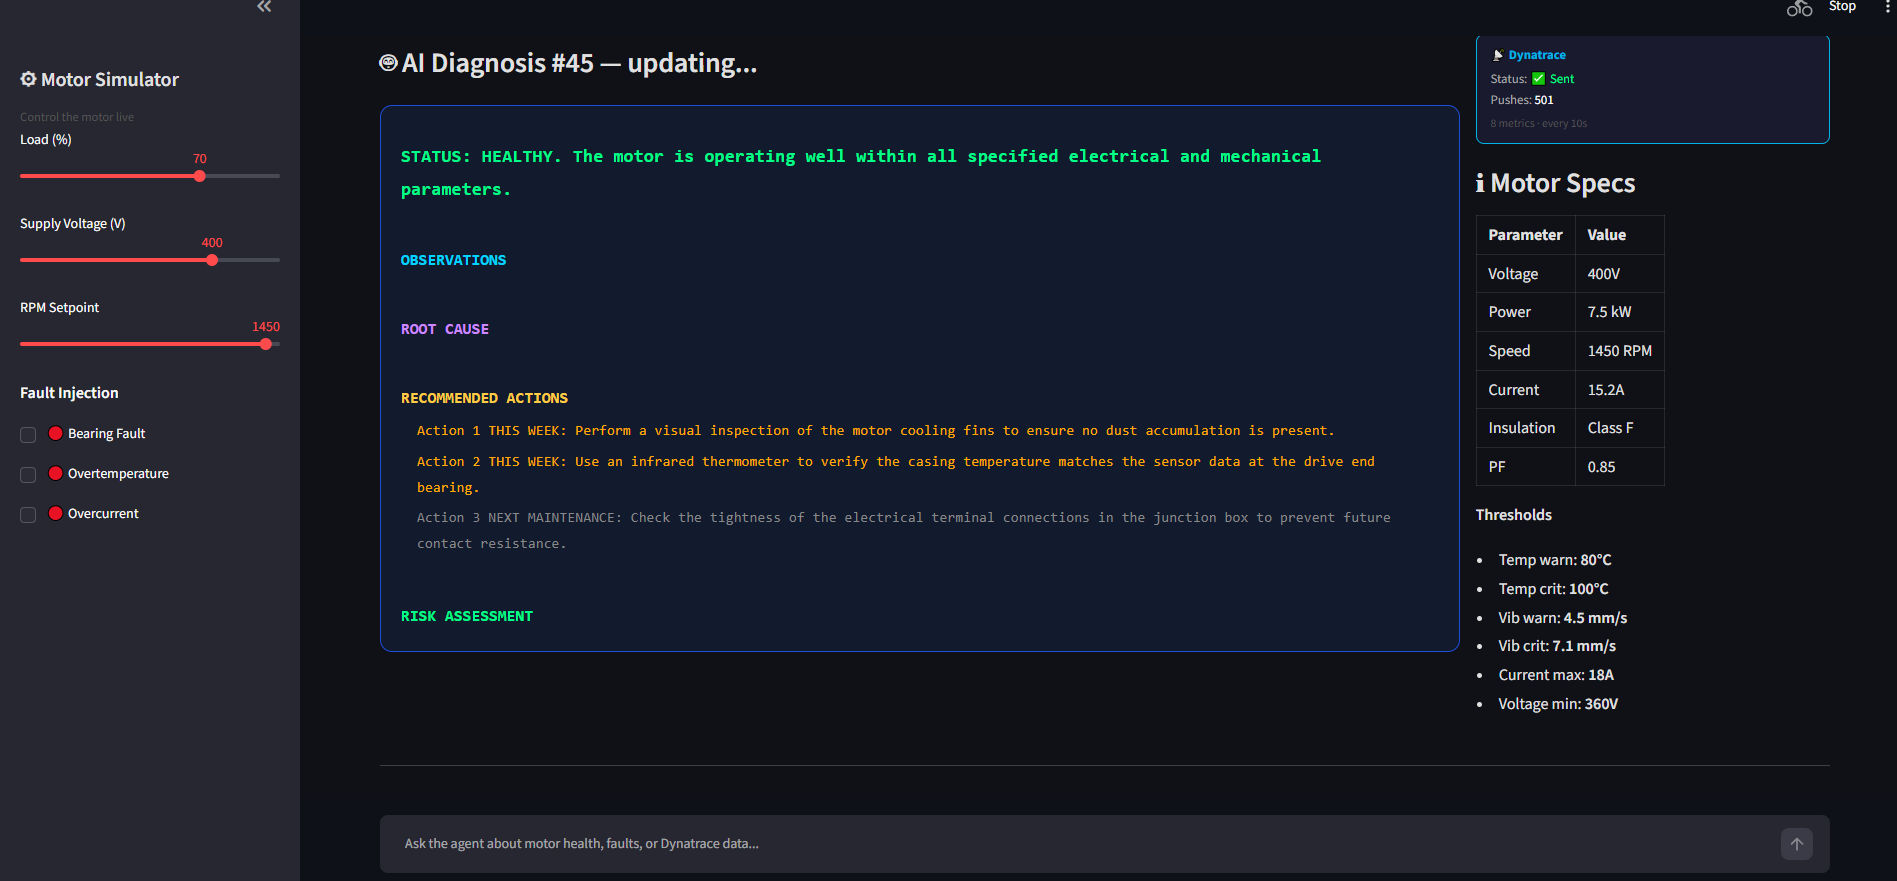
- Every 60 seconds, Gemini AI receives the live sensor data and active faults, then produces a structured engineering diagnosis — status, root cause, recommended actions, and risk assessment
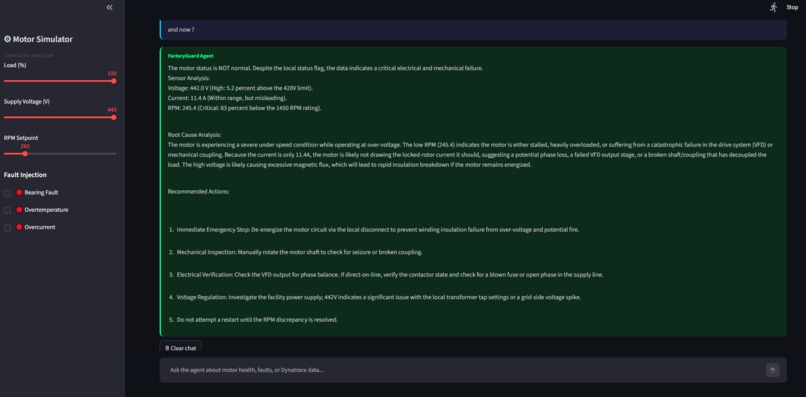
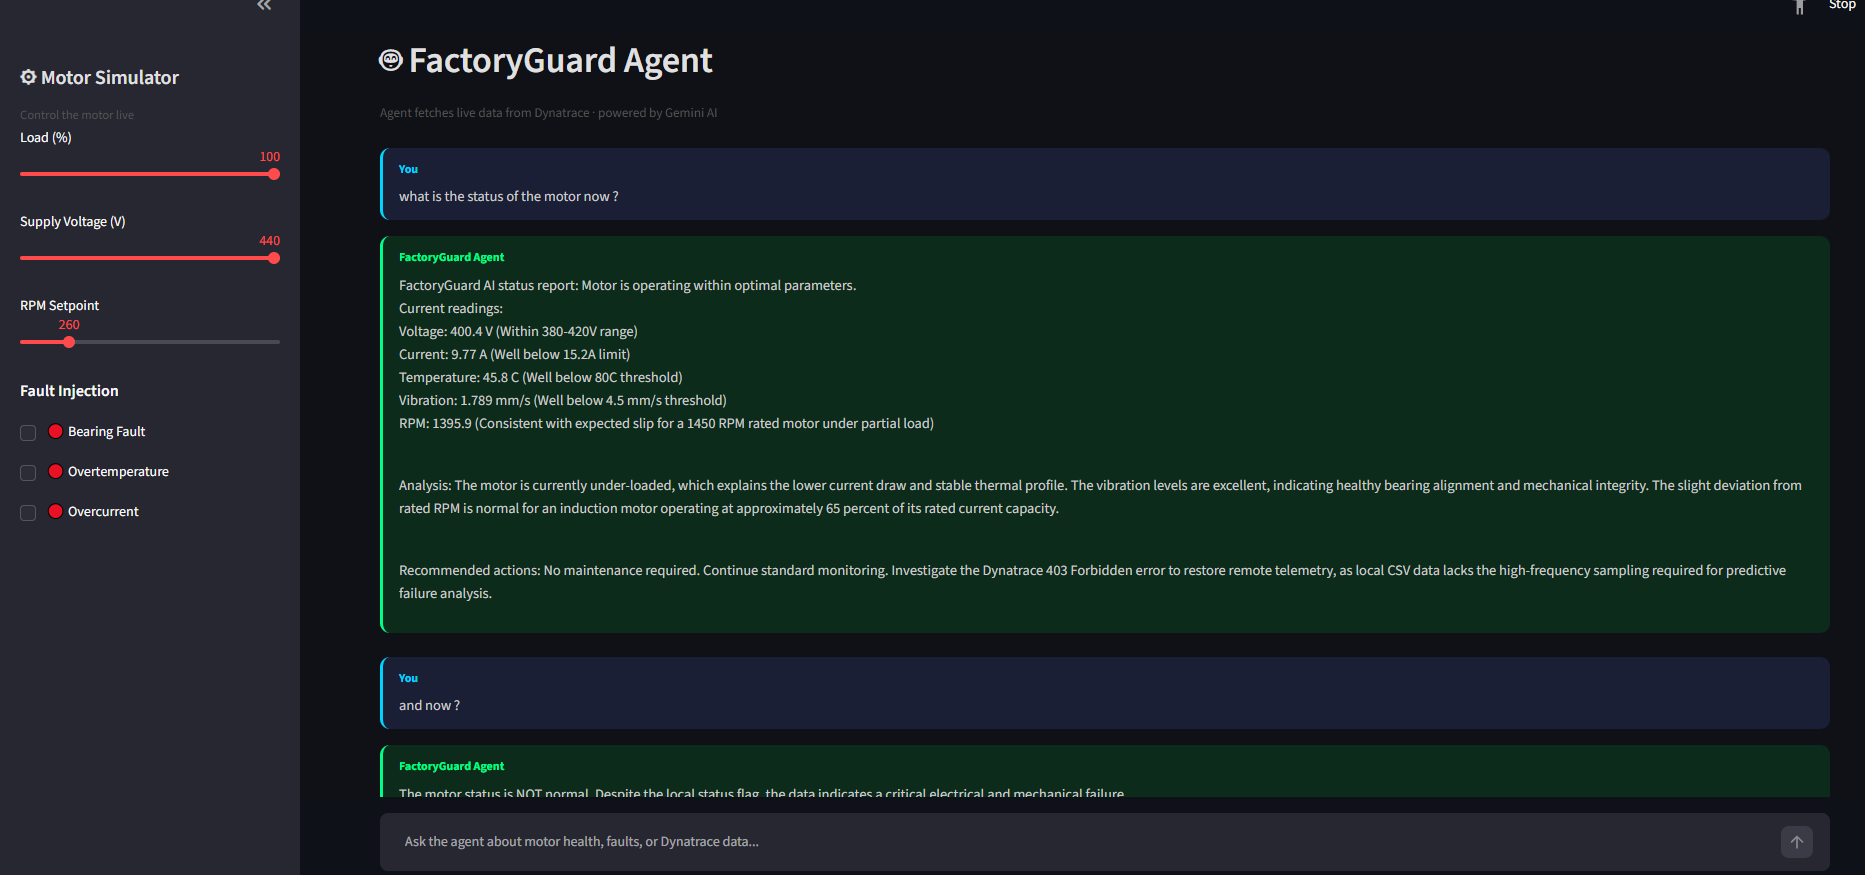
- An interactive chat agent where you can ask things like "why is the current high?" or "is the motor safe to keep running?" and get answers grounded in the actual live sensor values
- Every 10 seconds, 8 live metrics are pushed to Dynatrace, and fault events are created automatically whenever a warning or critical condition is detected
The full loop — from raw sensor data to AI-powered maintenance guidance — runs live on Google Cloud, accessible from any browser.
How I Built It
Real Motor Physics
I didn't want random numbers. Every sensor value in my simulator is calculated from real electrical engineering equations.
When you drop the supply voltage to 310V, the current automatically rises to compensate — because I = P / (√3 × V × cosφ). That's how a real motor behaves. Temperature rises with current following Joule heating. Vibration spikes during bearing faults based on ISO 10816 industrial standards. I wanted the physics to be honest, because the AI diagnosis is only useful if the data behind it makes sense.
Fault Detection Engine
I wrote a rule-based engine that runs on every data refresh and evaluates 23 engineering conditions I defined myself, covering:
- Electrical: low voltage, overvoltage, overcurrent, phase imbalance
- Thermal: high temperature, cooling failure, temperature trending
- Mechanical: vibration levels, RPM drop, bearing fault, stall detection
- Combined: cascading scenarios like voltage drop + overcurrent happening together
AI Diagnostic Agent
When faults are detected — or when you ask something in the chat — my agent builds a structured prompt with the live sensor readings, detected faults, and motor specs, then sends it to Gemini 3.1 Flash Lite.
I designed the response format myself, following how a real maintenance report is structured:
STATUS → OBSERVATIONS → ROOT CAUSE → RECOMMENDED ACTIONS → RISK ASSESSMENT
Getting this format consistent took several iterations of prompt engineering, but the result is an AI that responds like an engineer, not a chatbot.
Dynatrace Integration
I connected FactoryGuard AI to Dynatrace using the Metrics Ingest API v2, pushing 8 metrics every 10 seconds:
voltage · current · temperature · vibration · rpm · power · fault_count · severity
Whenever my fault engine detects a WARNING or CRITICAL condition, I also trigger a custom event in Dynatrace so fault history is tracked on the monitoring dashboard automatically. The chat agent queries Dynatrace directly before answering questions, so its context includes the latest values from the monitoring platform.
Deployment
I deployed the whole application on Google Cloud Run. No installation, no setup — just open the URL and start working with it.
Challenges
Making the Physics Honest
The hardest part of this project wasn't the code — it was making the simulation behave the way a real motor does. A voltage drop had to cause overcurrent. That overcurrent had to heat the windings. That heat had to approach the insulation class limit over time. Getting these cause-and-effect chains right required me to go back to my engineering textbooks and apply the actual formulas, not approximate them.
Moving the Simulator to the Cloud
I originally built the simulator as a local Tkinter desktop GUI. When I moved to Cloud Run, I had no display, no filesystem persistence, and no way for the user to interact outside the browser. I had to completely rethink the architecture — I rebuilt the entire simulation engine as a Streamlit sidebar that generates fresh physics-based data on every page refresh, driven by the user's slider inputs stored in session state. It ended up being a better experience than the original desktop version.
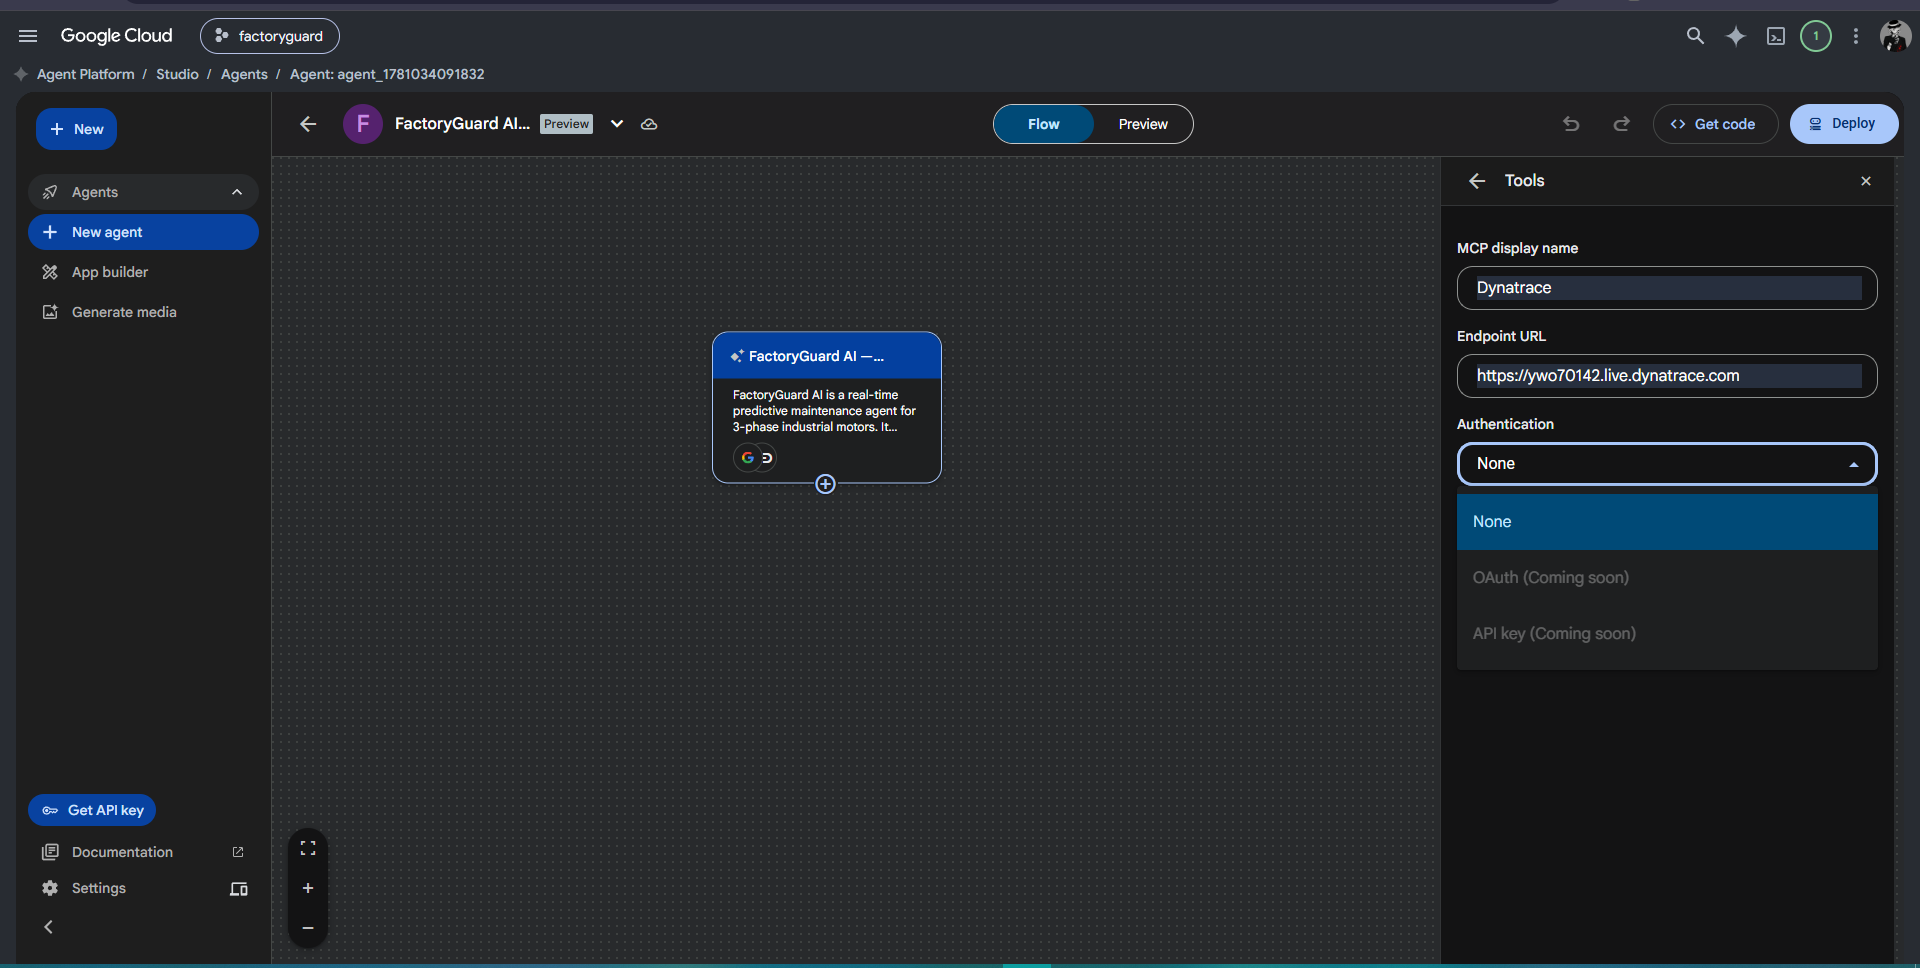
Dynatrace MCP — Not Available Yet
One of my goals was to connect the agent to Dynatrace using the Model Context Protocol (MCP), so it could query live metrics as real tool calls. I spent time going through the Dynatrace developer documentation and found that the MCP Gateway integration is marked as "coming soon" — it simply isn't accessible yet. I worked around it by querying the Metrics API v2 directly inside the agent's context function, but it's something I plan to revisit as soon as it becomes available.
Dynatrace Dashboard Sharing
I ran into an unexpected limitation: Dynatrace's new dashboard format looks great but doesn't support public sharing — only classic dashboards can be shared via a public link. I ended up building two separate dashboards: one in the new format for my own monitoring, and one in the classic format for the submission screenshots.
Data Delay
The agent at https://factoryguard-ai-316097729686.us-central1.run.app/ must run for a few minutes before data appears on the dashboard. Metrics are sent every 10 seconds (6 per minute), but Dynatrace typically displays one aggregated data point per minute, so a delay of about 4–5 minutes is expected, also, the Dynatrace free trial expires on June 23, 2026 at 20:33 UTC, while the judging period continues until July 7, 2026. As a result, live Dynatrace dashboards and monitoring features may not remain available throughout the entire judging period..
Gemini Rate Limits
During testing, especially when I was repeatedly injecting faults to check the agent's responses, I kept hitting the free tier rate limits. I added a 60-second cooldown between automatic diagnoses and built a fallback response system so the dashboard never crashes when the API is temporarily unavailable.
What I Learned
The lesson that stuck with me the most: the AI is only as good as the context I give it.
In the early versions, the agent gave vague, generic answers. Not because Gemini was bad — but because my prompts were generic. Once I started injecting precise sensor values, specific fault labels, motor ratings, and engineering thresholds into every request, the quality of the diagnosis changed completely. The AI started sounding like an engineer because I gave it the knowledge of one.
I also realized how much my electrical engineering background mattered here. Understanding why current rises when voltage drops, or how bearing faults change vibration signatures — that domain knowledge was what made the fault detection engine actually useful instead of just a list of number comparisons.
And cloud deployment taught me something I won't forget: every assumption you made locally will break in production. Path handling, session state timing, environment variables, port binding — each one failed in a different way on Cloud Run, and each failure taught me something I wouldn't have learned otherwise.
What's Next
FactoryGuard AI started with motors, but the real opportunity is much bigger.
The same architecture — physics-based simulation, rule engine, AI diagnosis, cloud monitoring — can be applied to almost any industrial machine. My next step is to expand beyond motors and cover other critical systems I've encountered in my engineering work:
- Resistance welding machines — monitoring electrode pressure, weld current, and cycle time to detect worn electrodes and weld quality degradation before rejects start appearing on the line
- Industrial robots and automation arms — tracking joint torque, positioning drift, and cycle time anomalies to predict gearbox wear and servo motor failures
- Hydraulic systems — monitoring pressure, flow rate, and fluid temperature to detect pump wear, valve leakage, and seal degradation
- Air compressors and pneumatic systems — tracking pressure curves, motor current, and temperature to catch valve failures and bearing issues early
- CNC machine spindles — vibration and current analysis to detect tool wear and spindle bearing degradation before they affect part quality
- Conveyor systems — monitoring belt tension, motor load, and roller vibration to prevent unexpected line stoppages
The long-term goal is a multi-machine industrial AI platform where a single monitoring agent covers an entire factory floor — any machine, any fault, any industry. FactoryGuard AI is the first module of that vision.


Log in or sign up for Devpost to join the conversation.