


Inspiration
Market leadership in A-shares can change quickly. A sector may appear to be the “first mainline” one day, rotate into a secondary confirmation the next day, or lose momentum despite strong short-term performance.
I wanted to build a system that could answer a question most dashboards leave unanswered:
After a signal is generated, did it actually work?
The project began as a market-rotation dashboard and evolved into a free-data-first signal validation platform. Its purpose is not to place trades or automatically change investment decisions, but to measure whether the system’s existing signals remain useful across different market environments.
What I Built
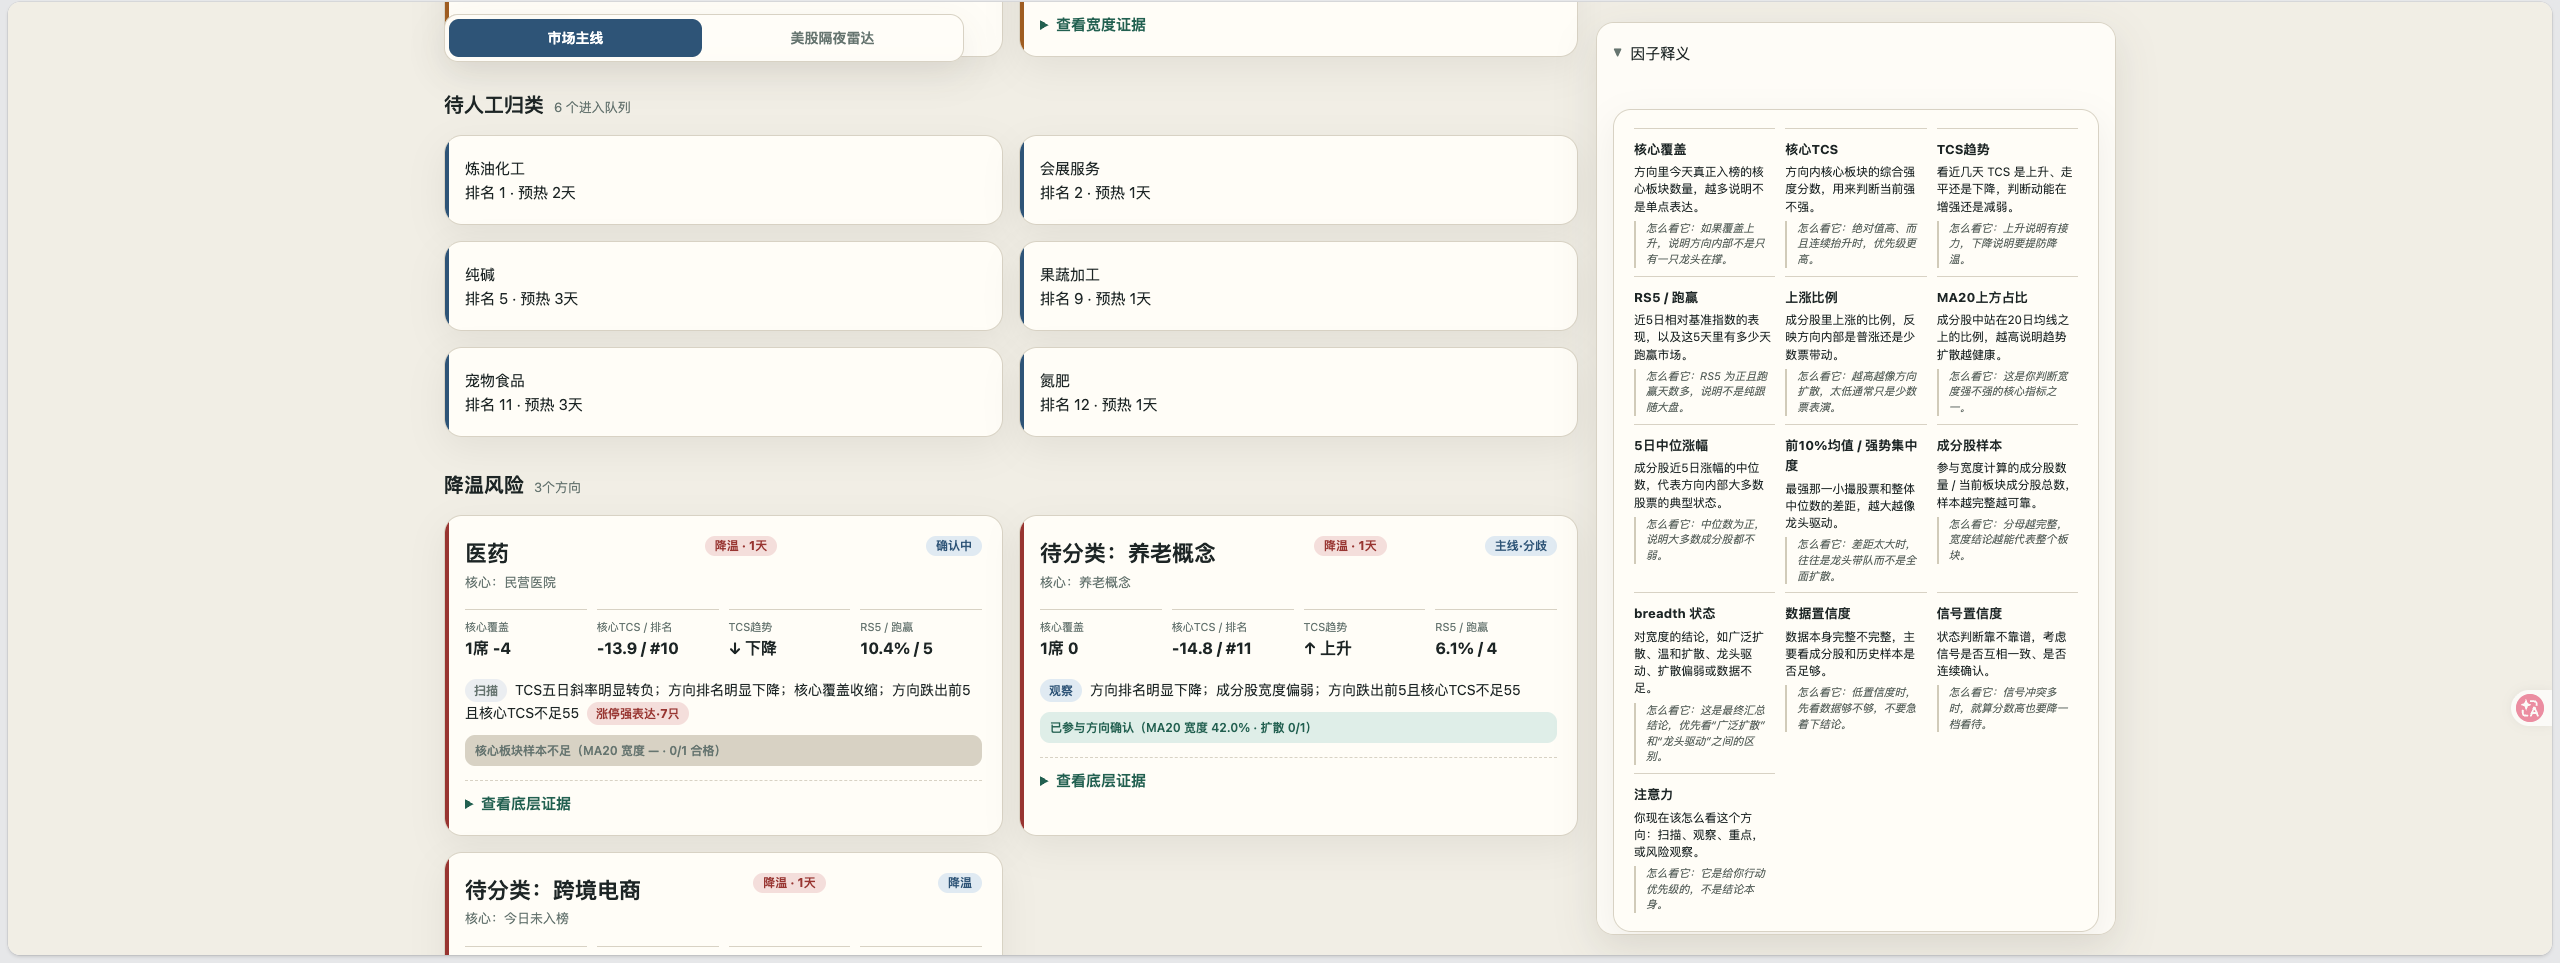
The project detects and tracks A-share market-rotation signals such as:
- Primary mainlines
- Secondary confirmations
- Candidate or warming sectors
- Upgrades
- Cooling sectors
Each official signal is frozen as a historical snapshot so that it cannot be rewritten after the outcome becomes known. The system then follows the signal over multiple horizons:
[
R_{\mathrm{cum}}(T)
\prod_{t=1}^{T}(1+r_t)-1 ]
where (r_t) is the daily return of the signal basket.
The validation windows are:
- T+1, T+3, T+5 for short-term timing quality
- T+10, T+20 for medium-term persistence
For every mature window, the system calculates:
- Cumulative return
- Excess return versus the CSI All Share and CSI 300
- Maximum favorable excursion (MFE)
- Maximum adverse excursion (MAE)
- Maximum drawdown
- Basket coverage
- Whether the signal succeeded
- Whether the signal transitioned correctly
The system also groups results by signal type, market environment, and episode. A continuing mainline is treated as one episode rather than being counted as many independent daily samples.
How I Built It
The system is built as a local Python application with a SQLite data layer and a dashboard interface.
Data acquisition
The architecture prioritizes free sources:
- AKShare and Tonghuashun (THS) data
- Local historical caches
- Other free fallback sources when available
- Paid iFinD access only as an emergency option
Historical board returns are normalized into a common structure so that different sources can be compared and audited. Each record keeps provenance, freshness, validation status, and coverage information.
Signal lifecycle
Signals follow an explicit lifecycle:
pending → official
pending → aborted
A signal is frozen first, tracked over future trading days, verified when its windows mature, and only then finalized. Re-running the pipeline is idempotent and does not overwrite valid results.
Validation center
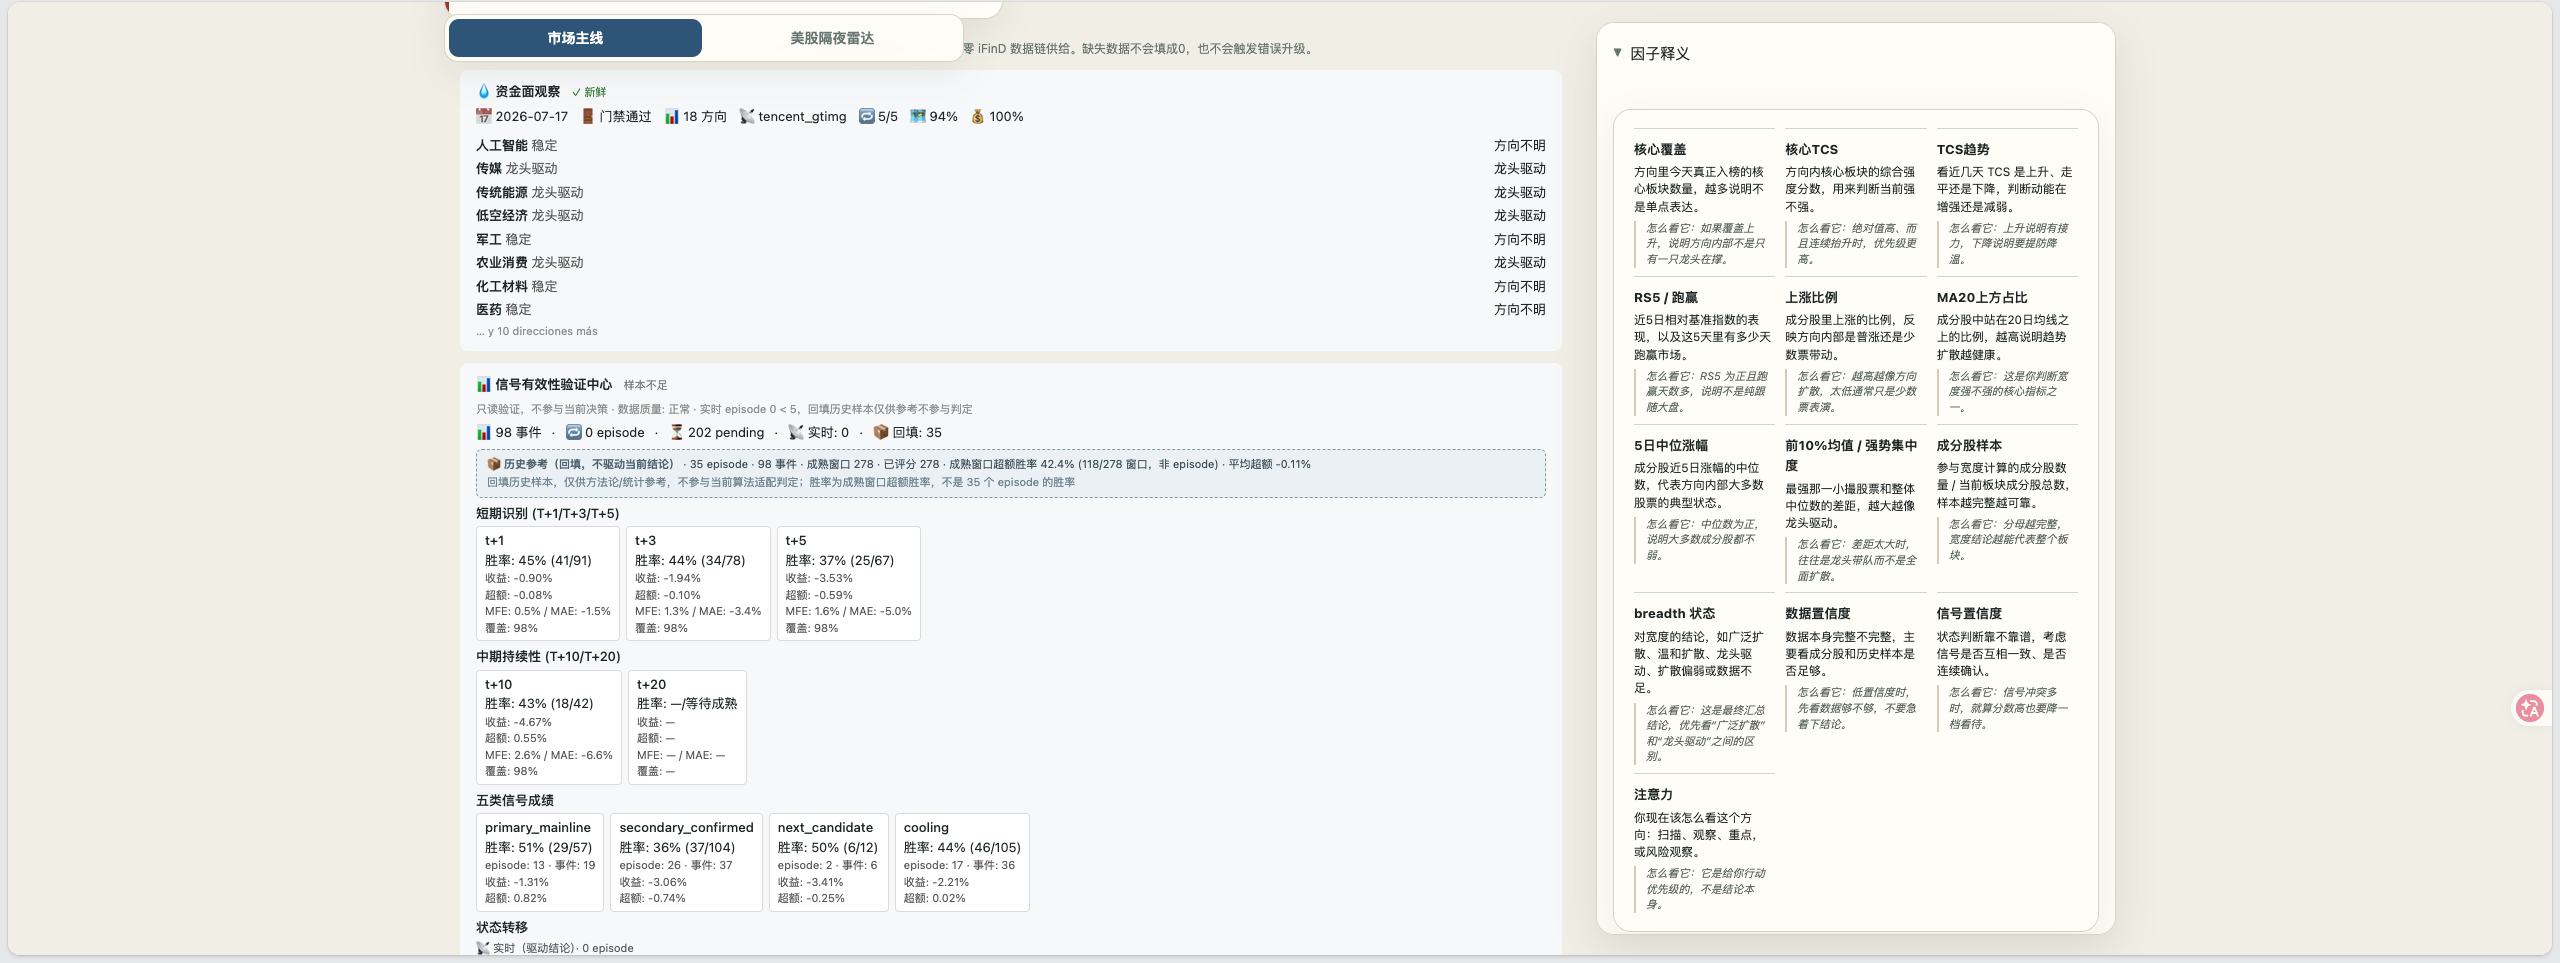
The dashboard includes a read-only Signal Validation Center showing:
- Short-term and medium-term performance
- Results by signal type
- Results by market environment
- Candidate-to-active transitions
- Upgrade-to-mainline transitions
- Mainline persistence
- Cooling-to-weakness outcomes
- Recent events and window maturity
- Real-time samples versus historical backfill samples
Historical backfill is clearly separated from real-time observations. It can provide methodological reference, but it does not drive the current conclusion.
What I Learned
The most important lesson was that measuring a signal is more difficult than generating one.
A single return number is not enough. A useful validation system must preserve:
- The exact signal snapshot
- The data source used
- The market environment at signal time
- The signal’s episode identity
- The maturity state of each evaluation window
- The difference between missing data and a negative outcome
I also learned that short-term accuracy and long-term persistence are different properties. T+1 and T+3 can measure timing, while T+10 and T+20 are needed to evaluate whether a market mainline actually lasts.
Finally, I learned that data engineering details—units, date alignment, transaction boundaries, cache freshness, and test isolation—can materially change analytical conclusions.
Challenges
Inconsistent free-data sources
Free APIs do not always provide the same board names, codes, or historical coverage. Some endpoints were rate-limited, while others were blocked by the local network environment.
The solution was a multi-source router with source health checks, circuit breakers, explicit provenance, and verified board-name mappings.
Board-name and code mapping
Concept boards and industry boards often use different naming conventions. A broad direction such as “new energy” may correspond to several concrete boards.
I built mapping logic that discovers and validates THS concept and industry codes, then links broad directions to their actual constituent boards. Unknown mappings remain visible as data gaps instead of being silently substituted.
Avoiding false conclusions
The validation system initially treated incomplete metrics as failures. This produced a misleading “persistent mismatch” conclusion even though the data was historical backfill and not real-time evidence.
The fix was to distinguish:
- Data quality
- Sample sufficiency
- Historical reference results
- Real-time algorithm fit
When there are no real-time episodes, the current status correctly remains “insufficient sample.”
Data persistence and test safety
During development, I encountered problems involving SQLite transaction persistence and tests accidentally pointing to the production database.
The final system resolves database paths at connection time, isolates tests with temporary databases, verifies persisted rows after writes, and protects real-time records during backfill.
Results
The completed validation center contains:
- 98 historical backfill events
- 35 episodes
- 490 verification windows
- 278 mature windows
- 202 pending windows
- 10 insufficient-data windows
- 0 iFinD calls for the free-data backfill
- Explicit separation between real-time and historical samples
The mature historical windows currently show an excess-return win rate of approximately 42.4%. This is displayed as historical reference only and is not used to alter live market decisions.
What Comes Next
The next stage is continued real-time accumulation. As new trading days complete, the system will:
- Freeze current signals.
- Track their board returns.
- Mature T+1 through T+20 windows.
- Compare real-time results with historical reference.
- Show whether the current rules are insufficiently sampled, under observation, currently compatible, or persistently mismatched.
The project is intentionally designed so that validation informs future rule review without silently changing the live strategy. Any future calibration will require sufficient samples, historical replay, shadow testing, versioning, and explicit approval.


Log in or sign up for Devpost to join the conversation.