Inspiration
Real estate analysis today is slow, fragmented, and heavily reliant on manual data collection from multiple disconnected sources. We wanted to build something that makes understanding a market feel instant and intuitive, where instead of digging through spreadsheets, you can just open a map and immediately see what is happening. The goal was to create a tool that makes users feel smarter about a market within seconds.
What it does
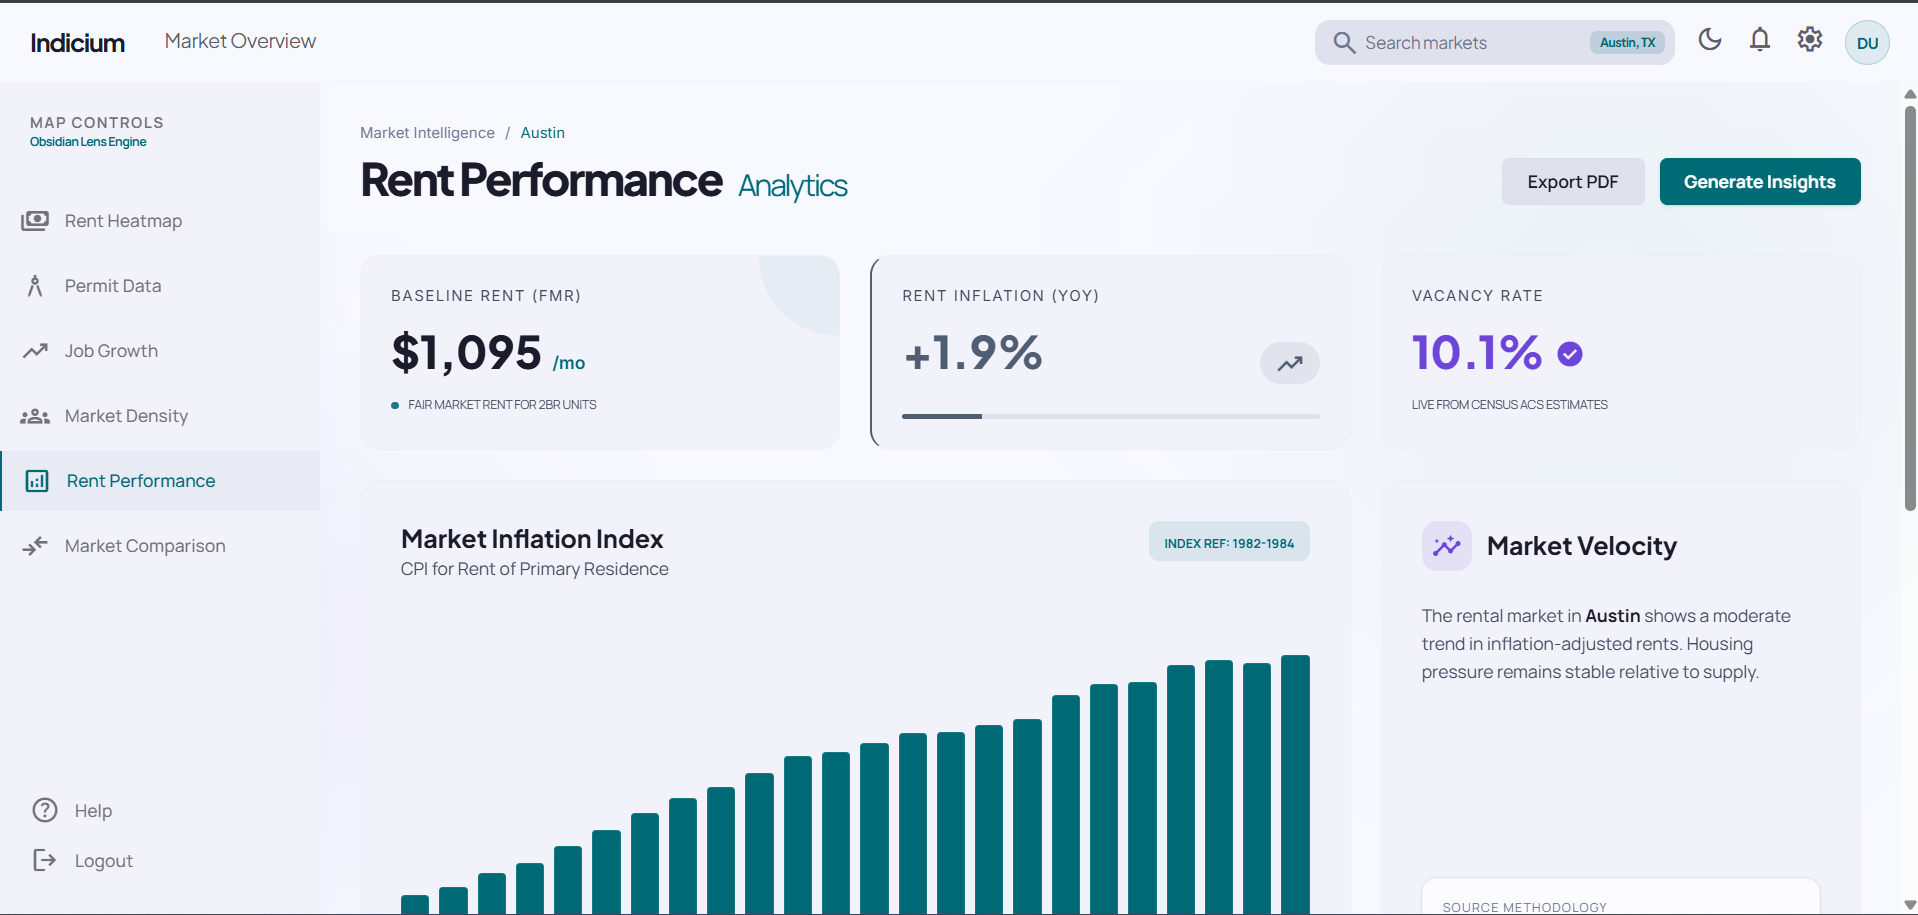
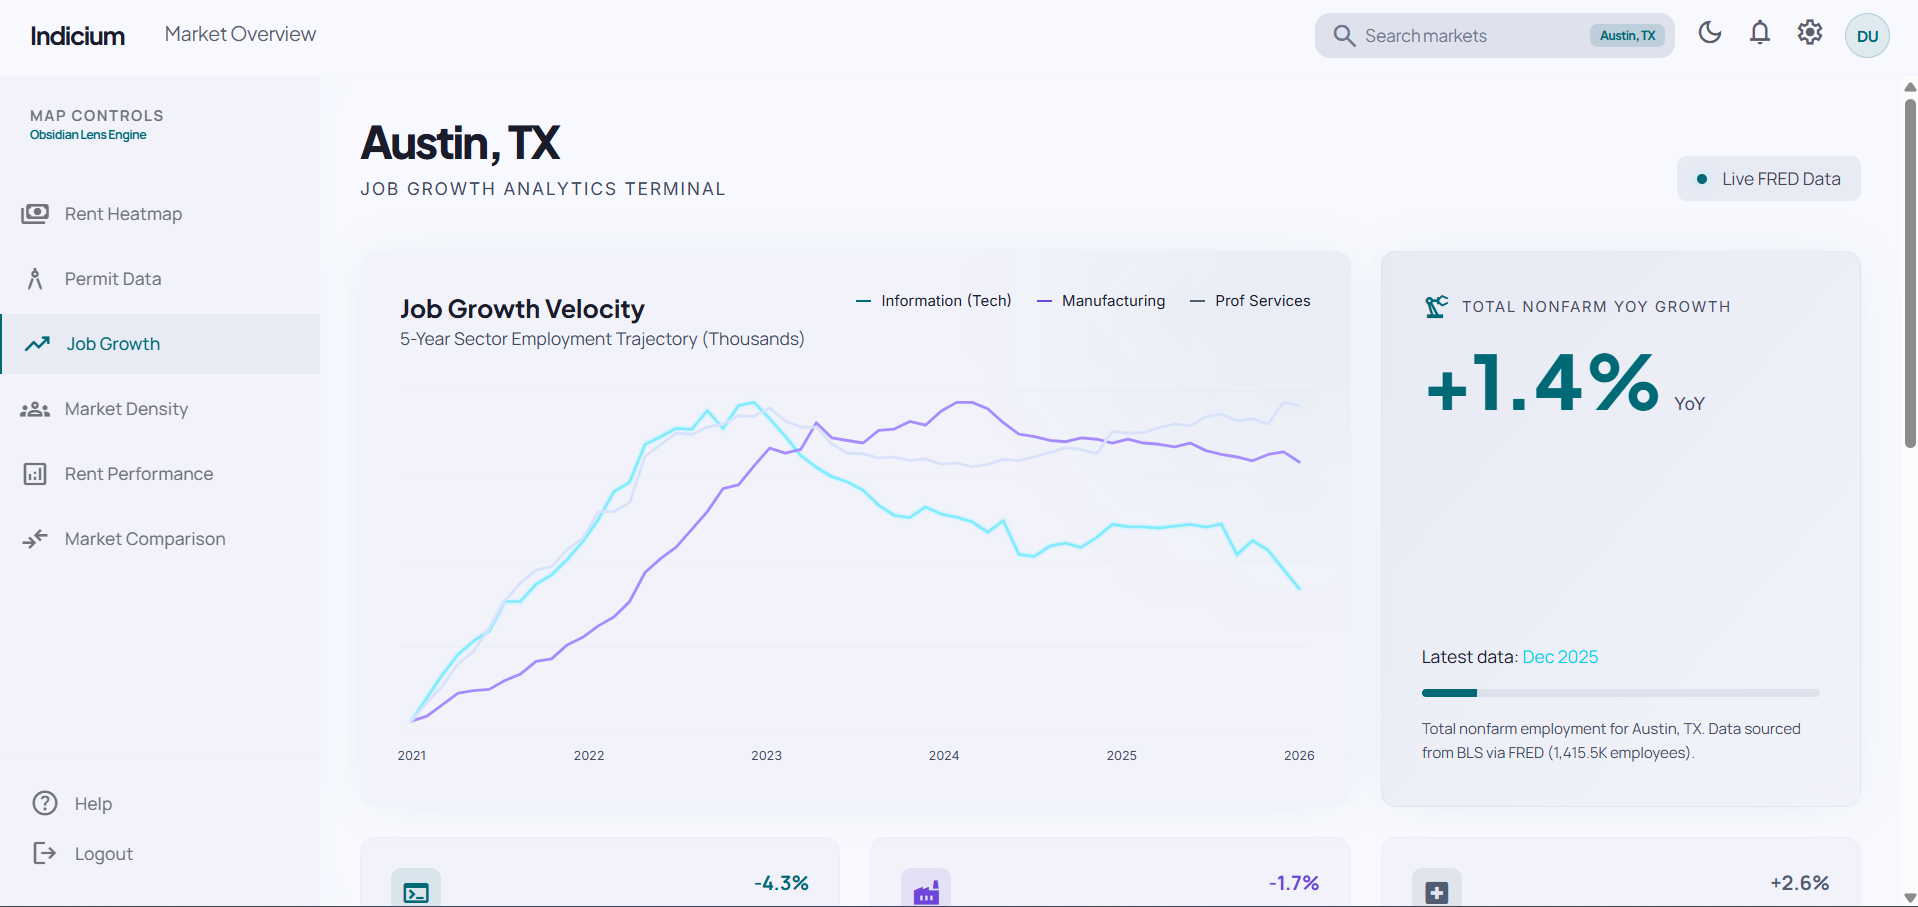
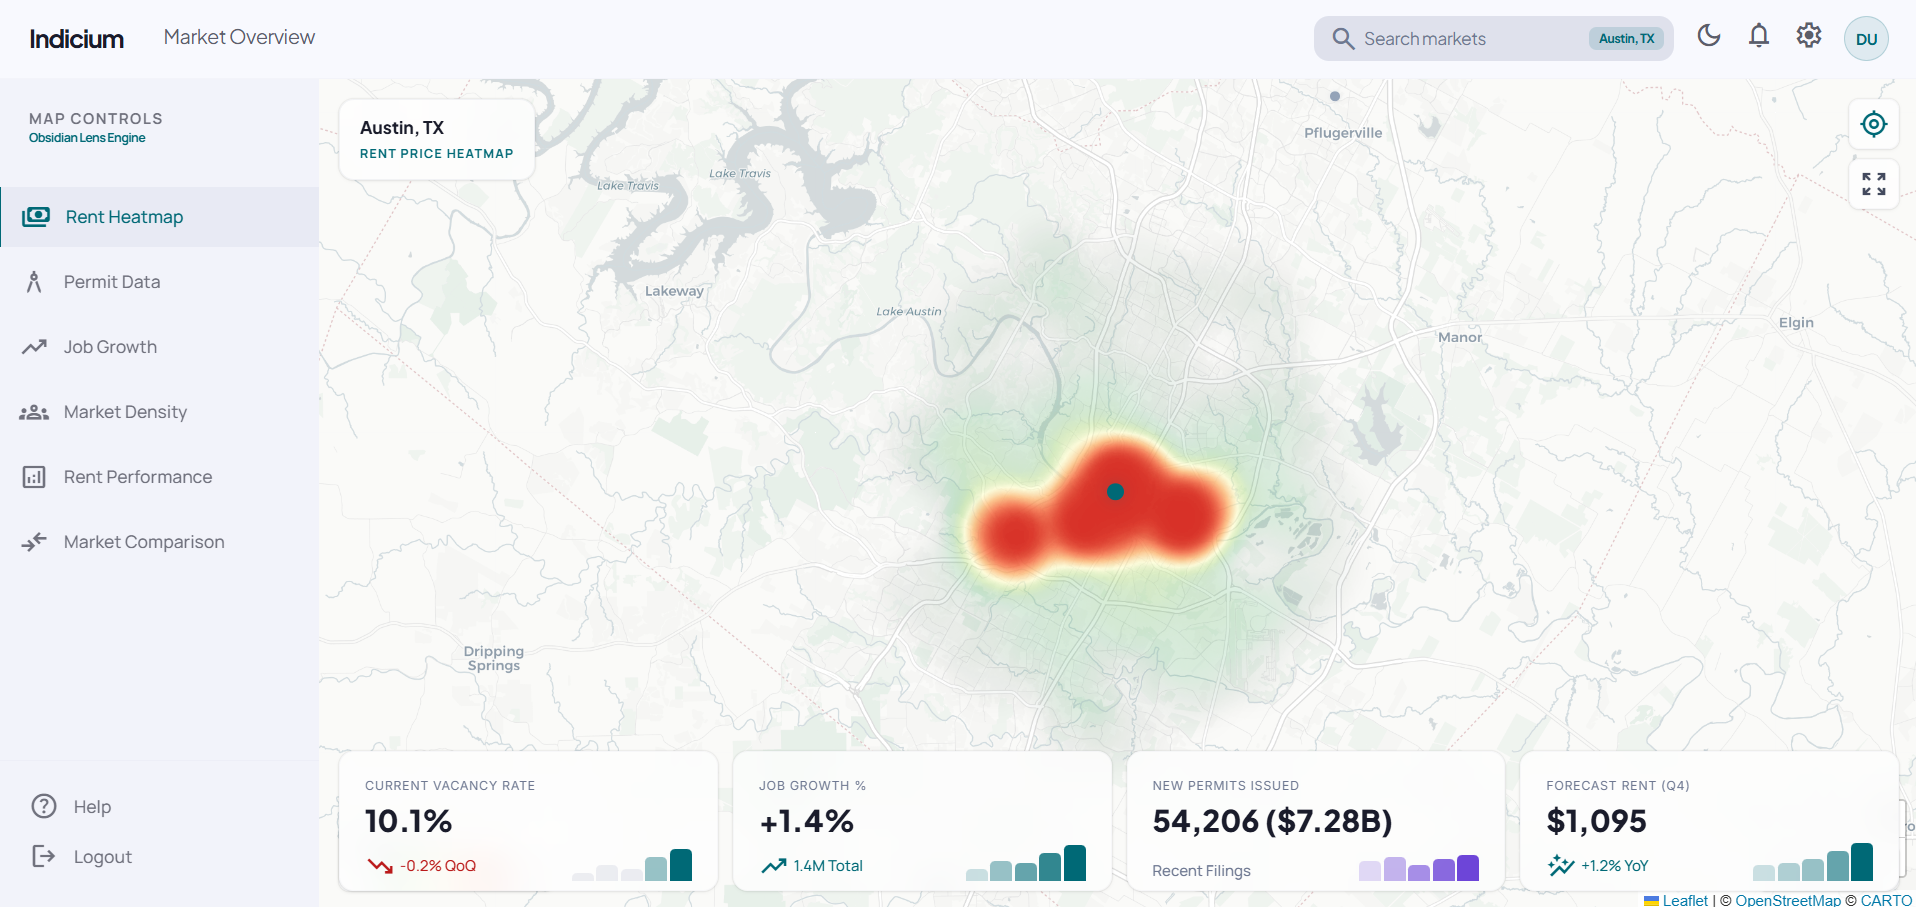
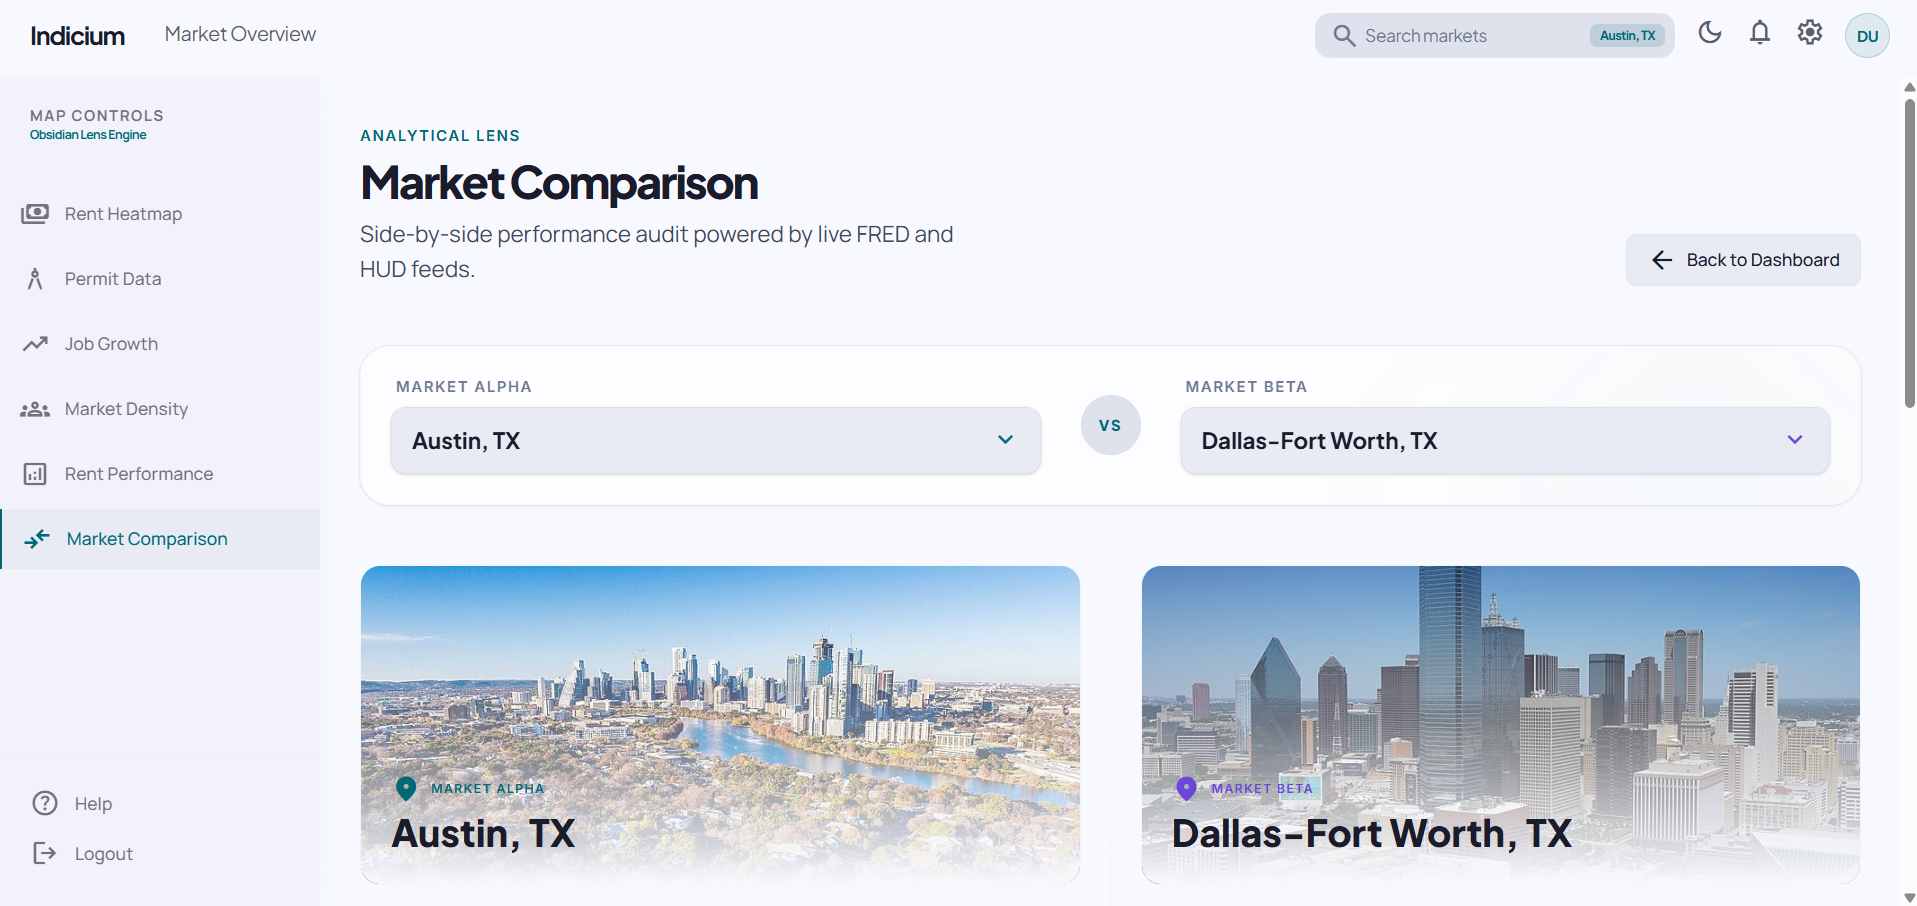
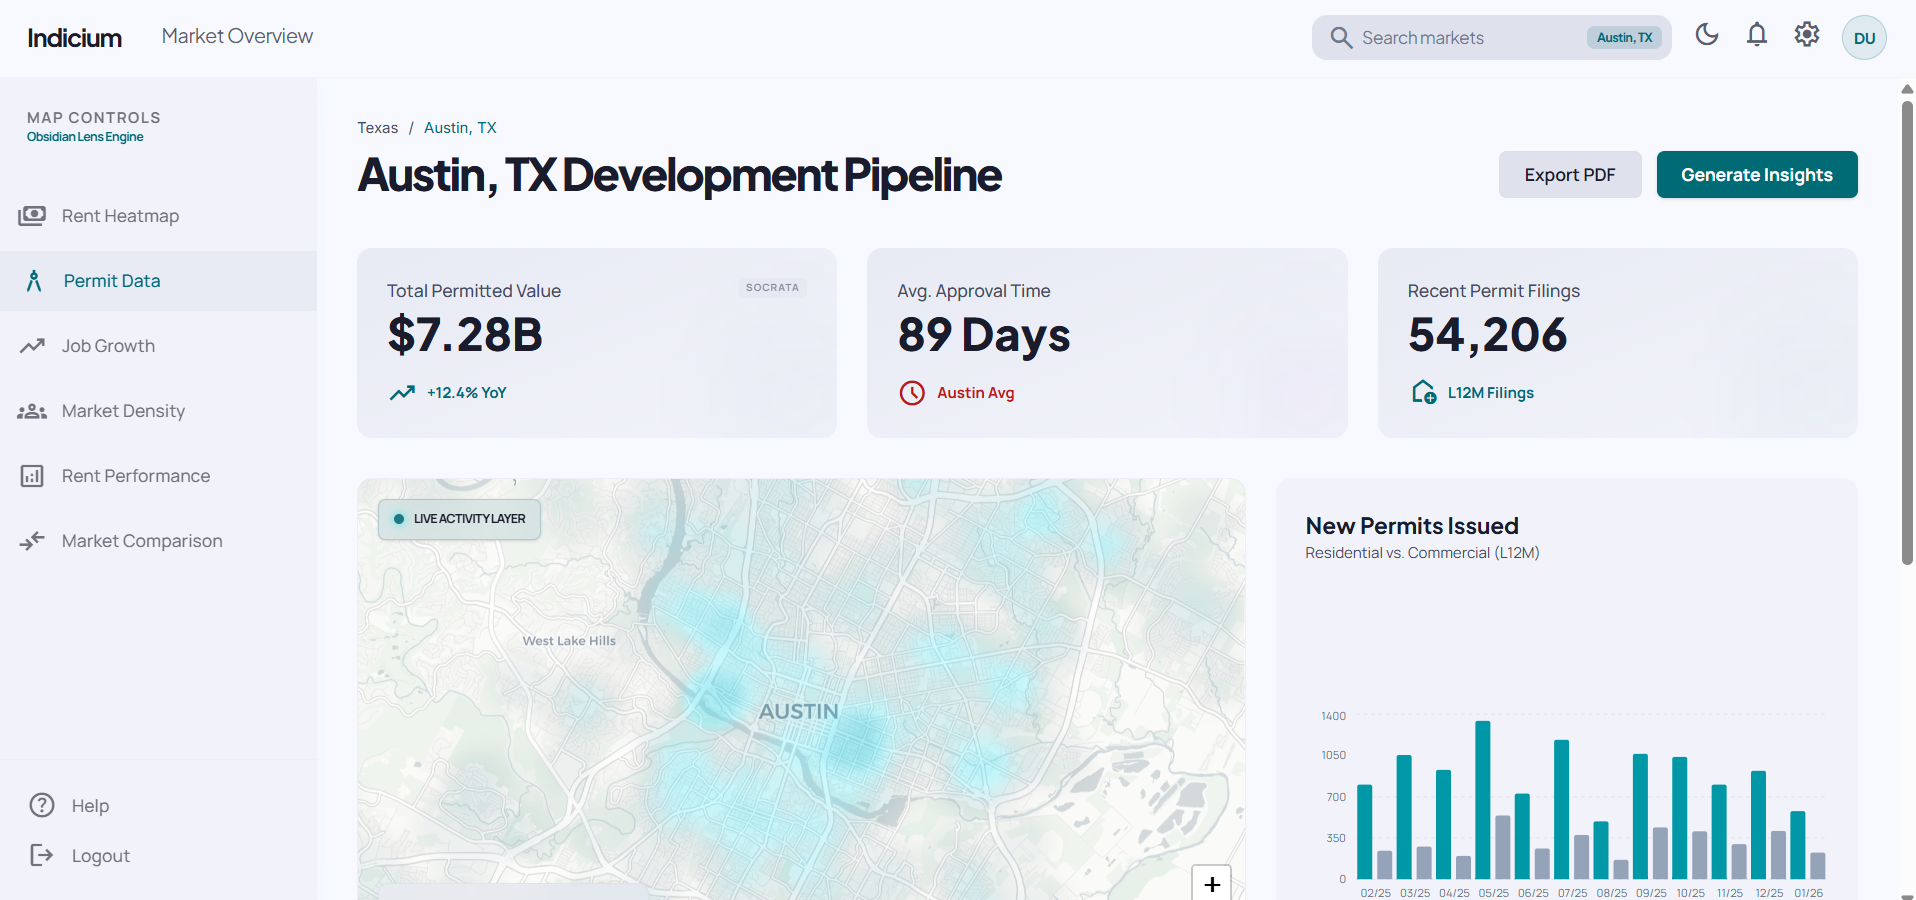
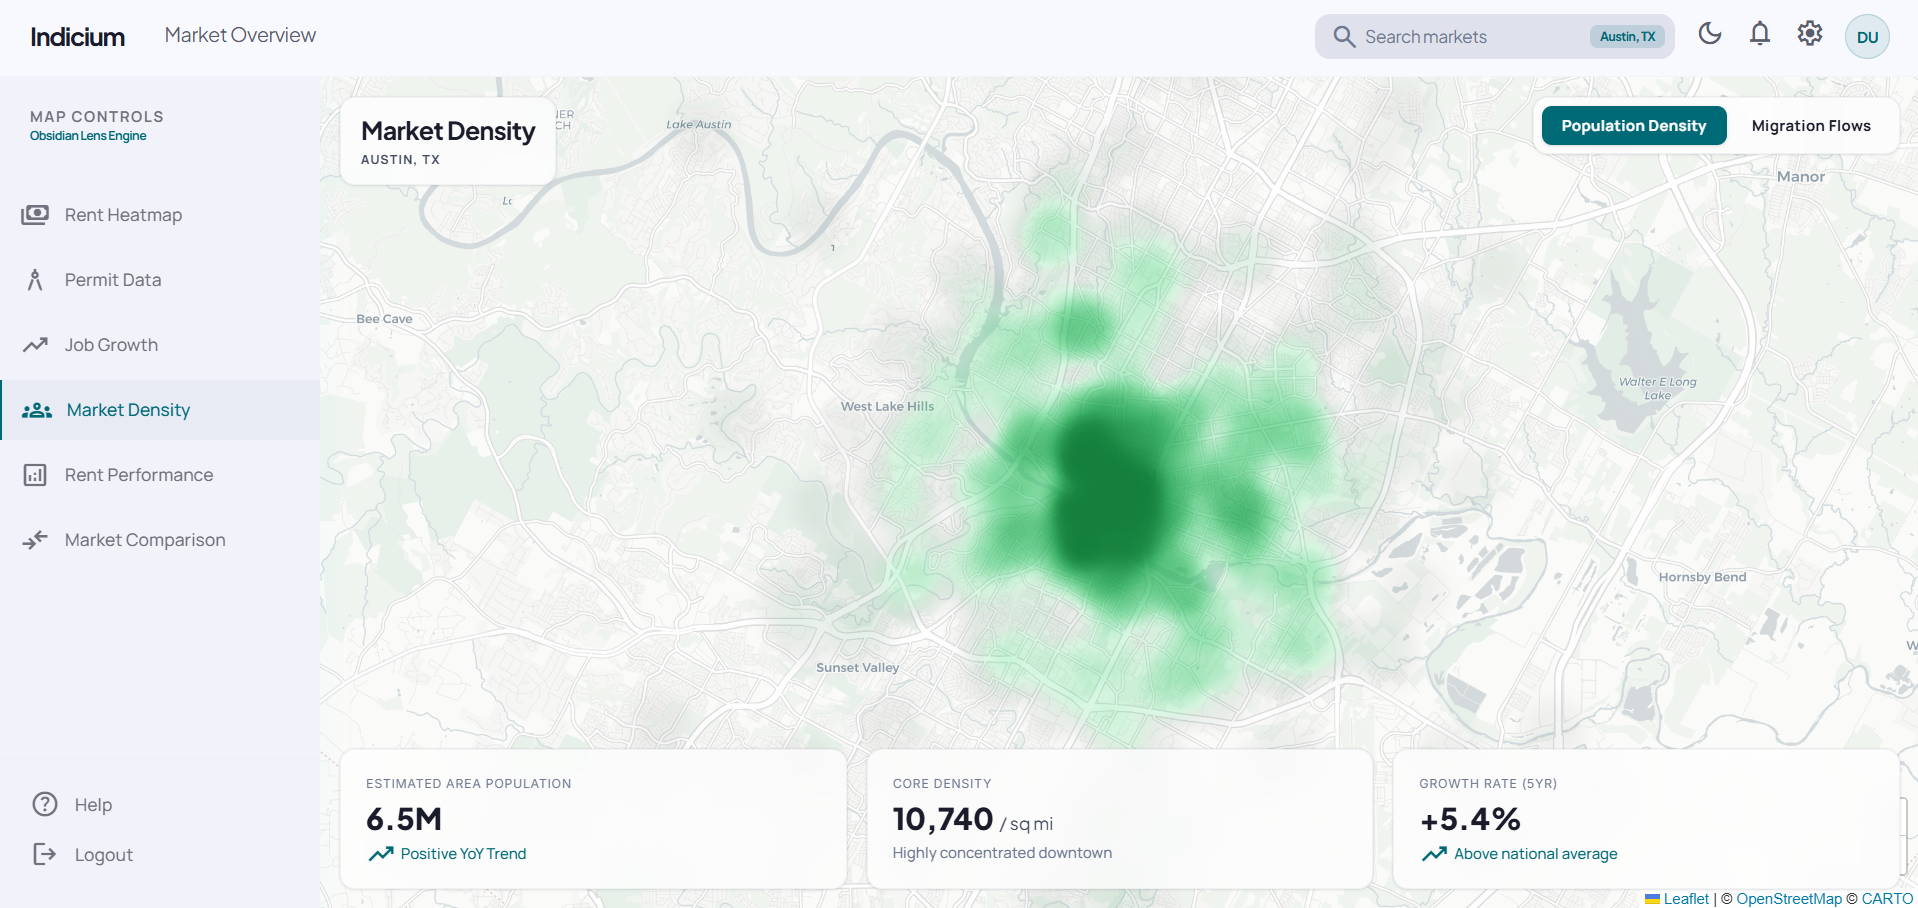
Indicium is a real estate data platform that pulls data from multiple public sources, cleans and normalizes it, and displays it through a geospatial dashboard. Users can select a city or submarket and instantly view layers like rent heatmaps, building permits, job growth, and migration patterns. It turns complex datasets into clear, visual insights tied directly to location.
How we built it
We built a data ingestion pipeline that pulls from sources like FRED, Census ACS, HUD, and local permit APIs, then processes and standardizes the data into a unified format. On the frontend, we used OpenStreetMap to render an interactive map with dynamic overlays and heatmaps. The system is designed to be dynamic, allowing users to switch markets and have new data fetched and rendered in real time.
Challenges we ran into
One of the biggest challenges was normalizing data from different sources that all had different formats, update frequencies, and levels of granularity. We also had to figure out how to efficiently map large datasets onto a geospatial interface without hurting performance. Another challenge was designing a UI that balances showing a lot of information while still remaining intuitive for users.
Accomplishments that we're proud of
We successfully built a working end to end pipeline that pulls live data, processes it, and visualizes it in a clean and interactive dashboard. The ability to dynamically switch between markets and instantly see updated insights is something we are especially proud of. We also created a system that makes complex real estate data much more accessible and understandable.
What we learned
We learned how to work with large public datasets and deal with inconsistencies across different data sources. We also gained experience in geospatial visualization and how to present complex information in a user friendly way. Most importantly, we learned how important it is to design tools around how users actually think and explore data.
What's next for Indicium
Next, we want to expand the number of supported markets and add more data layers like vacancy rates, pricing trends, and predictive analytics. We also plan to improve the user experience by adding better summaries, tooltips, and customization options. Long term, we want Indicium to become a powerful tool for anyone making real estate decisions, from students to professional developers.
Built With
- antigravity
- api
- flask
- gemini
- google-cloud
- node.js
- python
- react
- typescript
- vite


Log in or sign up for Devpost to join the conversation.