-
-
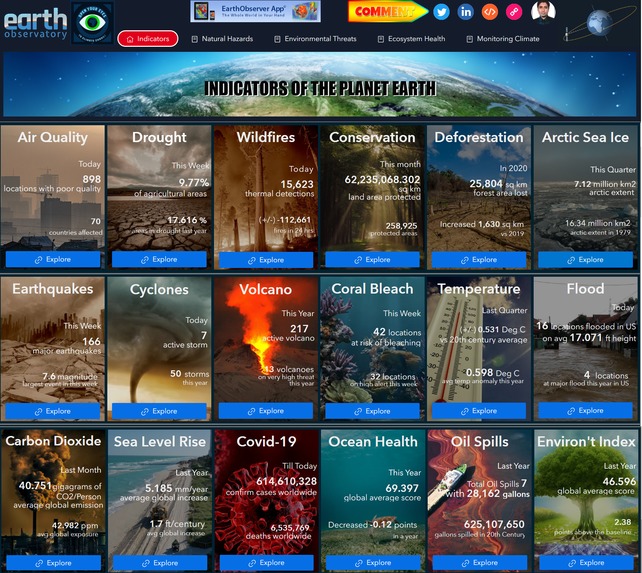
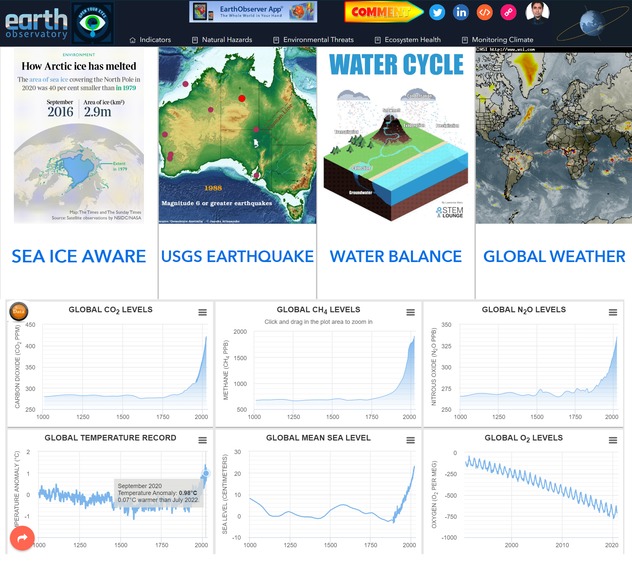
Apps homepage is infused with 18 various Earth Indicators synced with GIS servers providing Earth observations in realtime.
-
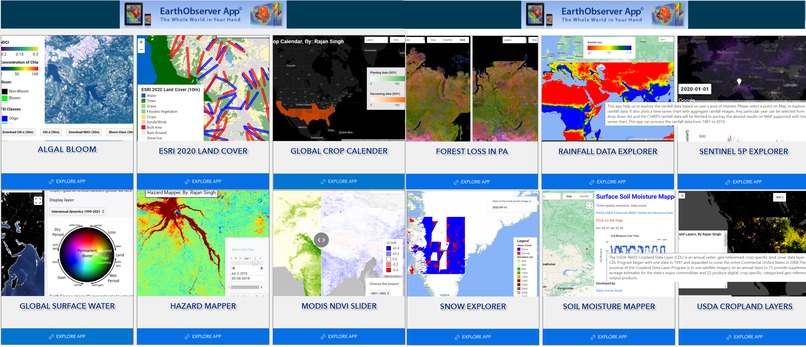
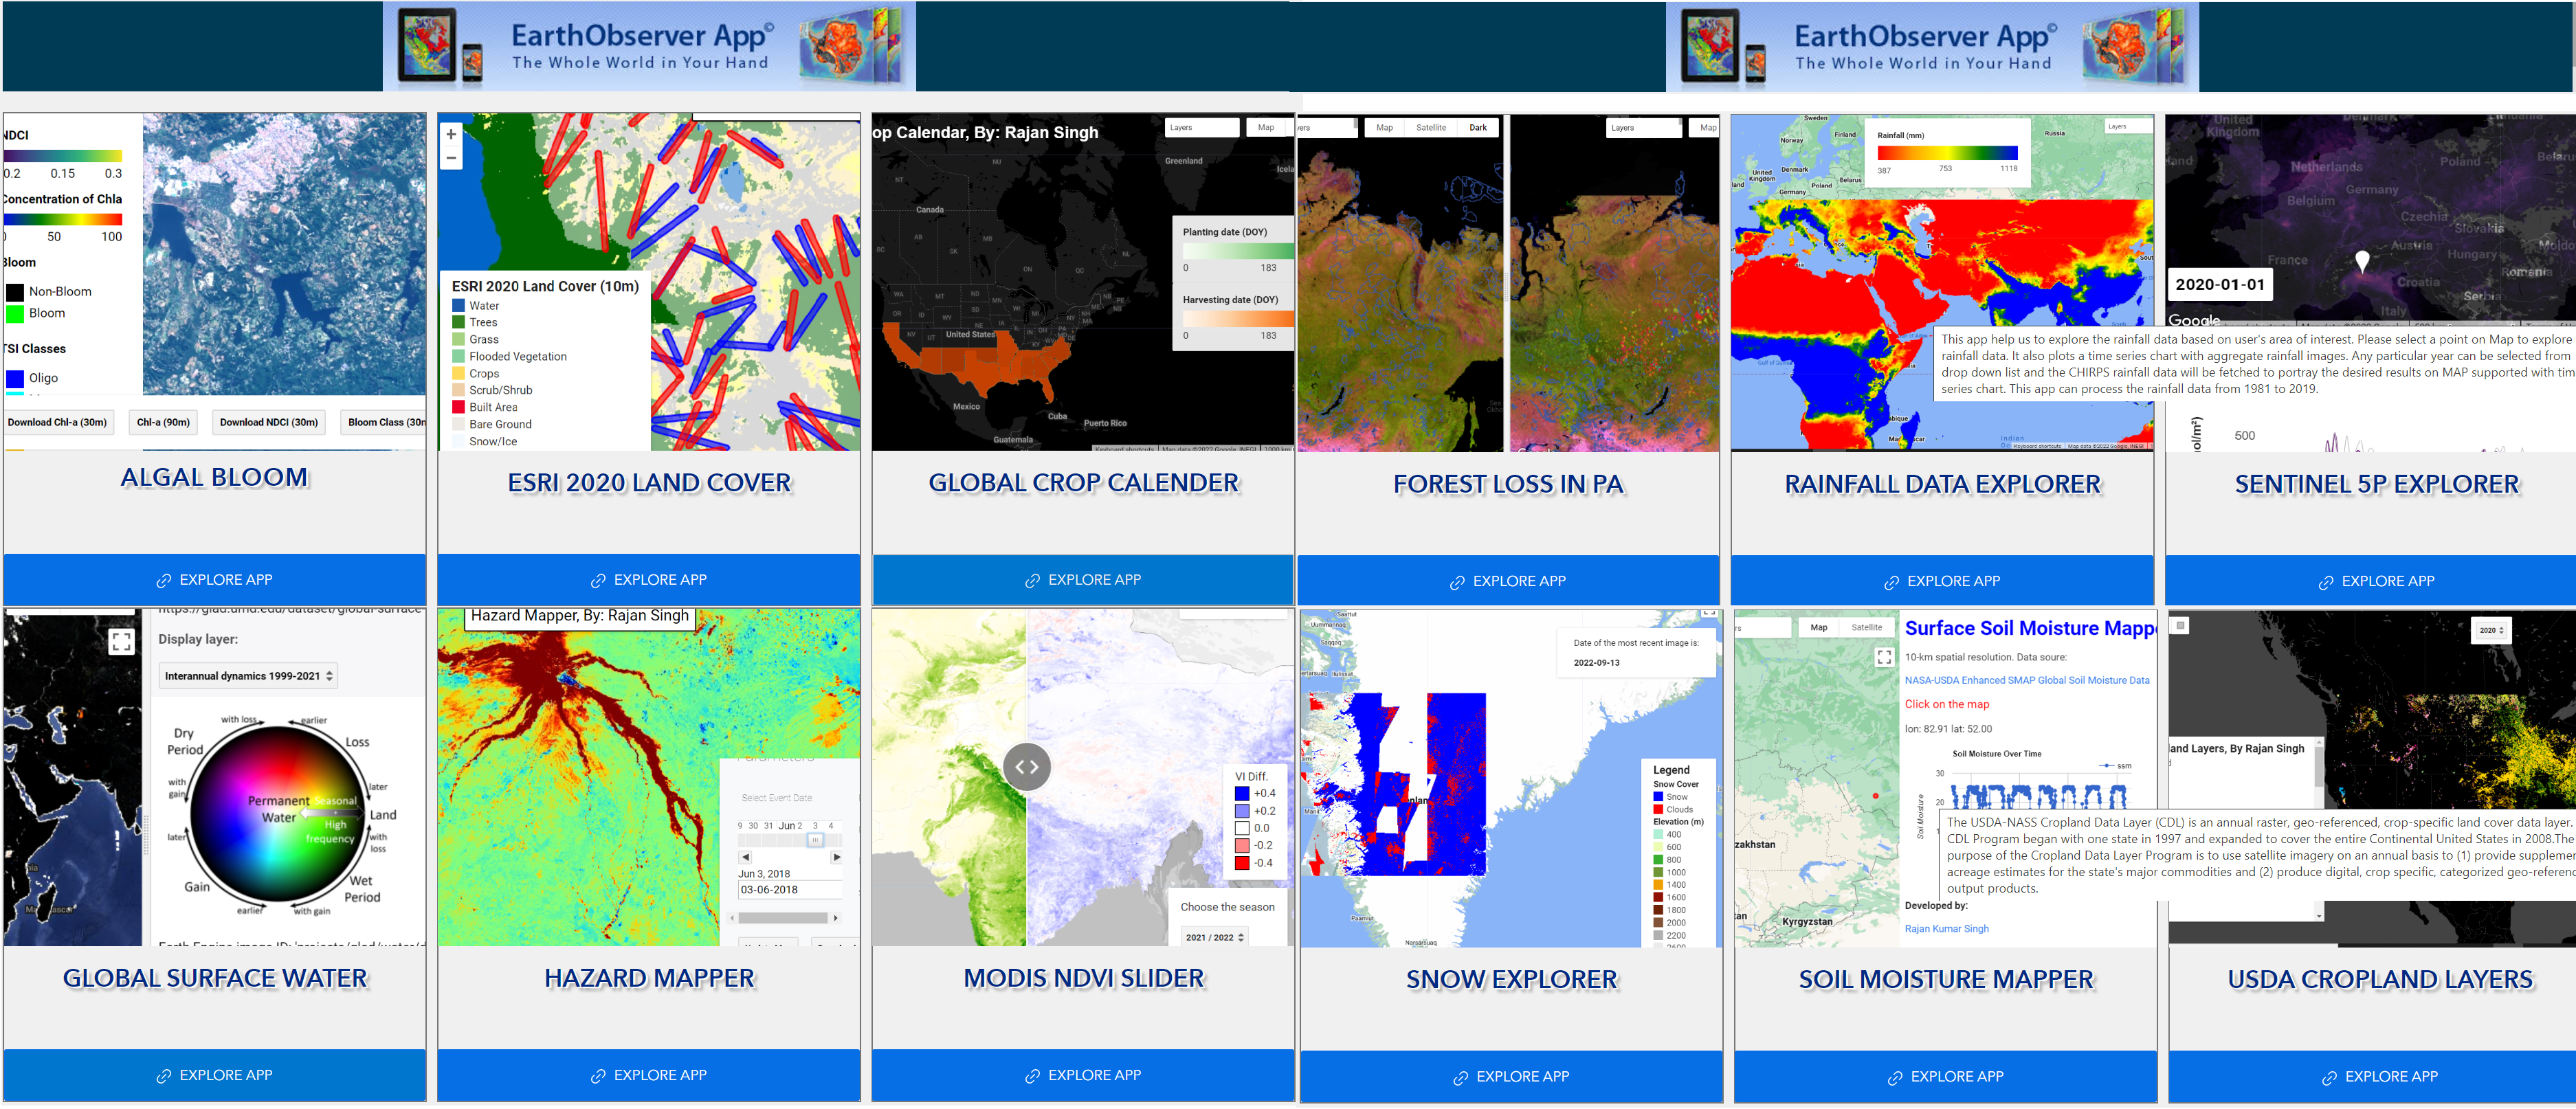
A collection of 12 Earth Observer Apps developed in Earth Engine by using various EO datasets available in public domain.
-
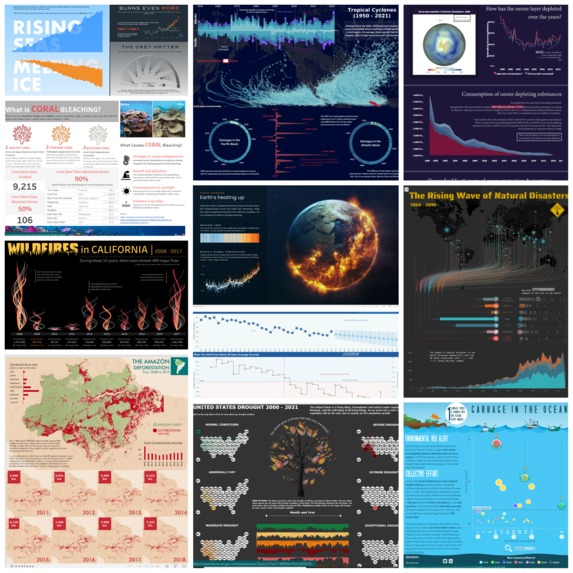
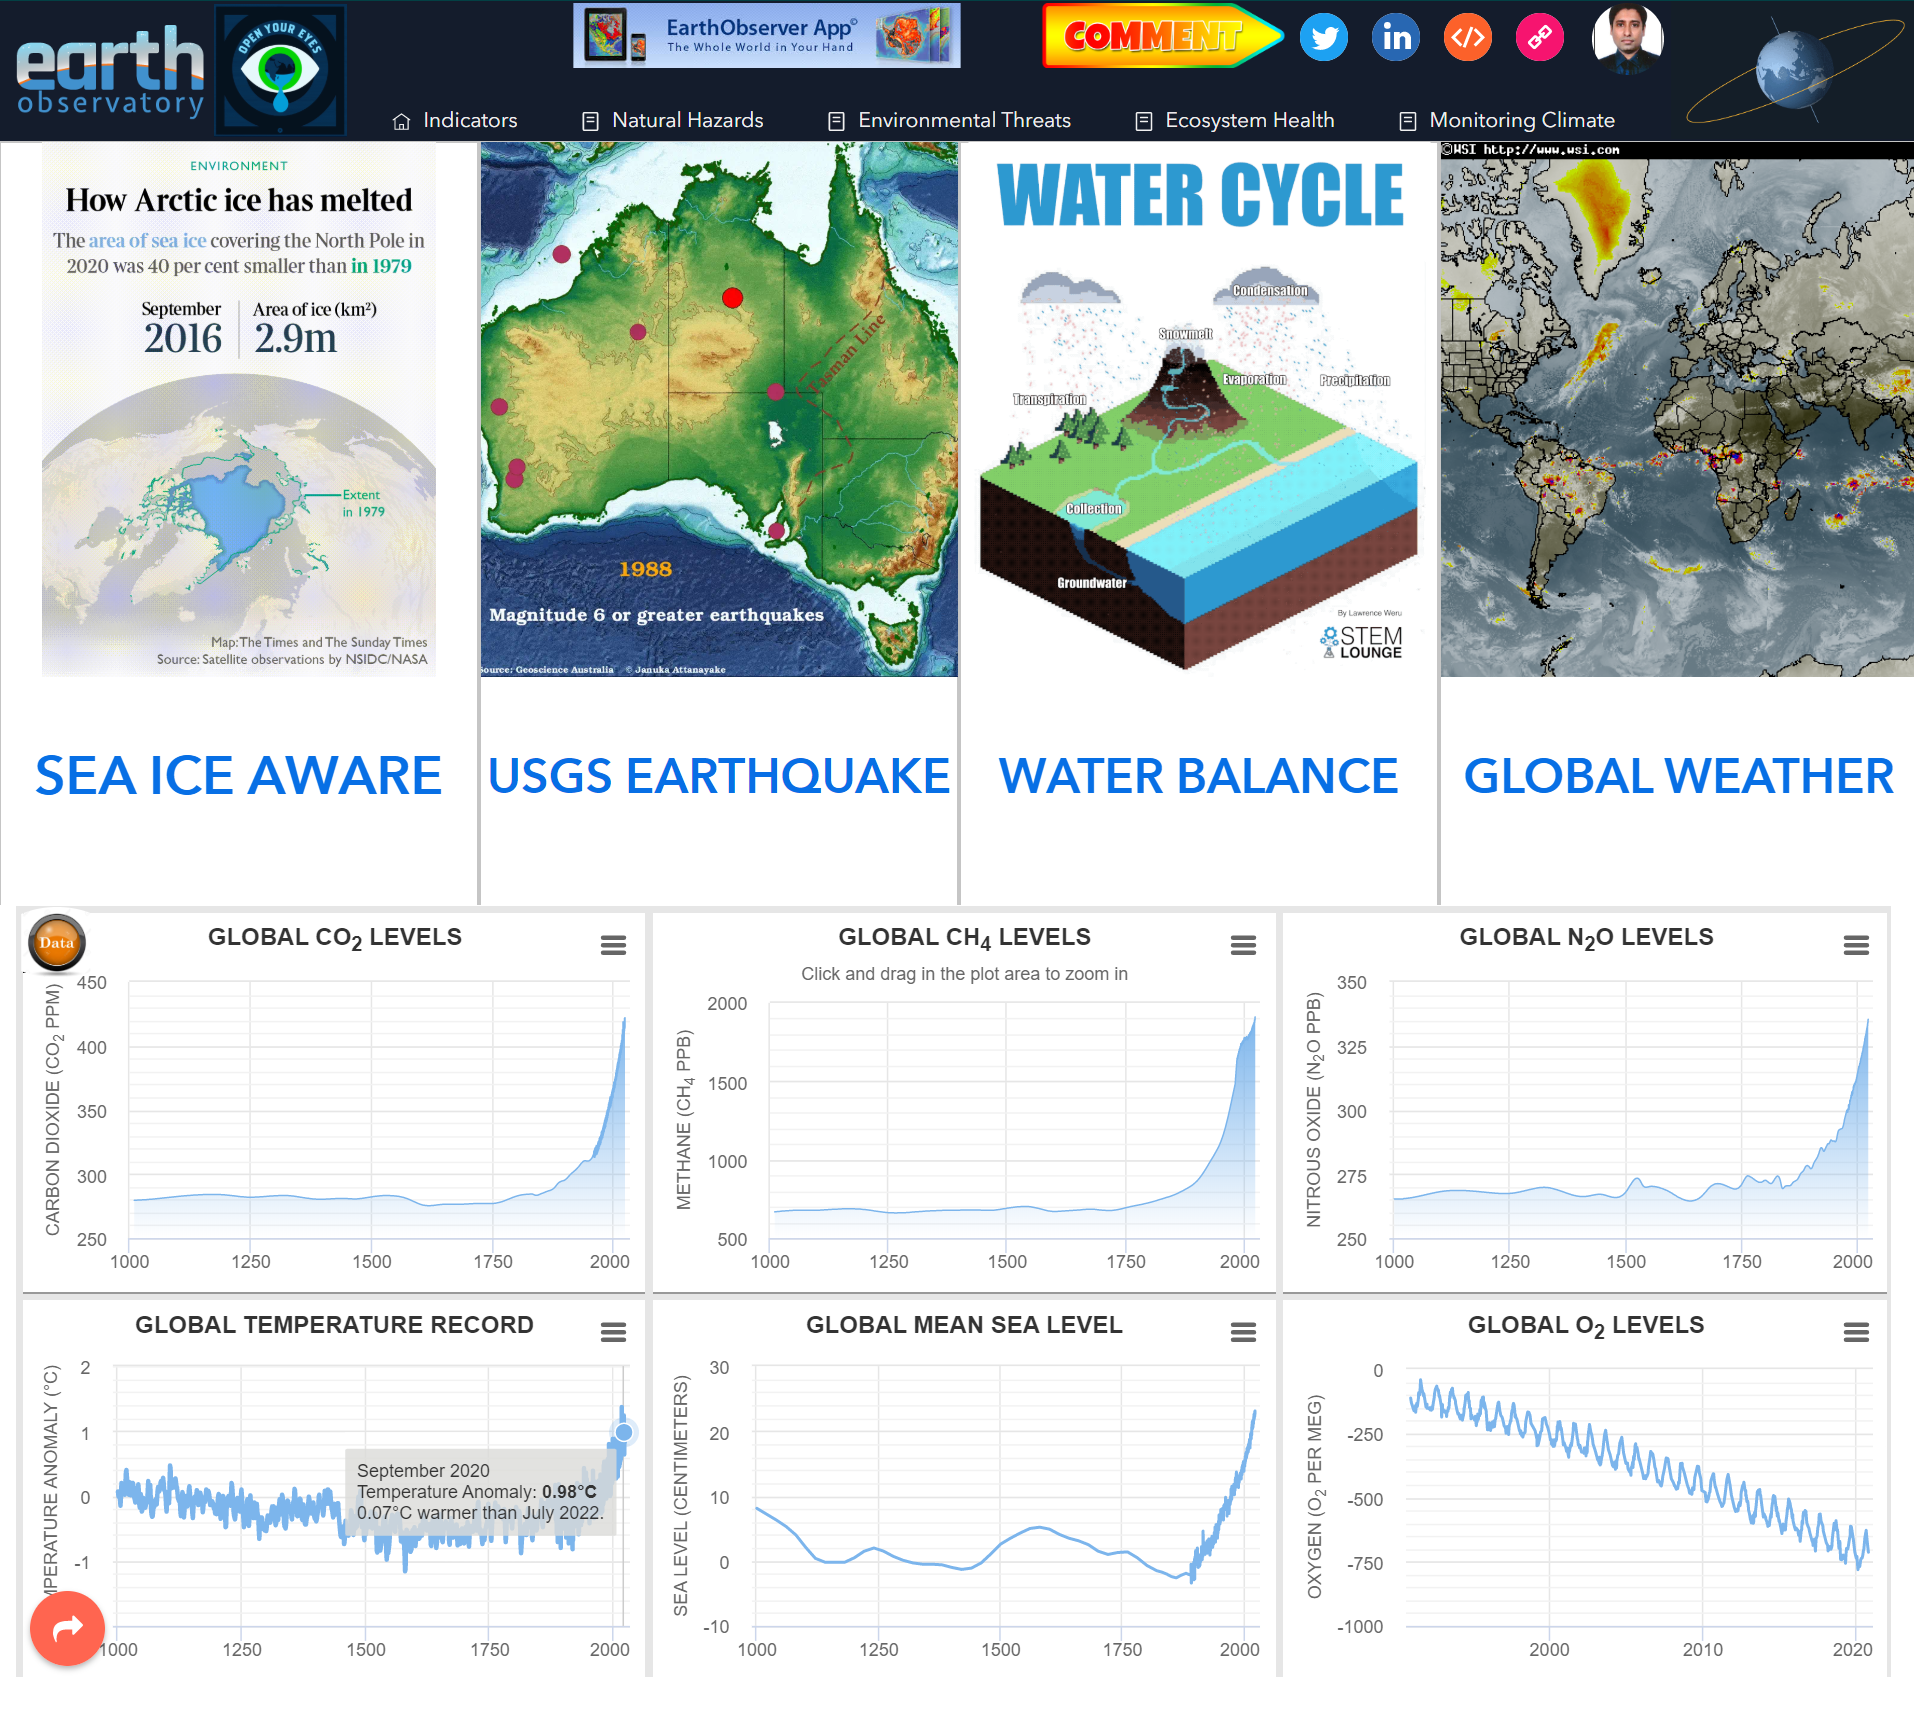
Detailed infographic analysis based on historical, current and forecasted data is derived in 18 Tableau apps.
-
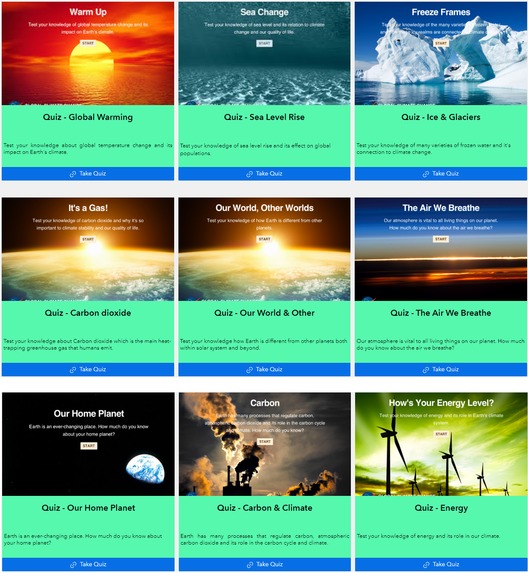
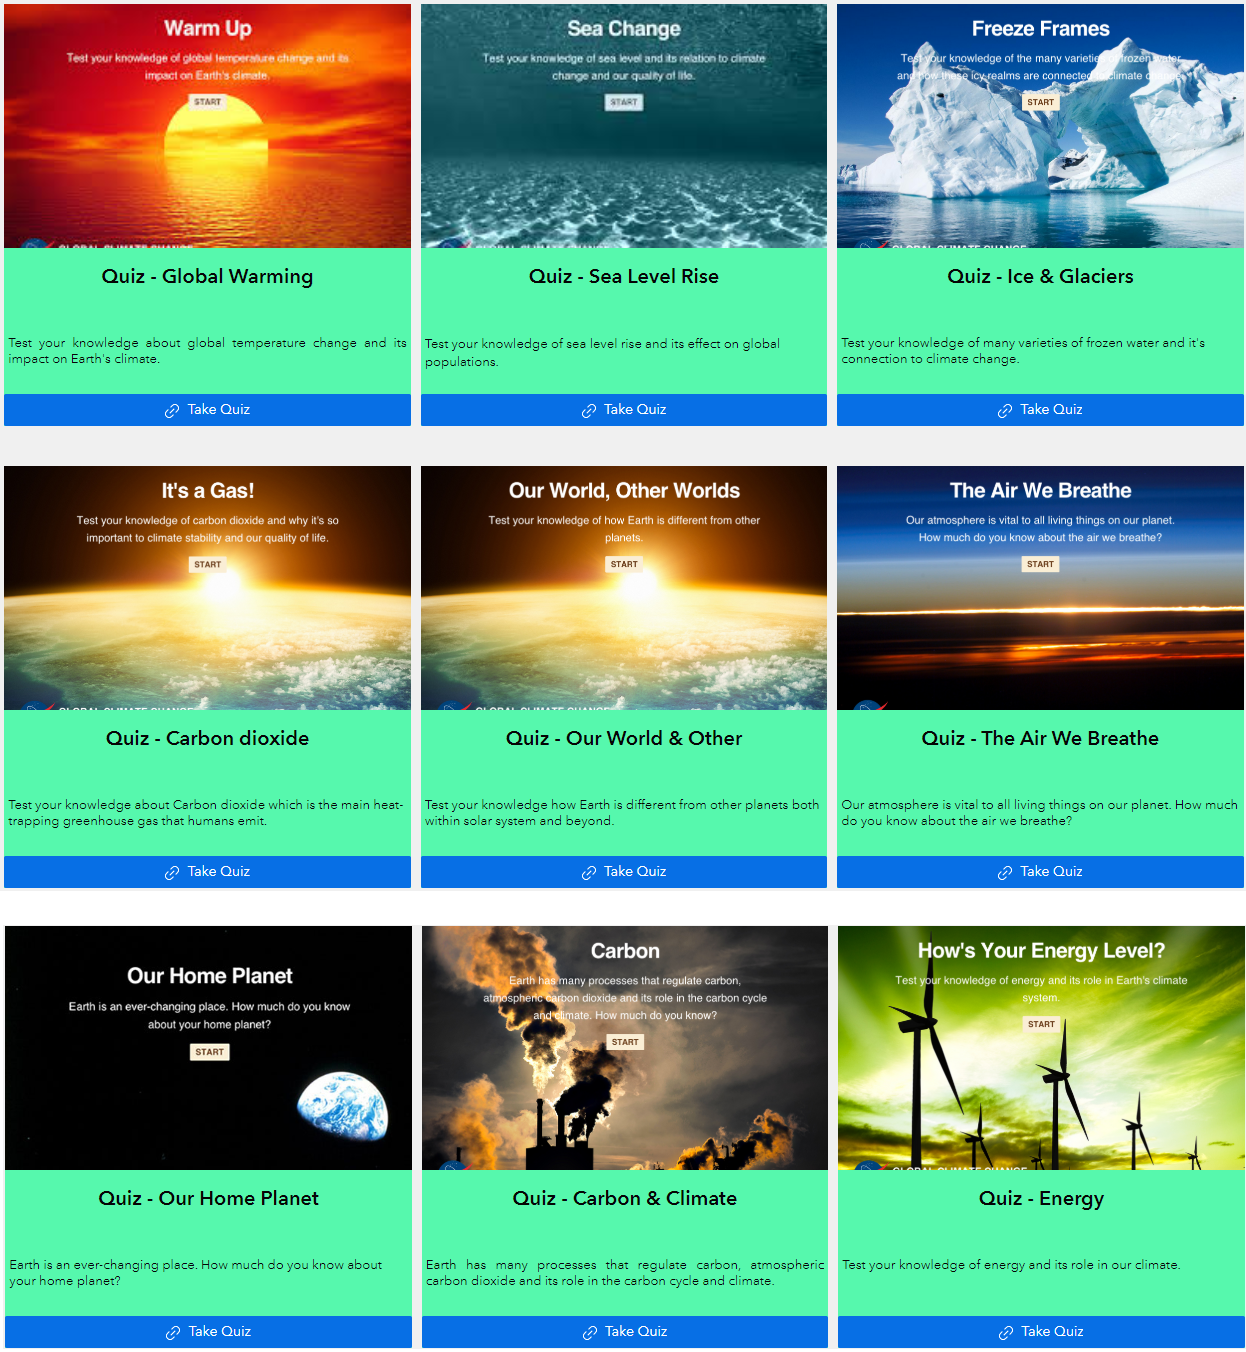
A interactive collection of 09 quizzes shared directly from NASA’S Global Climate Change portal to engage the users by testing their Accumen
-

Team Logo
-
Shared resources


Inspiration: Environment and climate are one of my favorite topics for exploration. Many people think climate change mainly means warmer temperatures. But temperature rise is only the beginning of the story. Because the Earth is a system, where everything is connected, changes in one area can influence changes in all others.
The consequences of climate change now include, among others, intense droughts, water scarcity, severe fires, rising sea levels, flooding, melting polar ice, catastrophic storms and declining biodiversity.
Hence there is an utmost need to create awareness amongst our current & future generations to understand the severity of climate change and it’s impact..
What it does: This web app is able to fetch the results based on user inputs by playing around the intuitive tabs and buttons and portray the results of climate severity in a very simplified manner. Not only climate severity, this portal also share the methods and steps which may turn saviour for the planet Earth.
Knowing is half the battle. This indigenous app is able to depict true picture of various Earth Observation models in near to real time duly supported by the databases published in public domain by NASA/JAXA/ESA/ESRI.
In this web app Disasters/Hazards can be visualized in form of Geo maps alongwith respective data information/analysis fetched by various API’s from GIS community. Some of the Earth indicators are also equipped with forecasted information as well, in order to ensure public safety.
This web app enables users to study & train themselves by referring any of the EO based on their likings and area of interest. Objective is to know the hazards/ severity first and then call for corrective action/measures.
How we built it: 1) API's has been put in use to fetch real time information from ARCGIS web servers.
2) GIS mapping feature has been used for Geodata based output on ARCGIS ONLINE platform supported by ESRI.
3)This project is developed on ARCGIS Experience Builder platform supported by ESRI.
4) Google Earth Engine is used to create Earth Observer Apps. Open Source codes are being put in use to derive customized results. Codes reference from https://github.com/samapriya/ee-appshot
5) Detailed data analysis done with the help of Tableau. Few of the vizzes are directly embedded to project from viz collection of Tableau Public.
6) Laptop HP Probook 440 G5 with processor INTEL(R) Core(TM) i7-8550U CPU @1.80GHz used.
7) NARAKEET, CLIDEO.COM & YOU TUBE is used for creation of project's demo video of 30 seconds.
Various Earth Observation datasets are explored and also active use of NASA softwares has been taken into consideration such as
1) NASA Worldwind
2) FIRMS
3) Worldview
4) Earthdata
5) Earth Observatory
Challenges we ran into: We as a team "Nurture the Nature" has selected the challenge "Capacity Building Resources Gateway" and thought of to create a "Multi Mission Earth Observation" web app named as “Indicators of the Planet Earth” by using various datasets merged into a single application with focus on 360 degree visualization on various aspects of Earth observations.
Accomplishments that we're proud of: We hope our small effort towards the creation of this app will draw the attention & may encourage students and science enthusiastics to focus more on our Planet Earth and contribute every possible effort with a view to safeguard the same in best possible manner.
Human footprint in many aspects is causing damage to our environment. Hence we thought of to promote the ideology of share and care. Present and historical climatic conditions are shared in form of web app so that people may explore and pledge to reduce the factors those who all are hazardous to Earth.
Since it’s a collective responsibility hence let’s join our hands together to preserve what we have been gifted by nature as there is no planet B.
What we learned: Project was started with ideology to make a dashboard of climate indicators, for which a detailed study and data surfing/scraping is done on various external websites & NASA DAAC (Distributed Active Archive Centers).
Relevant data is fetched in form of feature layers by using API's and apparently synced with ARCGIS ONLINE geo maps. Further the same data is linked with climate Indicators which keeps on updating by itself with ARCGIS web servers.
Once the mapping is done, thought of to infuse some data analytics to respective indicators tabs for which i had to use Tableau. Infographics are best way of presentation that's why it has been put in use to make it more interesting for the users. Motto is learning with facts and fun.
There is a huge range of filters curated on respective Tableau apps which provides the feasibility to drill down the data to it's unit level based on the user inputs.


Log in or sign up for Devpost to join the conversation.