Inspiration
The stock market is unpredictable and intimidating for beginners. I wanted to create a tool that uses AI to simplify market analysis, reduce guesswork, and empower individuals to make smarter investment decisions — even if they have no finance background.
What it does
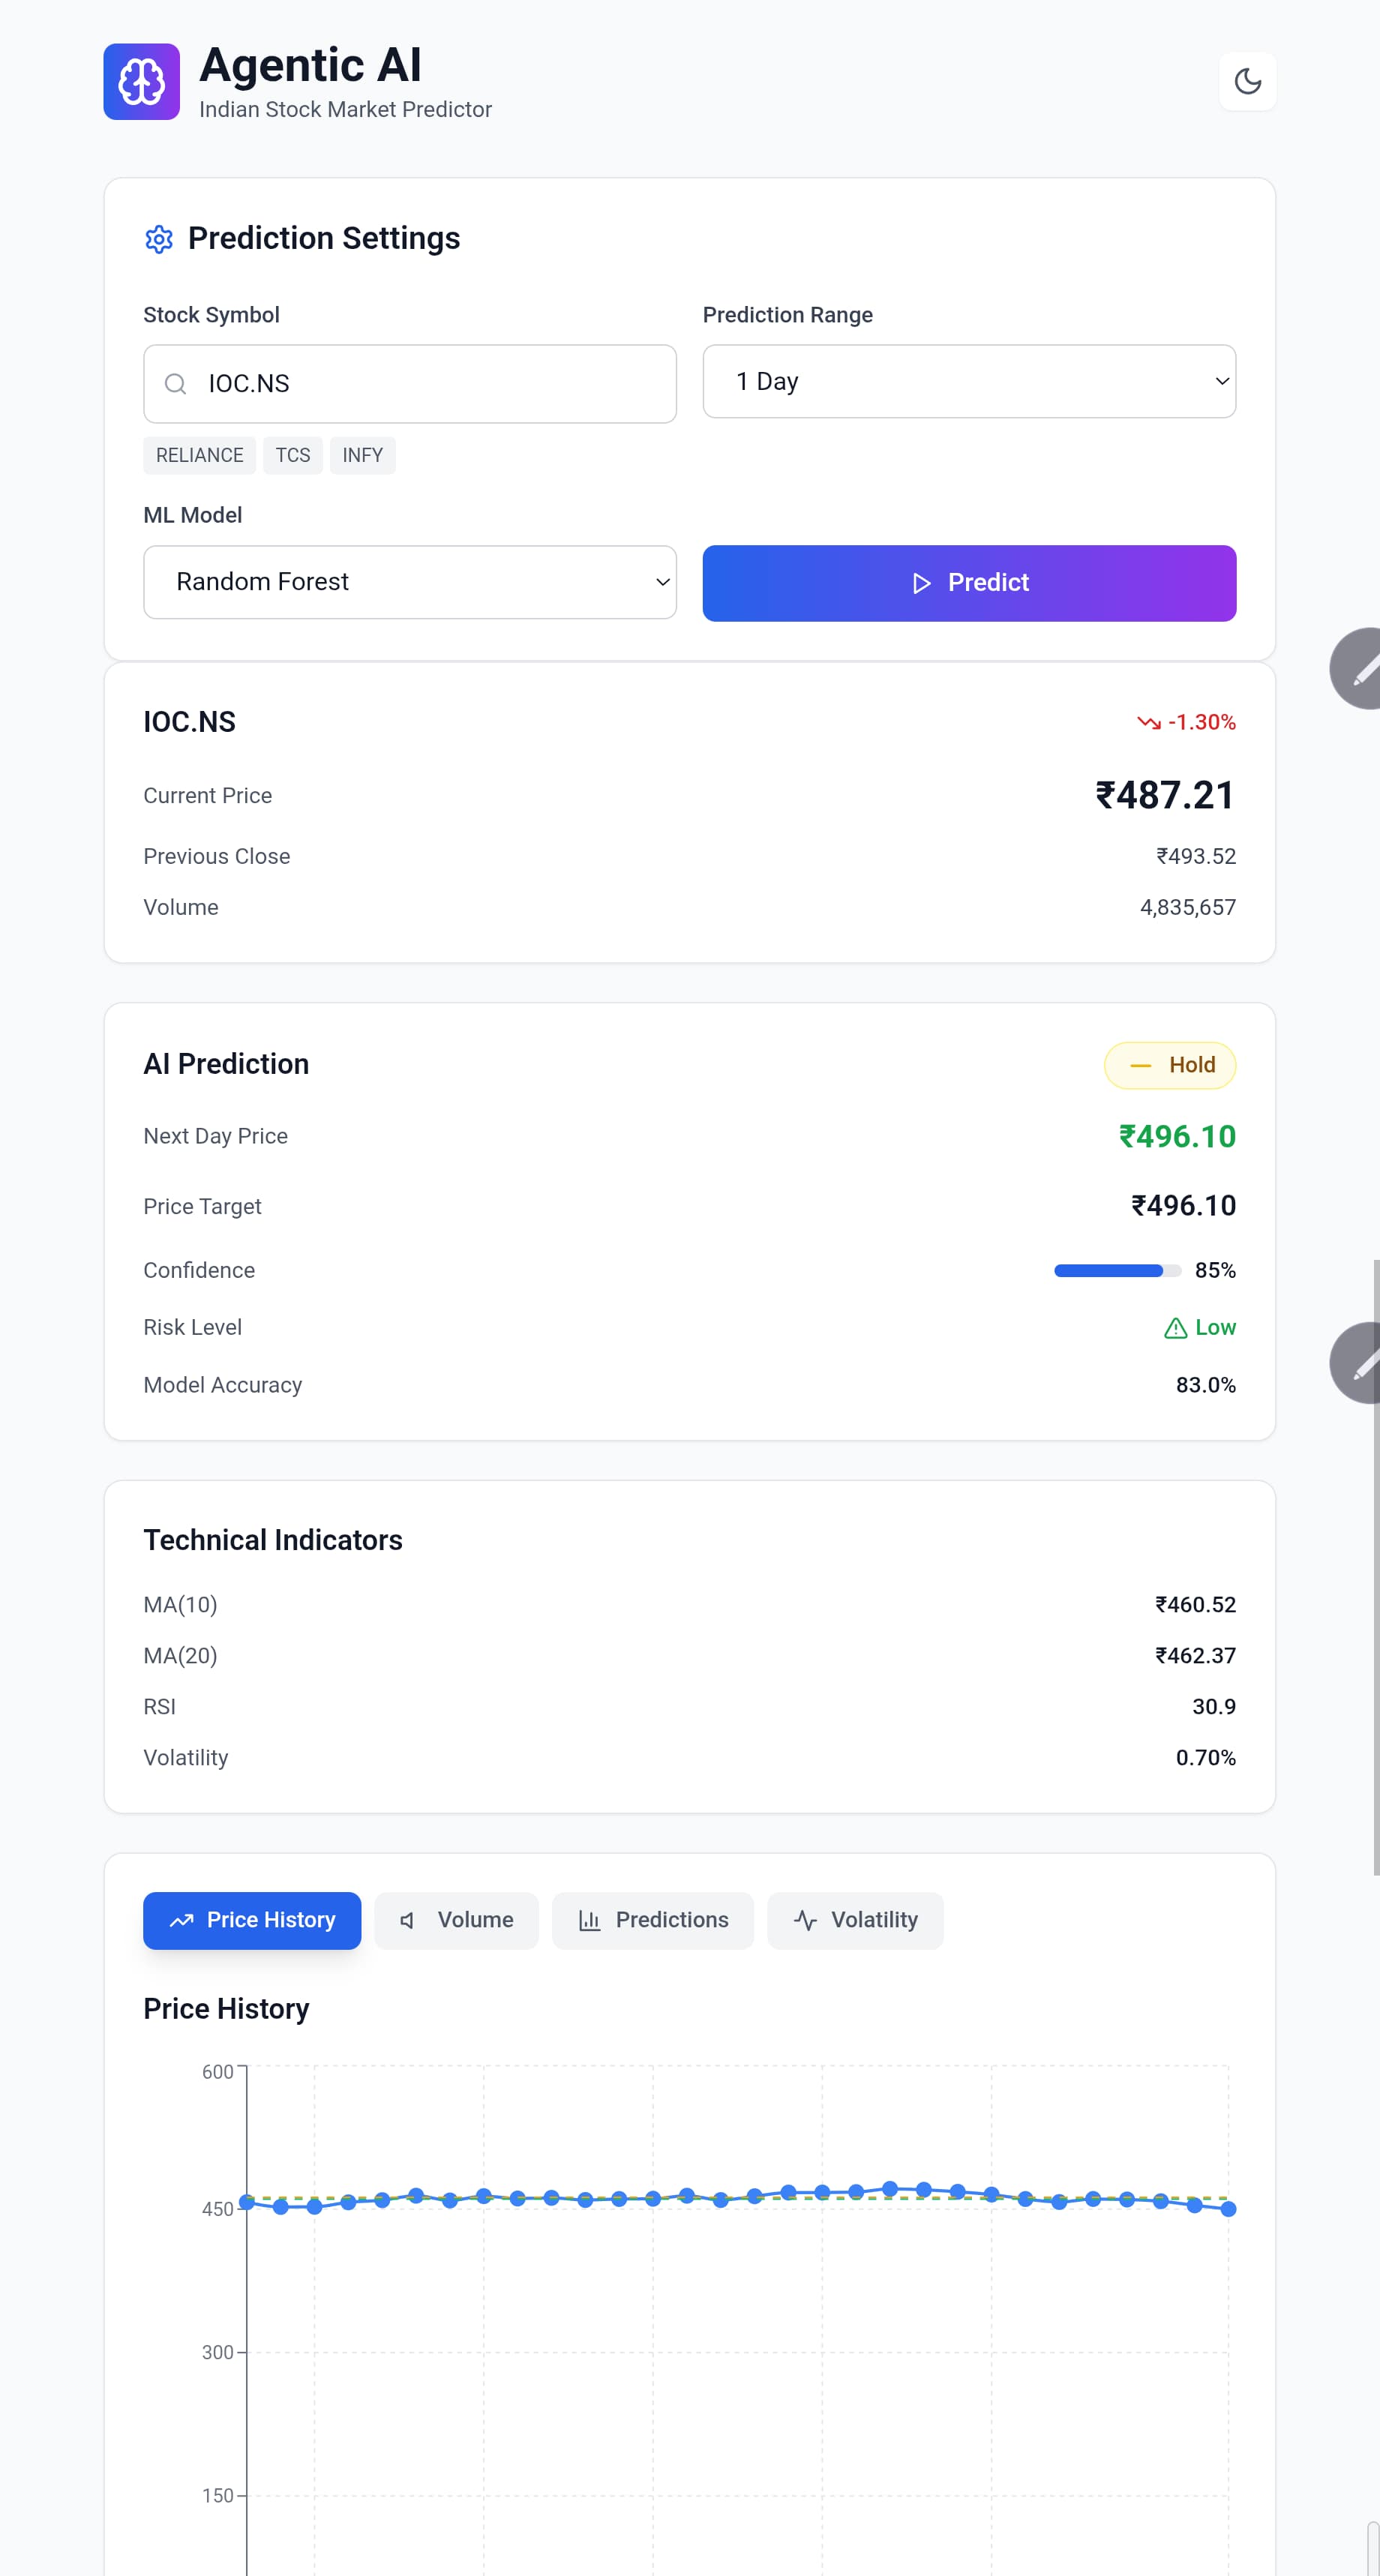
This project uses machine learning to predict stock price movements based on historical trends and real-time data. It analyzes patterns, generates buy/sell insights, and visualizes them on a clean dashboard — helping users make more informed trading decisions.
How we built it
Frontend Architecture: • Built with React 18 and TypeScript for type safety and modern development • Implemented modular component architecture with clear separation of concerns • Used Tailwind CSS for responsive, utility-first styling approach • Integrated Recharts for interactive data visualizations and chart components
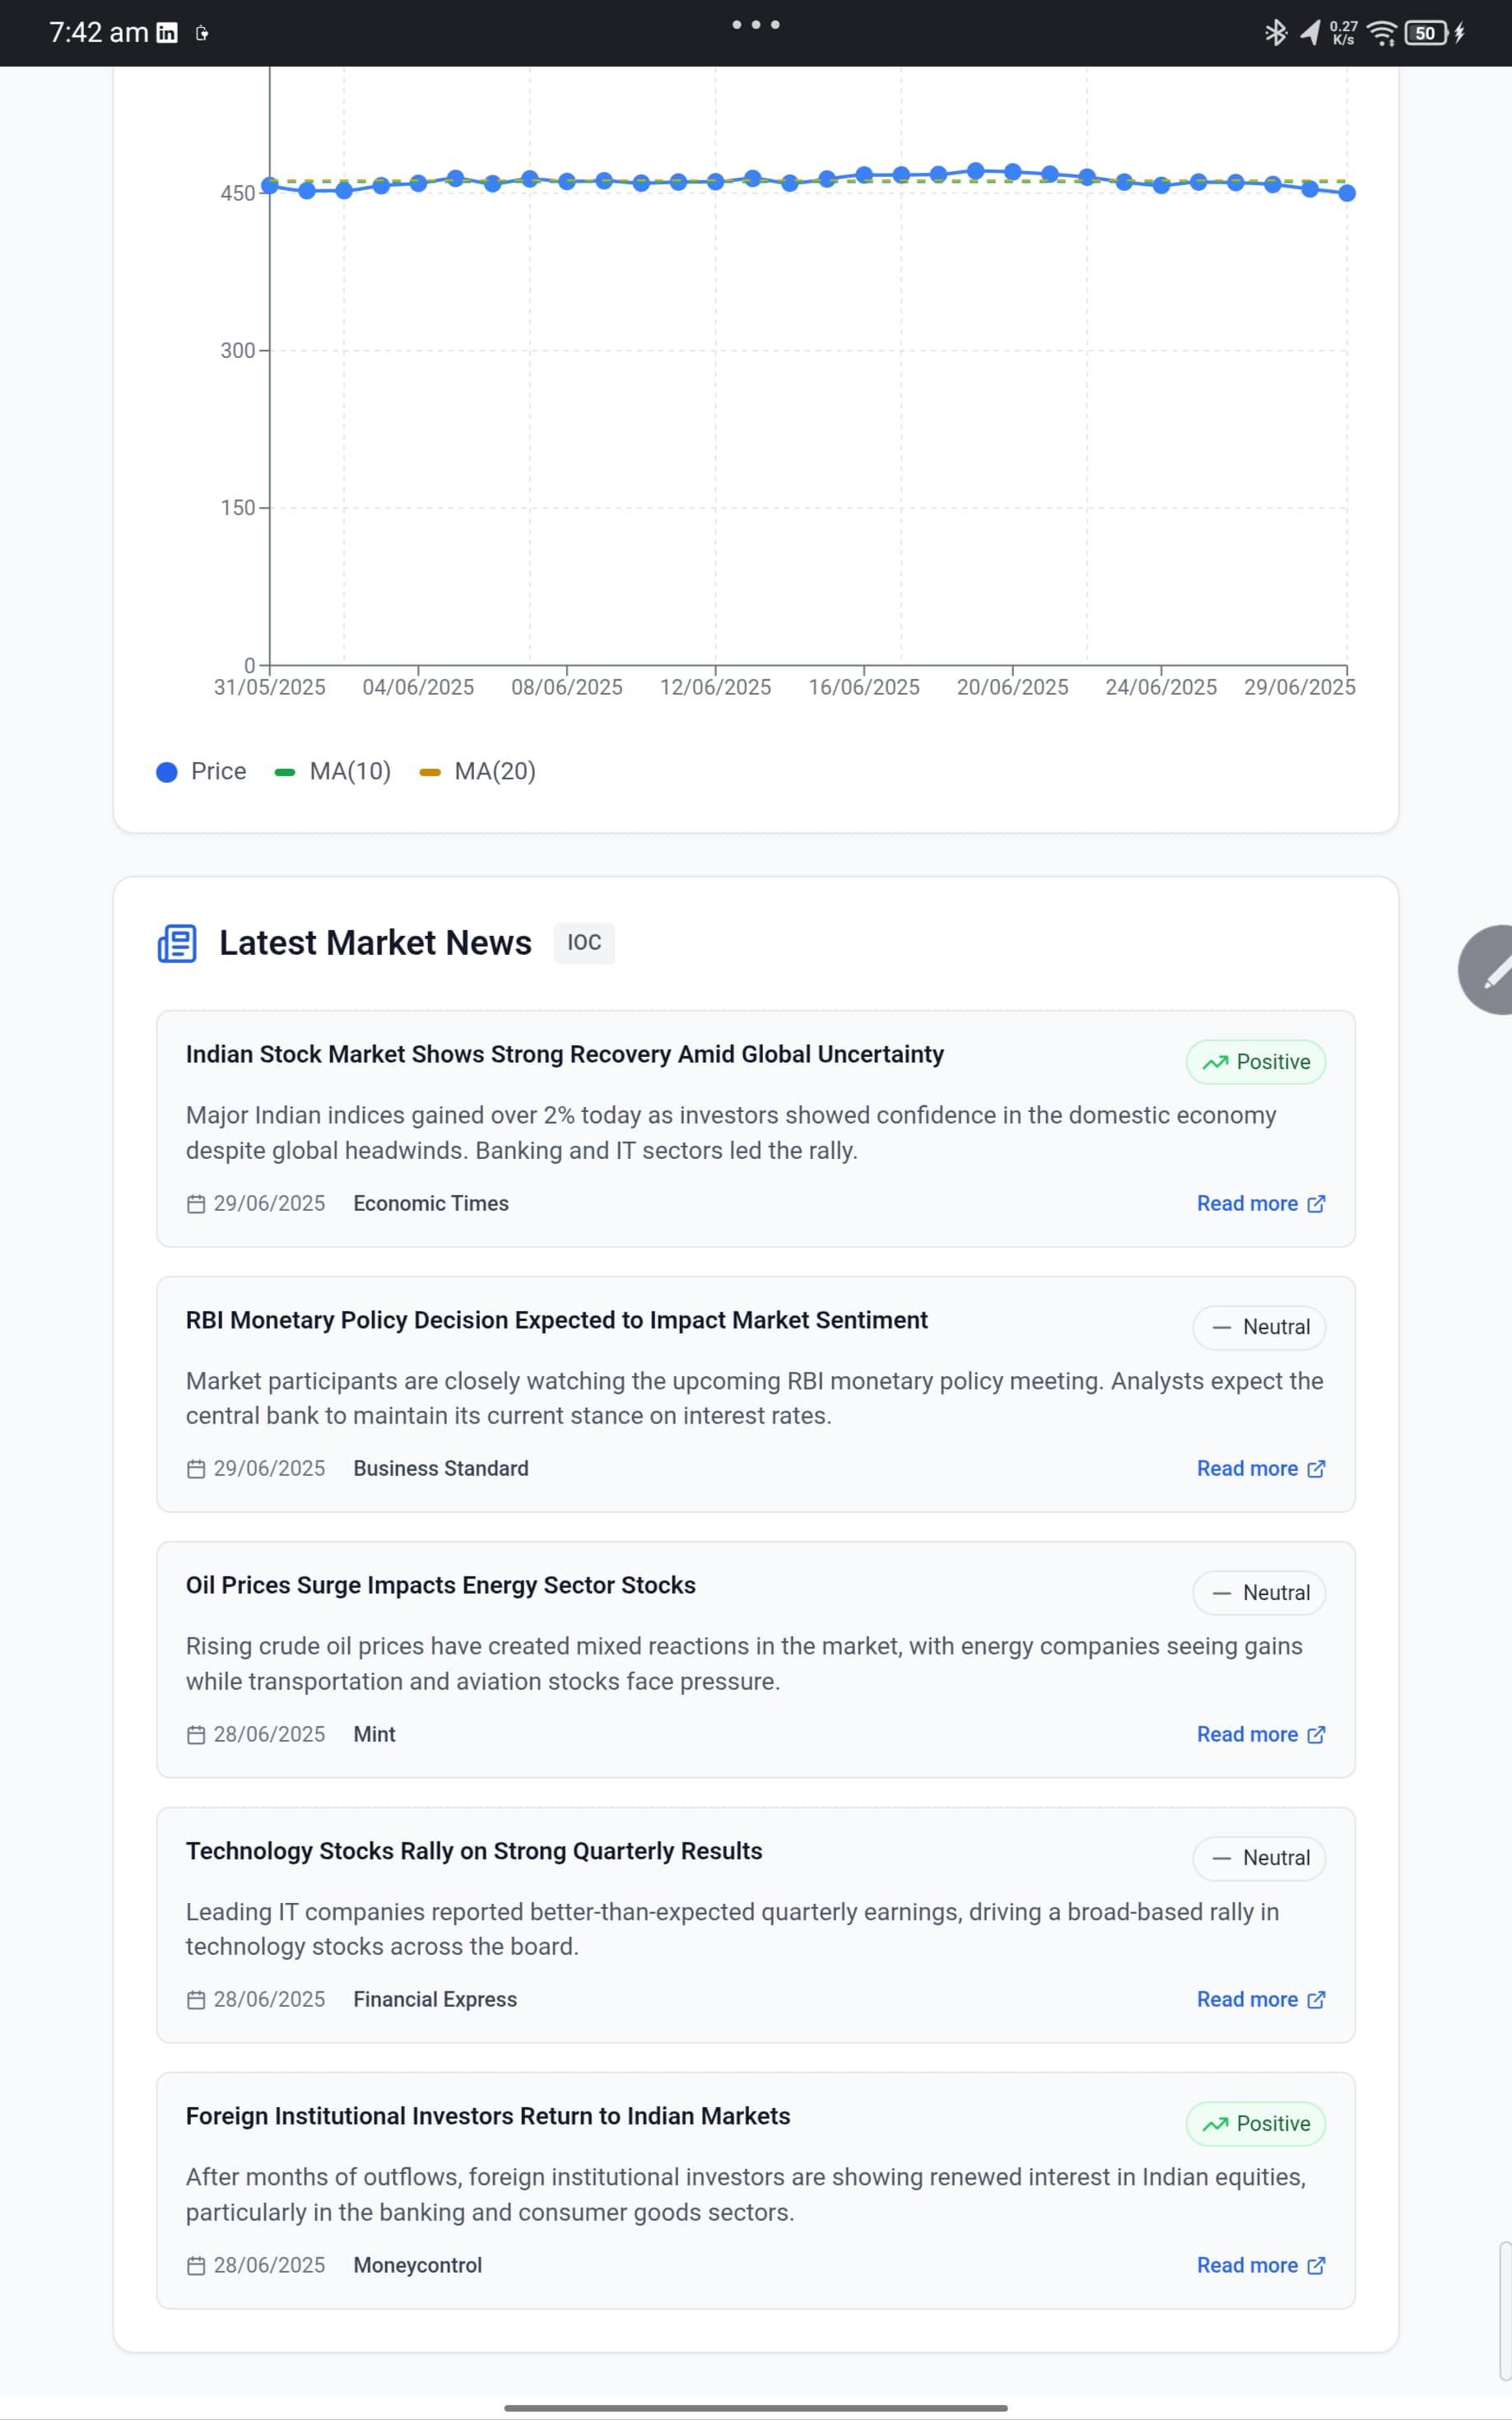
Data Management: • Created mock financial APIs simulating real-world stock data fetching • Implemented technical indicator calculations (Moving Averages, RSI, Volatility) • Built ML prediction simulation using Random Forest and Linear Regression models • Developed news sentiment analysis system with categorized market updates
User Experience: • Designed dark/light mode toggle for enhanced accessibility • Created responsive layouts optimized for mobile, tablet, and desktop • Implemented real-time prediction updates with loading states • Added interactive charts with hover effects and detailed tooltips
Development Workflow: • Used Vite for fast development server and optimized builds • Configured ESLint with TypeScript rules for code quality • Organized codebase with clear file structure and naming conventions • Implemented proper error handling and user feedback systems
Challenges we ran into
Data Simulation Complexity: • Creating realistic stock price movements and technical indicators without real APIs • Balancing randomness with realistic market behavior patterns • Ensuring historical data consistency across different timeframes
Chart Integration: • Managing multiple chart types (line, bar, area) with consistent theming • Implementing smooth transitions between different data visualizations • Handling responsive chart rendering across various screen sizes
State Management: • Coordinating complex state between prediction settings and results • Managing loading states across multiple async operations • Ensuring data consistency when switching between different stocks
Performance Optimization: • Optimizing chart re-renders when data updates frequently • Managing memory usage with large historical datasets • Implementing efficient component updates without unnecessary re-renders
Accomplishments that we're proud of
Professional UI/UX Design: • Created a production-ready interface with Apple-level design aesthetics • Implemented smooth animations and micro-interactions throughout • Achieved excellent visual hierarchy with consistent spacing and typography
Comprehensive Feature Set: • Built multiple prediction models with confidence scoring • Integrated technical analysis with visual indicators • Created news sentiment analysis with real-time updates • Added CSV export functionality for data analysis
Technical Excellence: • Maintained 100% TypeScript coverage for type safety • Achieved modular architecture with reusable components • Implemented responsive design working across all devices • Created efficient data processing algorithms
User-Centric Features: • Dark/light mode toggle for accessibility • Interactive charts with detailed tooltips • Risk assessment with color-coded indicators • Intuitive prediction settings with popular stock shortcuts
What we learned
Financial Market Complexity: • Understanding technical indicators and their practical applications • Learning about market sentiment analysis and news impact • Grasping the complexity of stock price prediction algorithms
Advanced React Patterns: • Mastering complex state management with multiple interdependent components • Implementing efficient data flow patterns for real-time updates • Creating reusable component libraries with consistent APIs
Data Visualization Best Practices: • Designing charts that effectively communicate financial data • Balancing information density with visual clarity • Creating interactive elements that enhance user understanding
Performance Optimization: • Optimizing React applications for smooth user experience • Managing large datasets efficiently in browser environments • Implementing proper loading states and error boundaries
What's next for Indian Stock Predictor
Real API Integration: • Connect to live financial data providers (Yahoo Finance, Alpha Vantage) • Implement real-time stock price updates with WebSocket connections • Add support for international markets beyond Indian stocks
Advanced ML Features: • Integrate actual machine learning models using TensorFlow.js • Add LSTM neural networks for time series prediction • Implement ensemble methods combining multiple prediction models
Enhanced Analytics: • Add portfolio tracking and performance analysis • Implement advanced technical indicators (MACD, Bollinger Bands) • Create custom watchlists with alert notifications
Social Features: • Add user authentication and personalized dashboards • Implement prediction sharing and community insights • Create leaderboards for prediction accuracy
Mobile Application: • Develop React Native mobile app for iOS and Android • Add push notifications for price alerts and predictions • Implement offline mode for viewing saved predictions
Enterprise Features: • Add multi-user support with role-based access • Implement API endpoints for third-party integrations • Create white-label solutions for financial institutions
Advanced Visualizations: • Add candlestick charts with technical overlays • Implement heat maps for sector performance analysis • Create interactive correlation matrices for stock relationships
Built With
- github
- keras-(lstm)
- matplotlib
- numpy
- pandas
- python
- scikit-learn
- seaborn
- streamlit
- xgboost
- yfinance-api


Log in or sign up for Devpost to join the conversation.