Inspiration
Got a paid internship
What it does
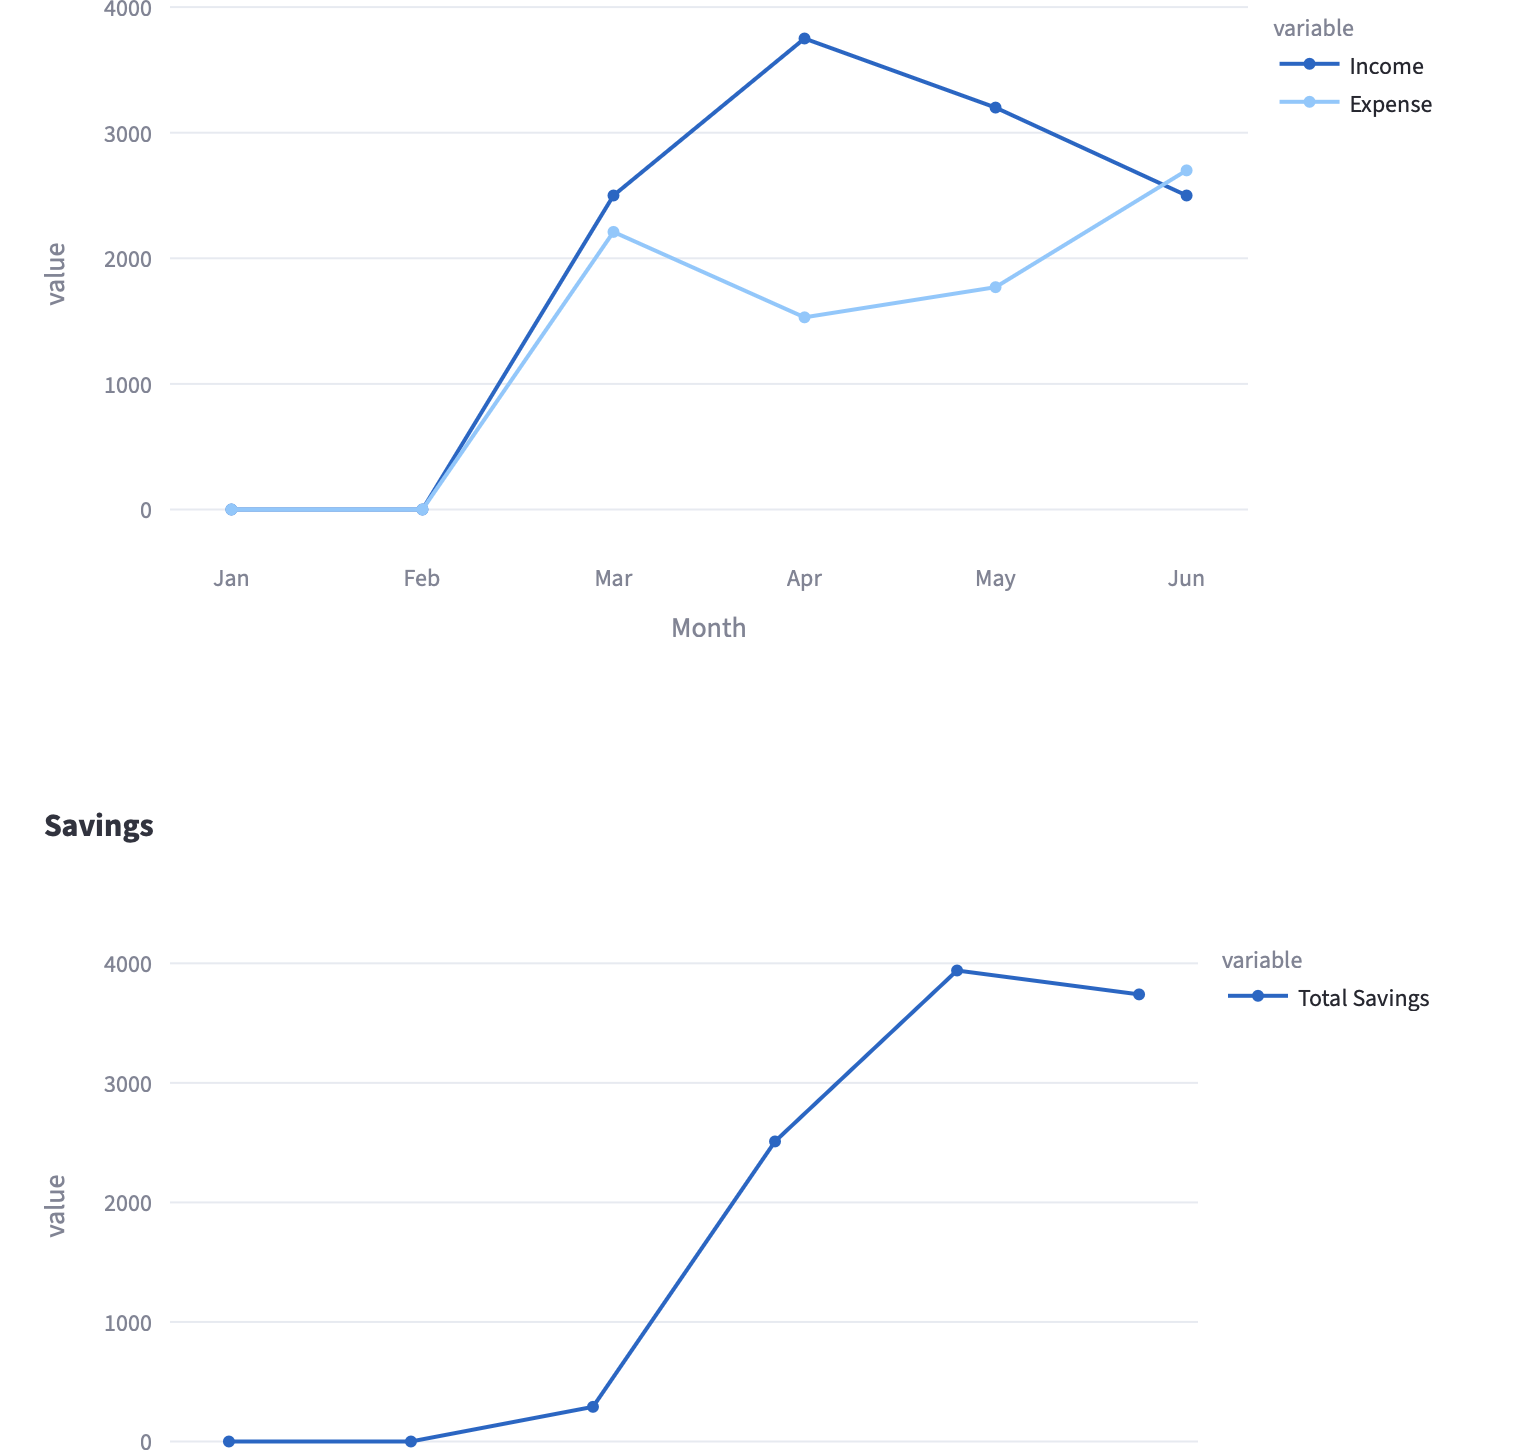
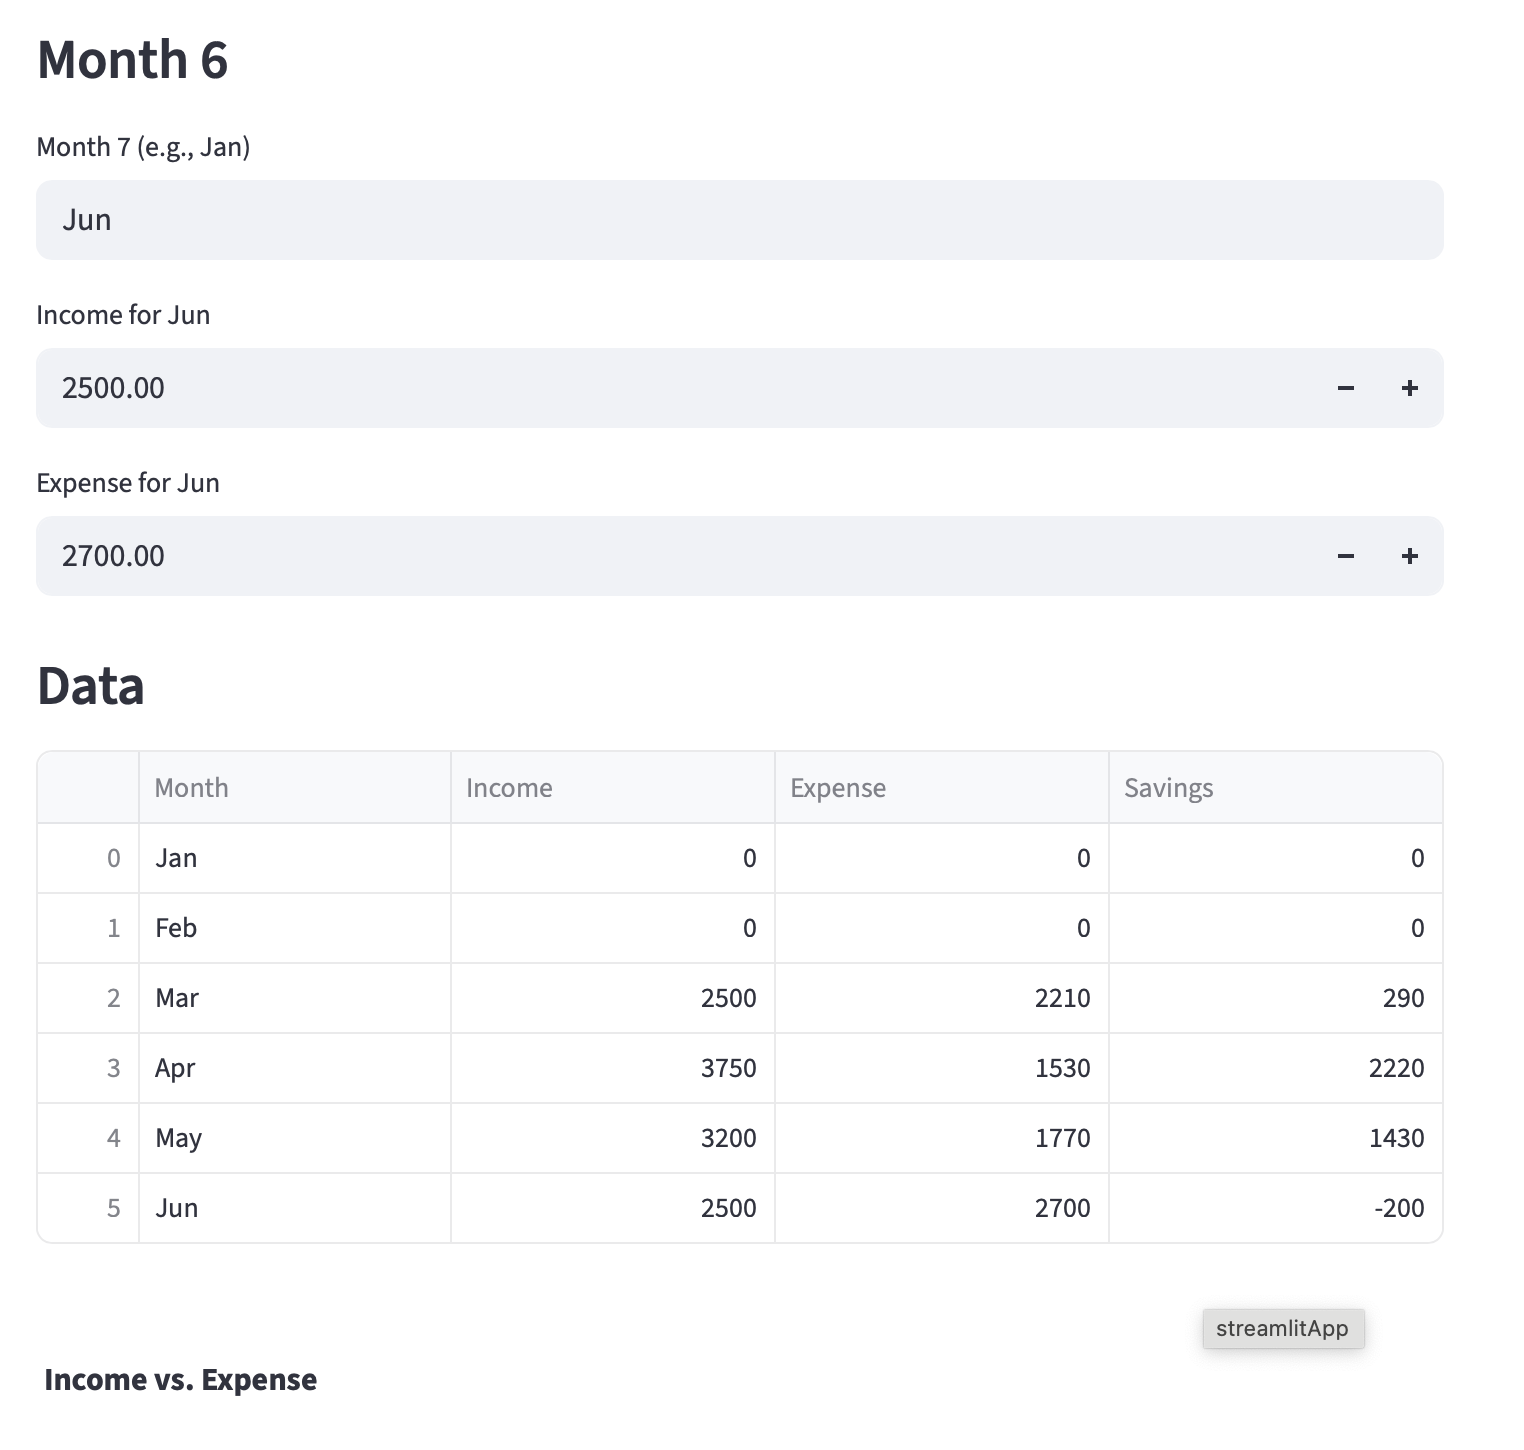
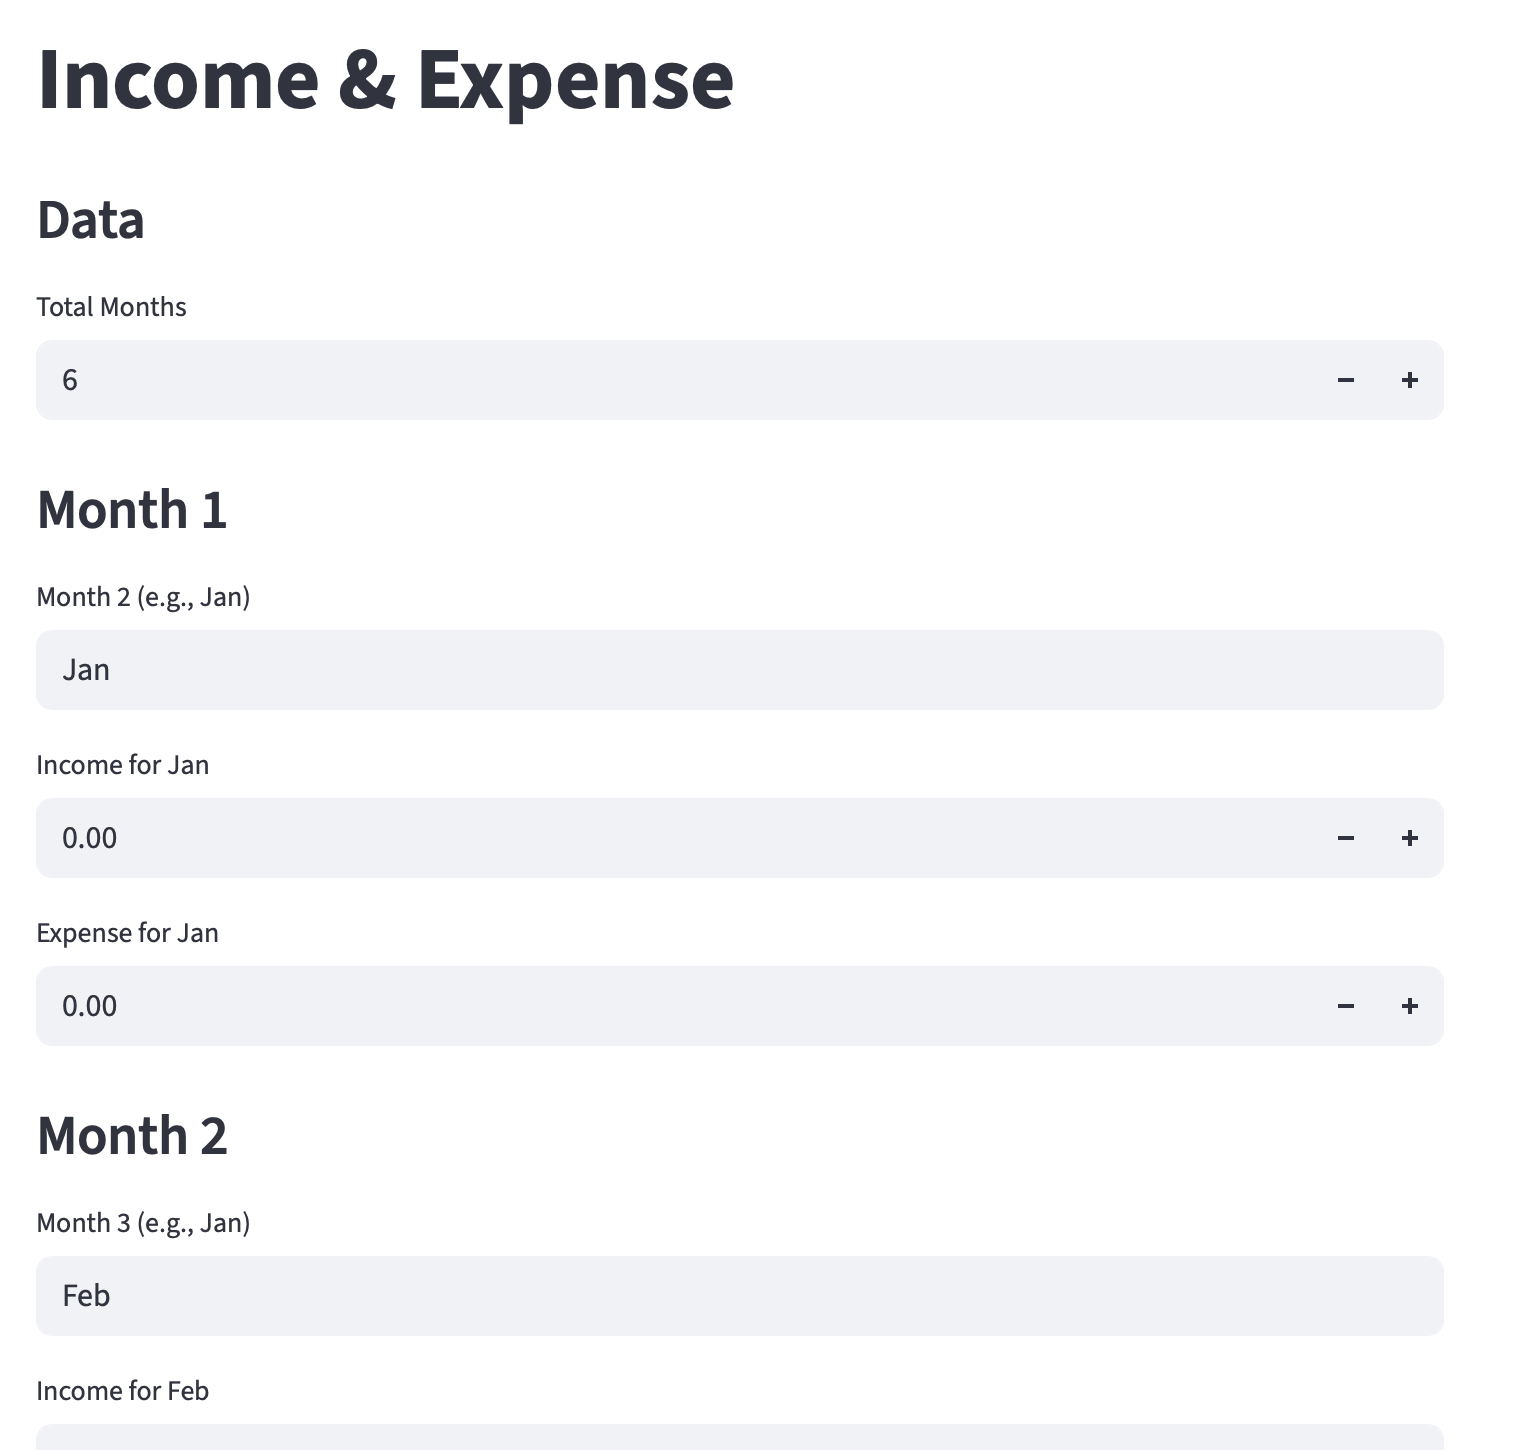
Generate graphs about your income and expenses.
How we built it
Design how it should function and look like, program, and test it.
Challenges we ran into
At first it generates graph of savings on each month, but after adjusting it, now it can generate the graph for total savings.
Accomplishments that we're proud of
It works just like my goal.
What we learned
How to use streamlit, and be more more familiar with python programming.
What's next for Income & Expense Tracker
Saving data so you can add on each month, instead of inputing everything again and again.

Log in or sign up for Devpost to join the conversation.