-
-
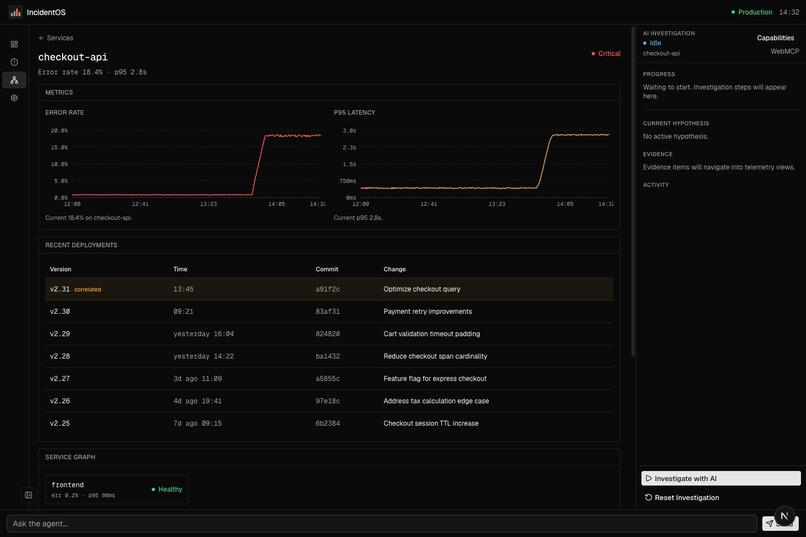
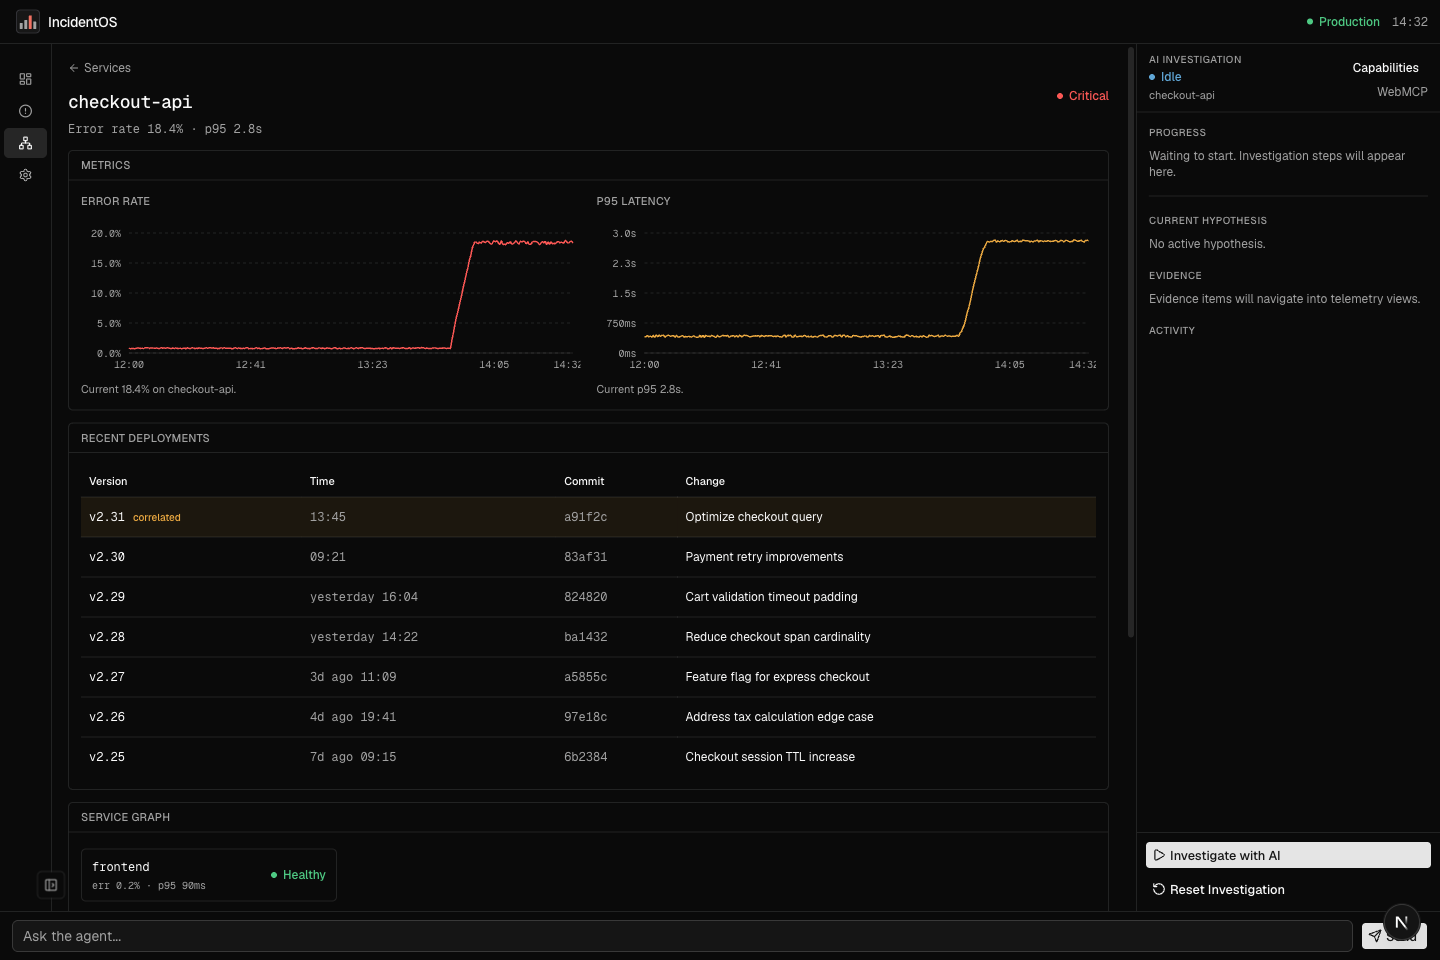
Service Page
-
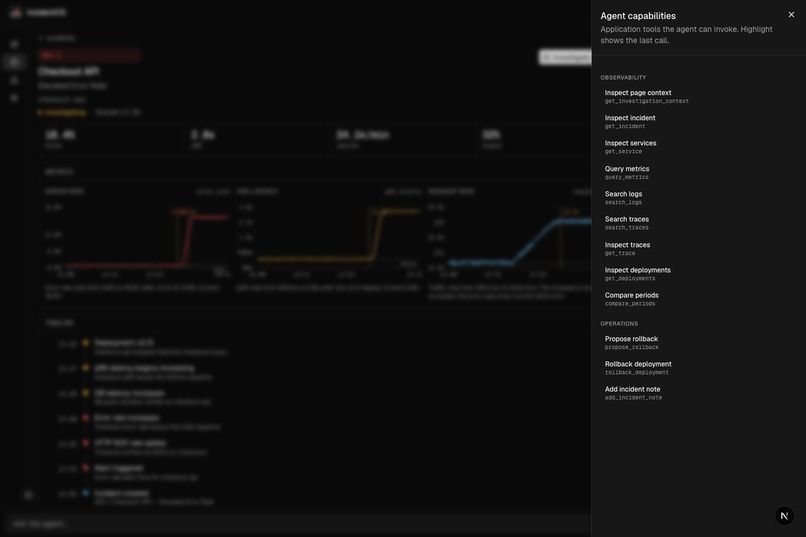
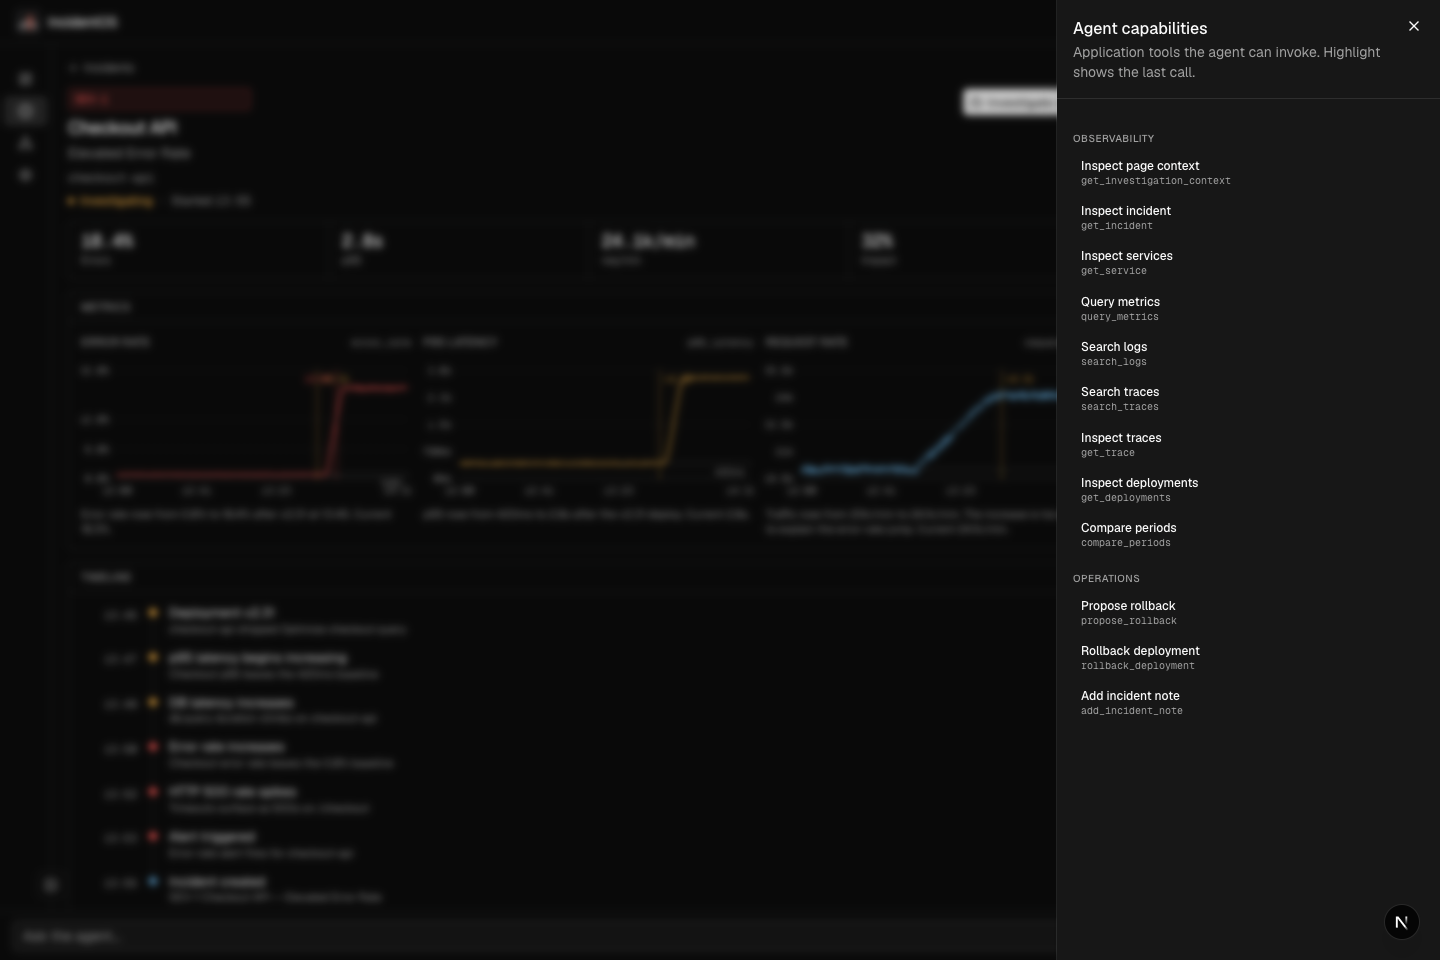
WebMCP Capabilites
-
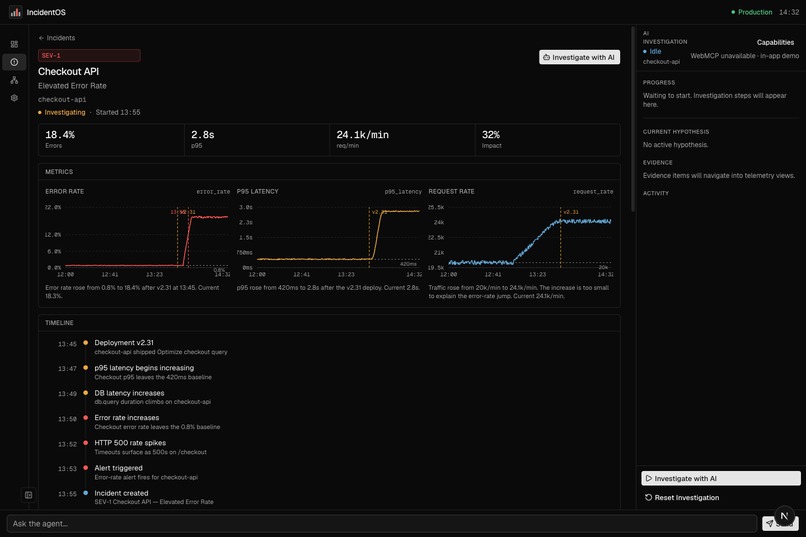
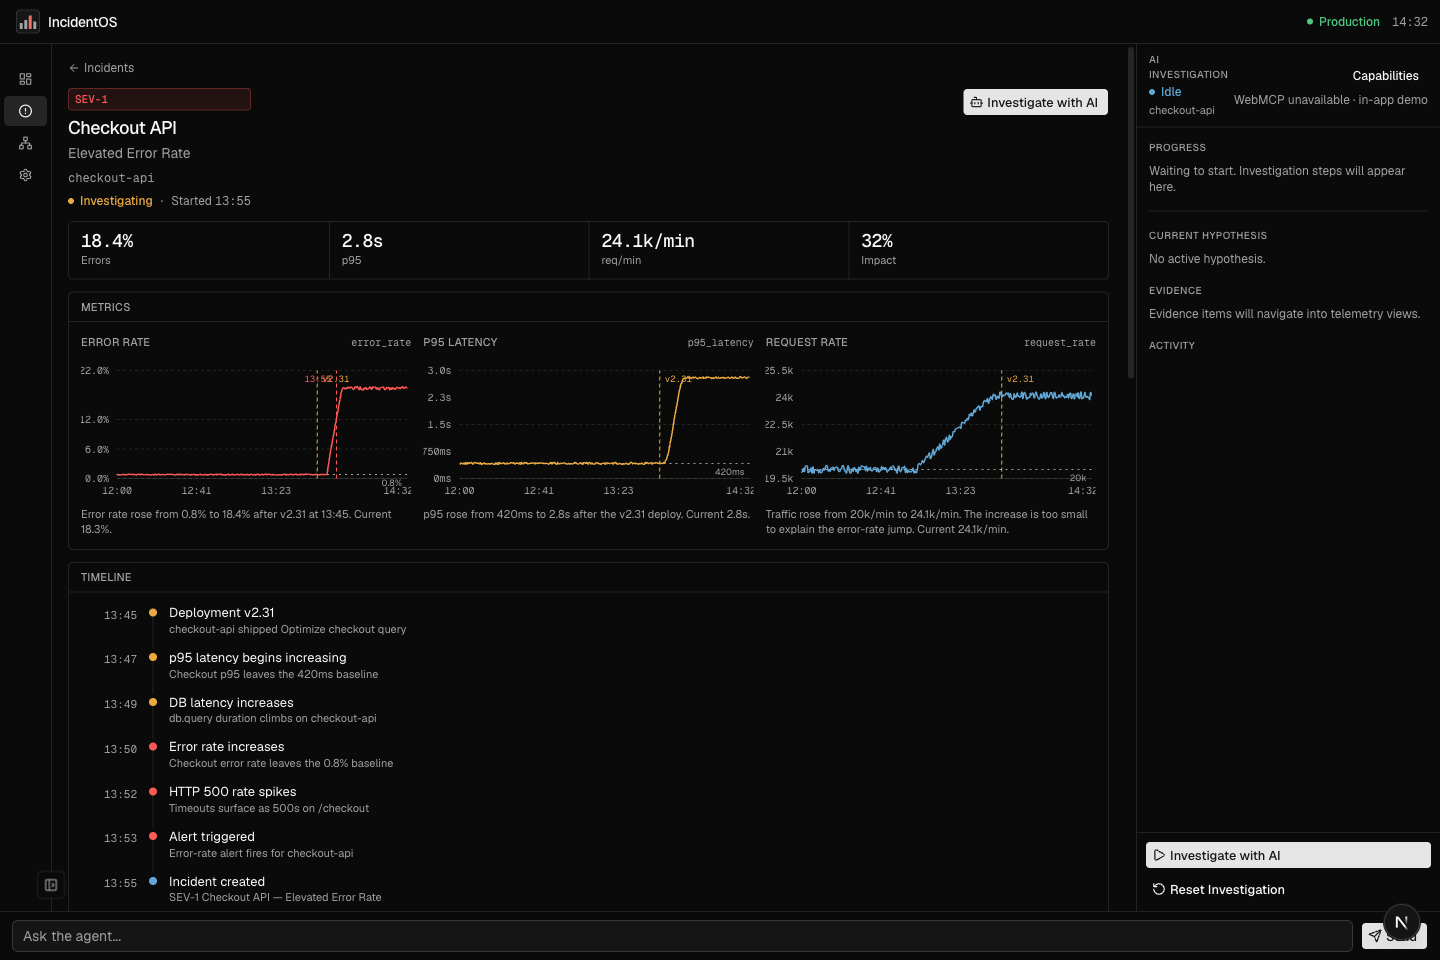
Incident Home page
-
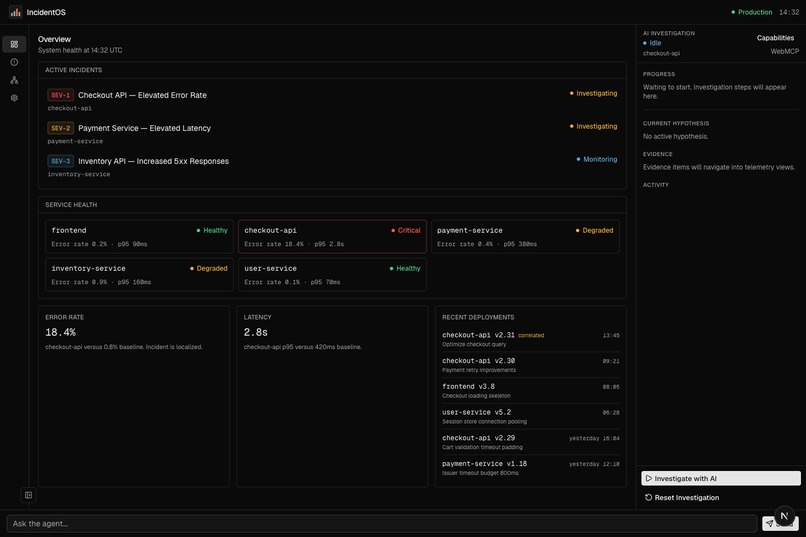
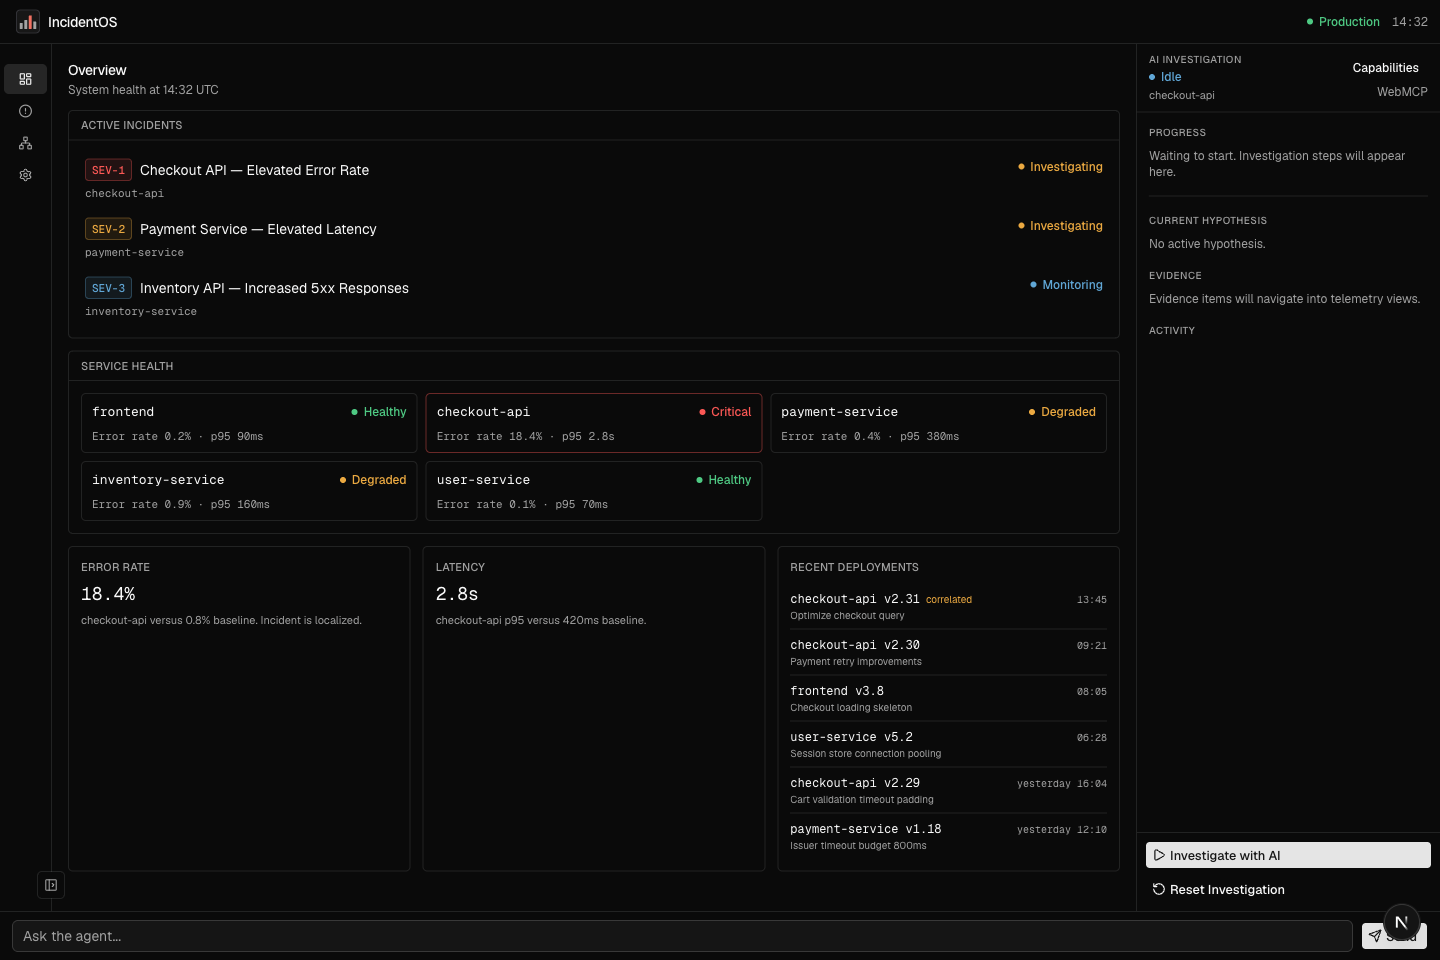
Overview
-
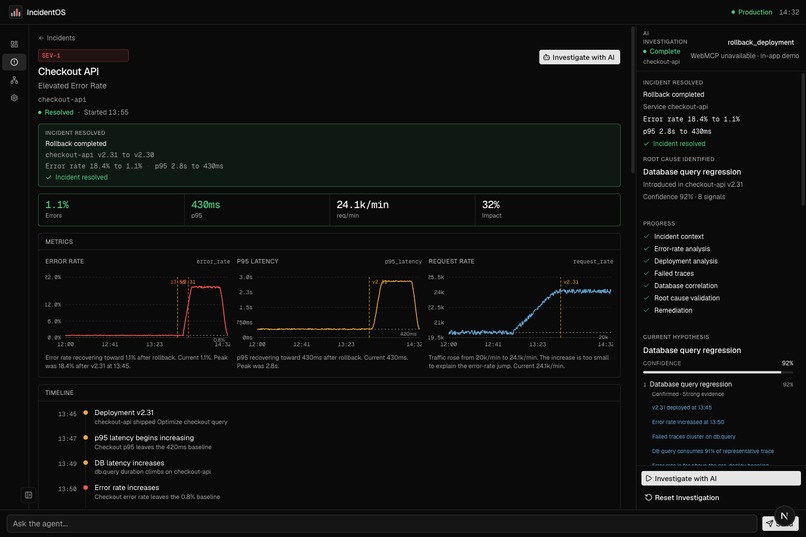
Resolved
-
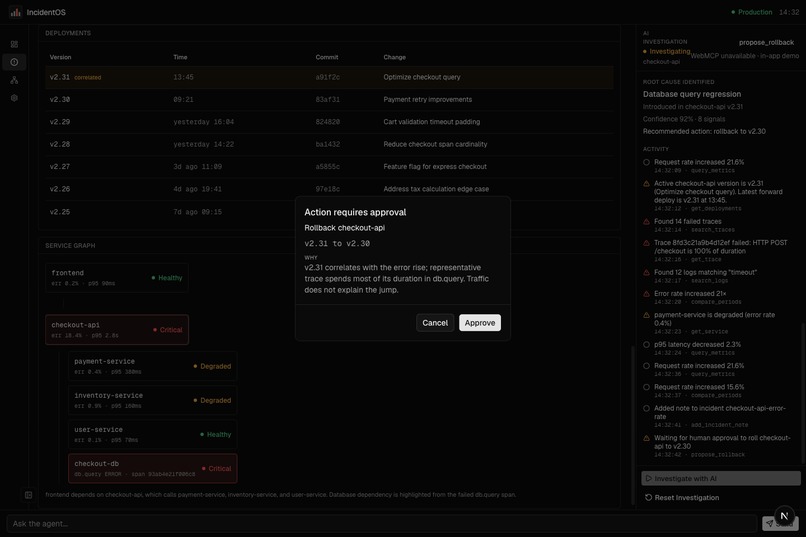
Approval
-
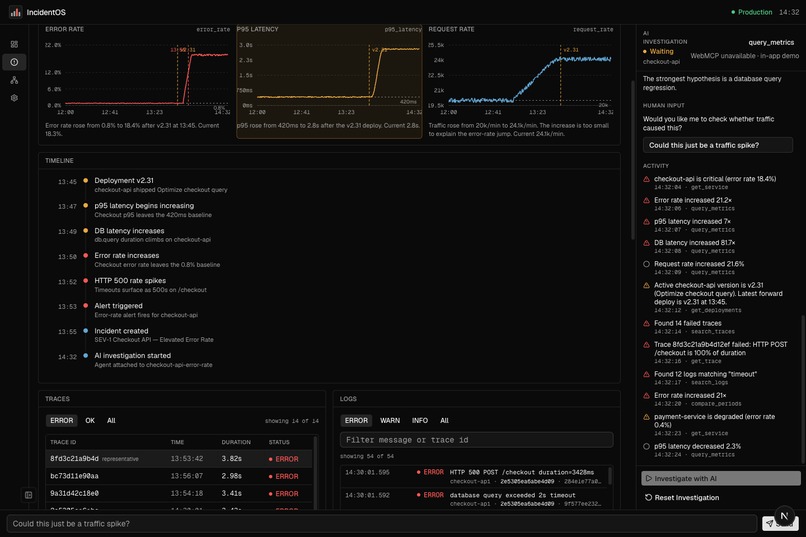
Investigation Running
-
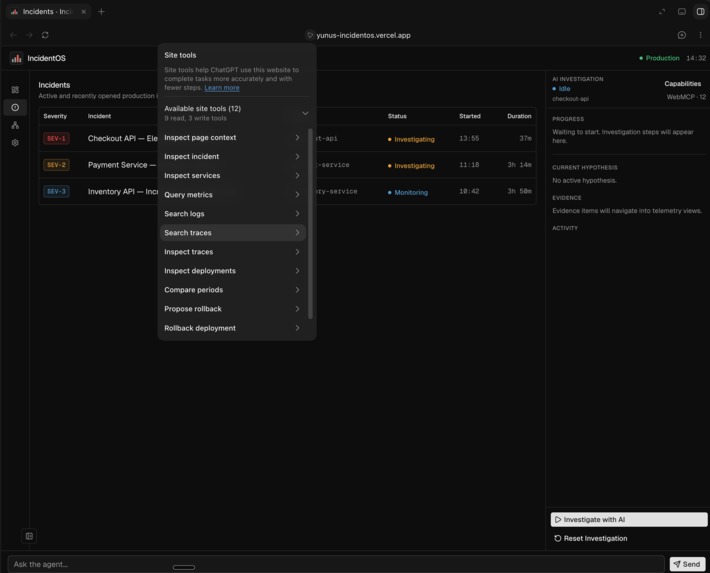
WebMCP Site tools
About the project
Inspiration
Most observability platforms shipped an AI assistant this year, and they all shipped the same one: a chat bot that can interact with the data and reply to the user queries. You read a chart, you paste the chart numbers into the chat box, you get a huge paragraph back. In most cases, the agent cannot open the trace you are looking at. It cannot filter your logs. It cannot see the deployment you just noticed. It is a very well-read colleague who is not allowed to touch the tools.
We fixed this for the servers using MCP. WebMCP can help fix it for the client. With WebMCP, the application can register its own tools, and the agent uses them against the same session, the same state, and the same permissions you already have. No separate server, no OAuth dance, no second copy of your data.
What it does
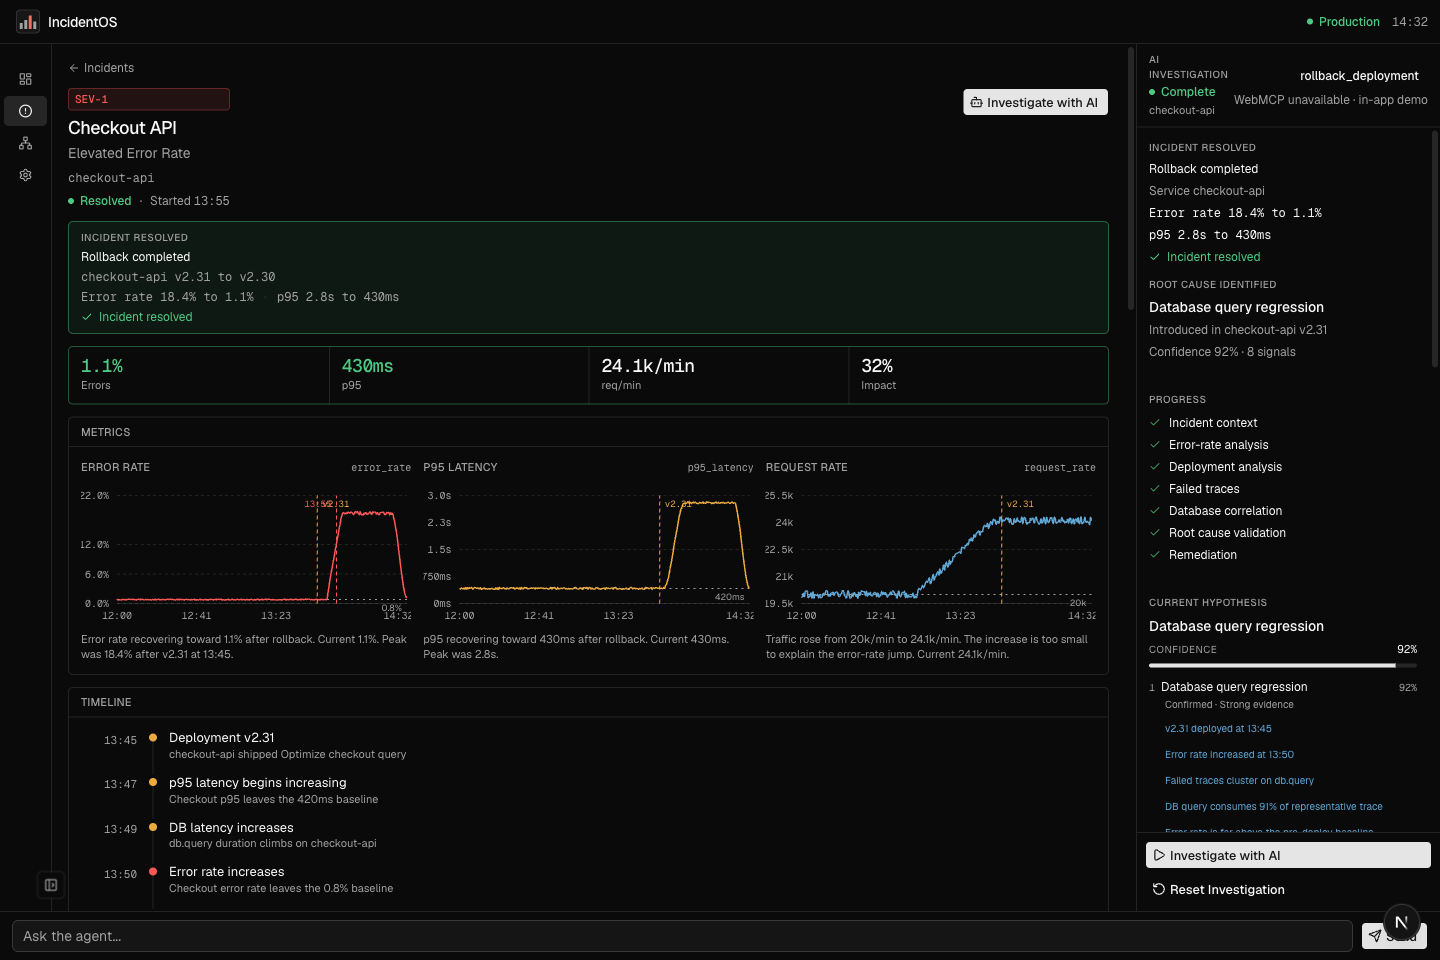
IncidentOS is an incident workspace where you and an AI agent work the same SEV-1 together.
Checkout is failing. Error rate is 18.4%, p95 latency is 2.8s, and checkout-api v2.31 shipped forty-seven minutes ago with the commit message "Optimize checkout query."
Open the incident in ChatGPT with site tools enabled and ask it to investigate. It calls tools the page registered: it reads the current investigation context, pulls error rate and latency and database latency, loads the deployment history, searches traces, opens a failed one, searches logs for timeouts, and compares the incident window against the previous day. The workspace moves with every call — tabs switch, charts highlight, the trace opens. You are not reading a summary of the investigation, you are watching it.
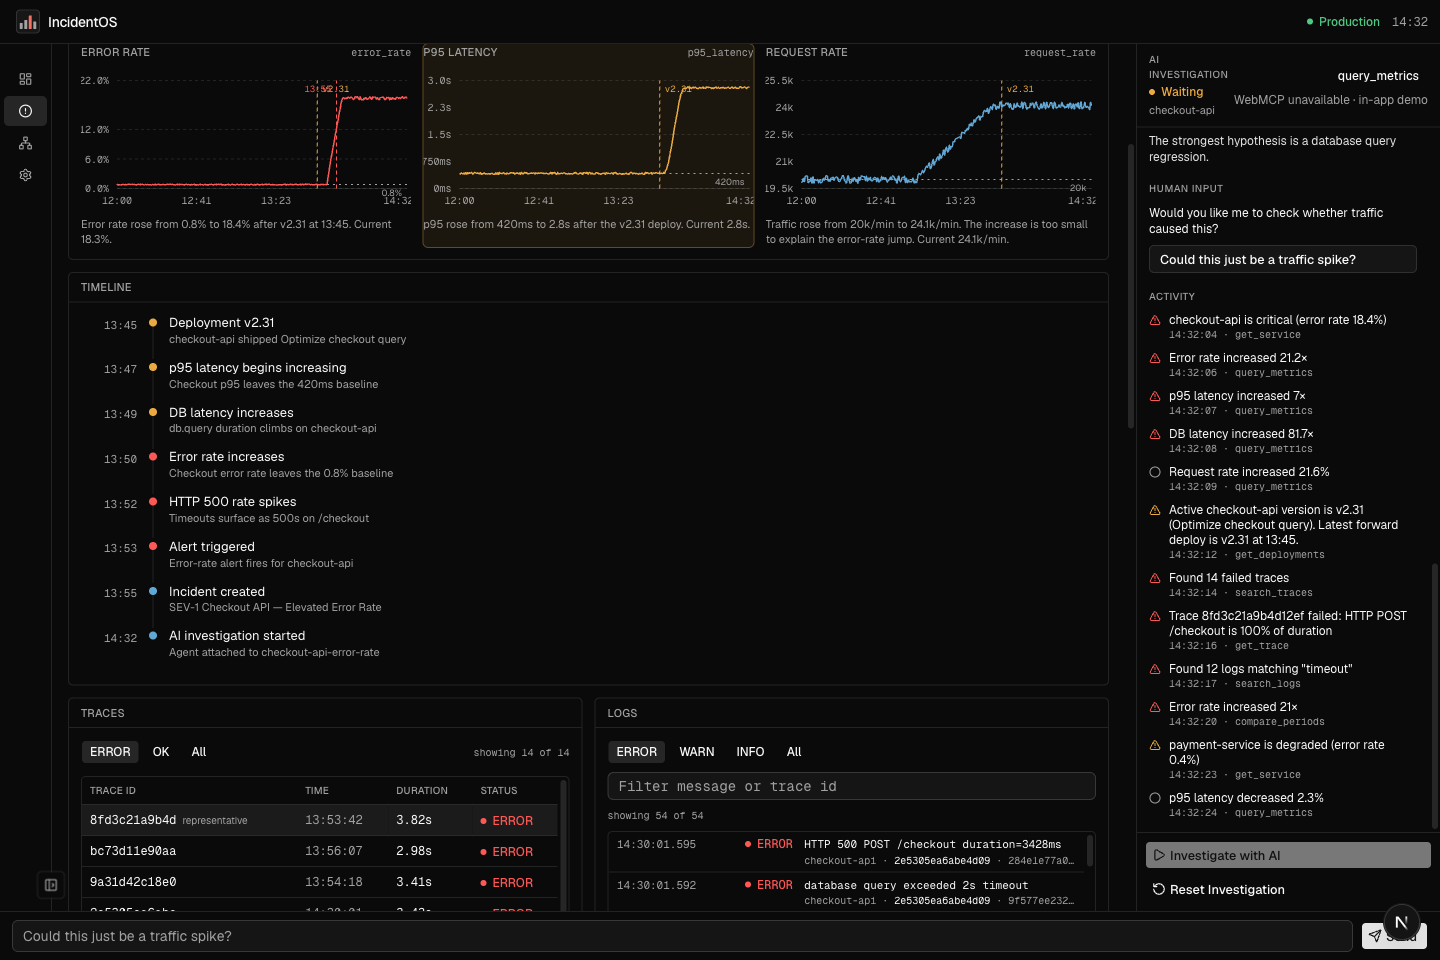
Then we challenge it. Ask "could this just be a traffic spike?" and it re-queries request rate instead of defending itself:
$$\frac{18.4\%}{0.8\%} \approx 23\times \text{ errors} \qquad \text{vs} \qquad \frac{24.1\text{k}}{20\text{k}} \approx 1.2\times \text{ traffic}$$
Traffic barely moved. It rejects the hypothesis with numbers and points at a db.query span sitting at 91% of a 3.82s failed trace.
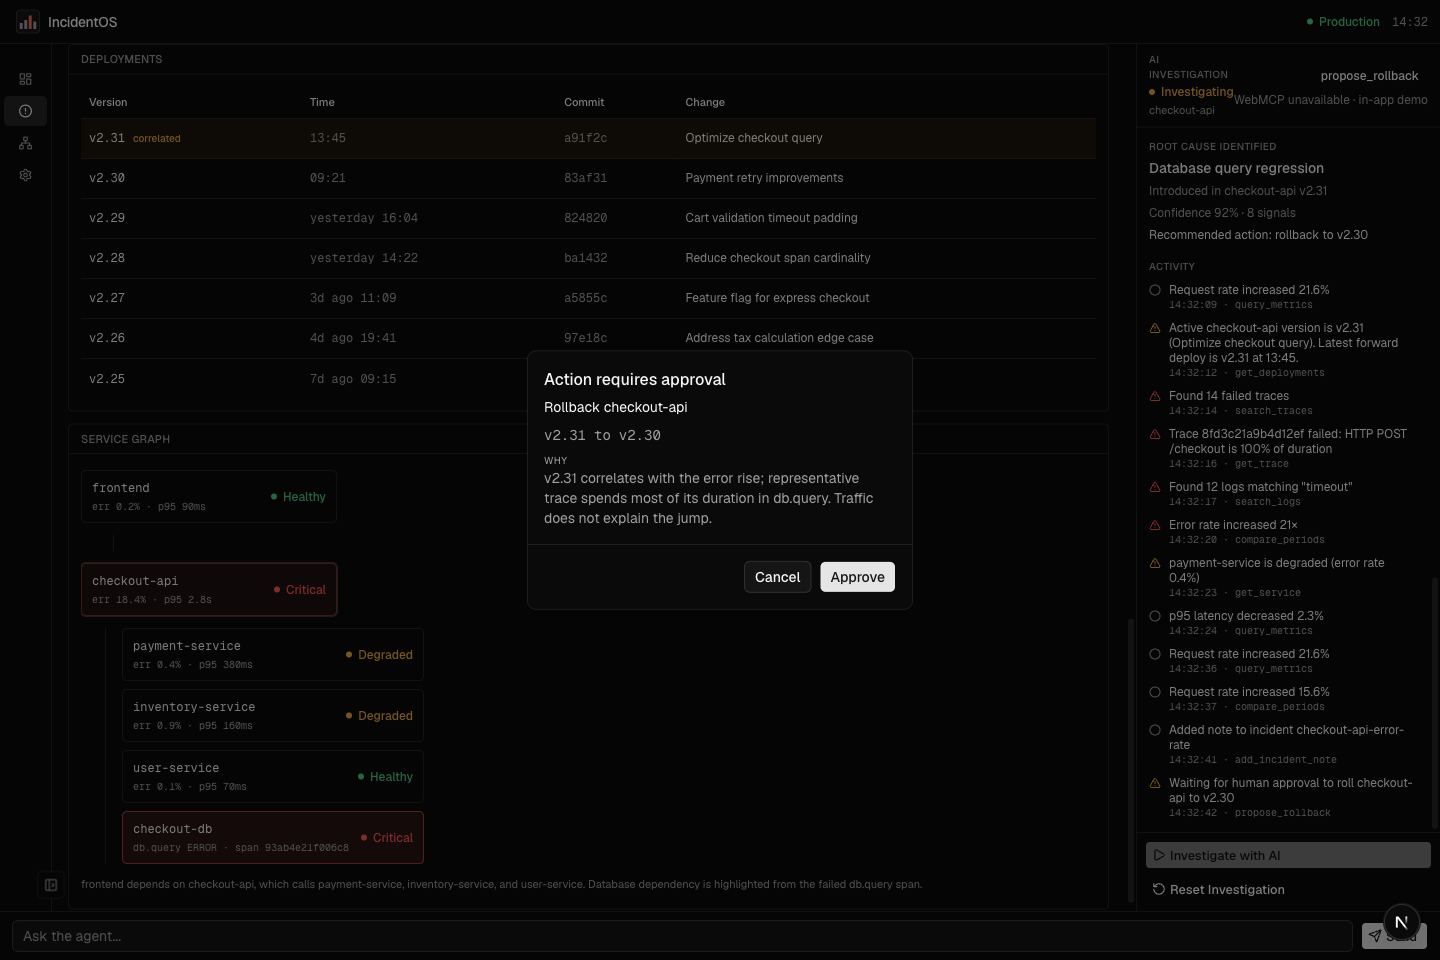
When it proposes rolling back v2.31, a dialog opens in IncidentOS and the agent stops. Nothing happens to production until you click Approve.
Why this use case is a strong fit for WebMCP
You are already in the product, looking at the incident. A sidecar chat cannot see that. A separate MCP server would mean another copy of the data and another login. WebMCP lets the agent use the page you already have open.
We picked incident response on purpose, because it is the hardest possible case and one of the most common use cases for an observability product. An investigation is many steps deep, every conclusion has to be backed by evidence a human can inspect, and the whole thing ends in an irreversible production action.
How it creates a better user experience
The better experience is simple. You do not paste charts into chat. You stay on the incident. The workspace moves with every tool call — tabs switch, charts highlight, the trace opens. You are not reading a summary of the investigation, you are watching it. When production is at risk, the agent stops and you click Approve.
Before this, you and the agent could not actually work the same investigation. You looked at the product. It looked at whatever you pasted. It could not open your trace, filter your logs, or wait on the same rollback dialog. Now you investigate together: it queries and compares, you challenge it, you both look at the same evidence, and only you can approve a write.
How we implemented WebMCP
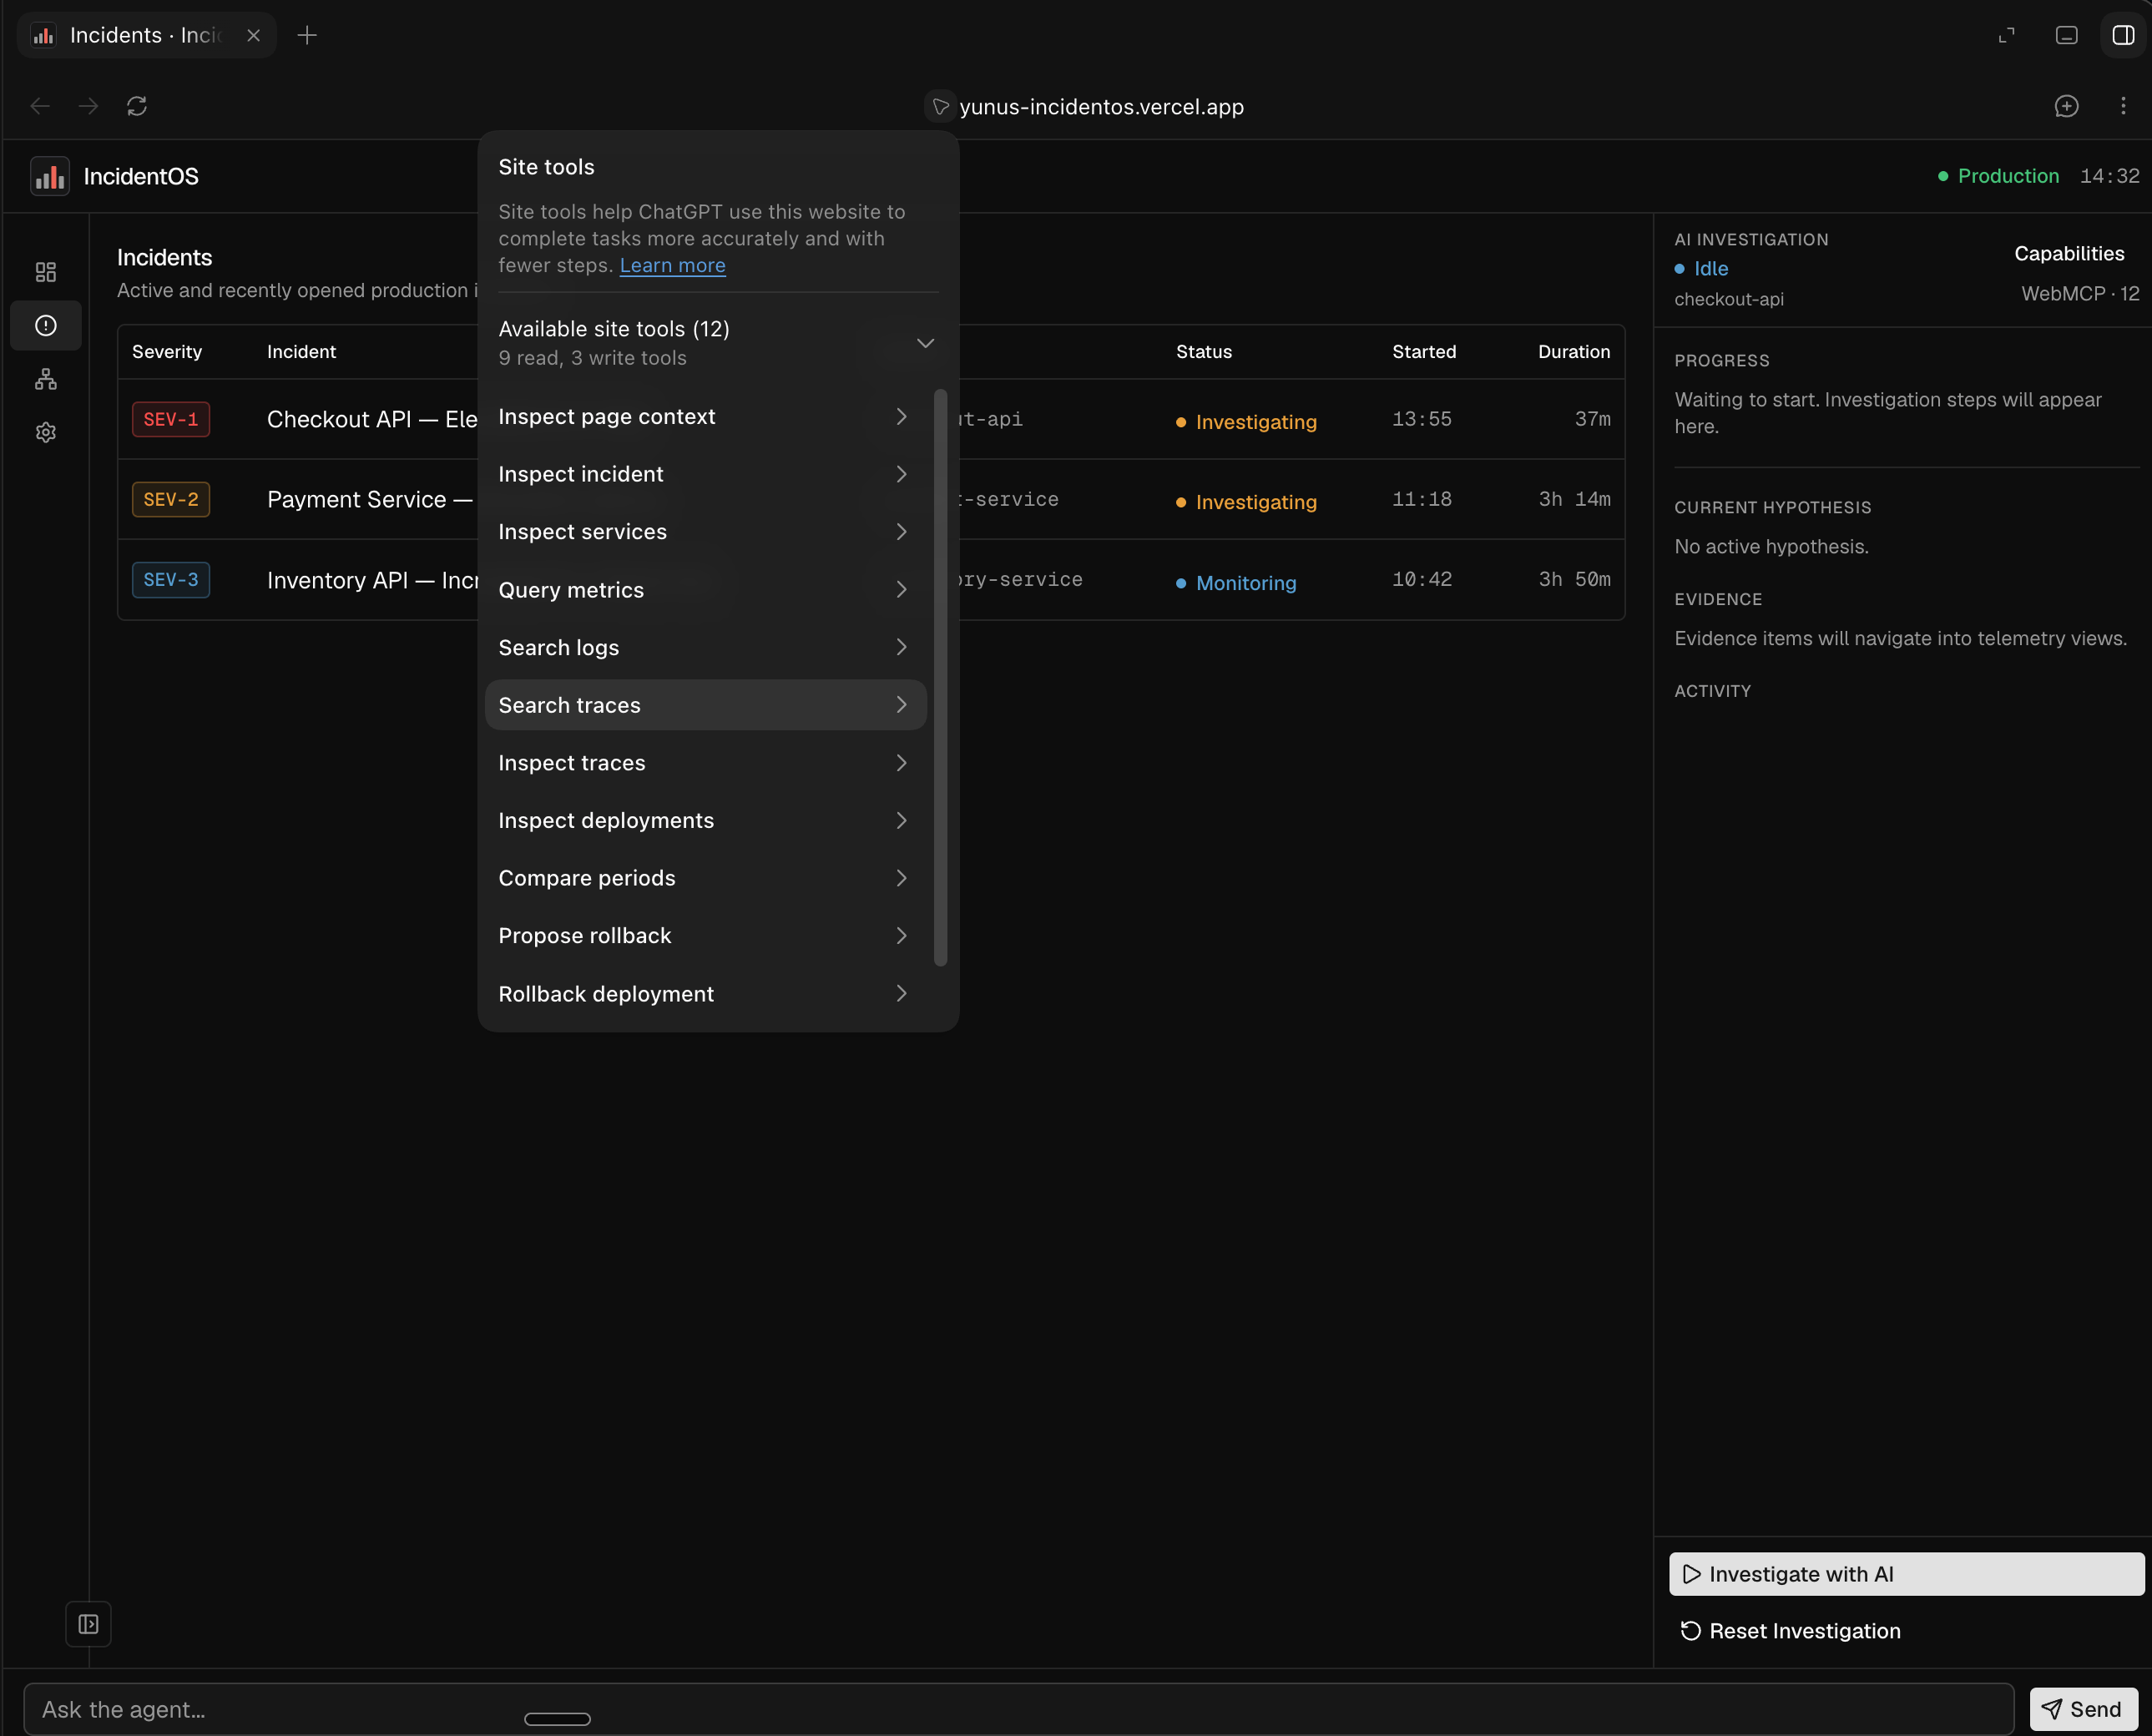
We register the twelve tools with document.modelContext.registerTool. Each one runs through executeIncidentTool. ChatGPT discovers them as site tools and calls them against the live session. Writes go through propose_rollback, which stays open until you Approve or Cancel. rollback_deployment only runs if the app already has a matching approved pending action.
Every tool models a domain capability, not a UI interaction. There is no click_tab or scroll_to_chart. That distinction is what makes the tool surface portable — the agent is operating the product's capabilities, not driving its interface.
Tool calls are split into 2 categories.
Observability is read-only: get_investigation_context, get_incident, get_service, query_metrics, search_logs, search_traces, get_trace, get_deployments, compare_periods.
Operations can write: propose_rollback, rollback_deployment, add_incident_note.
get_investigation_context turned out to be the most important tool and the one we did not plan. It is the "where am I" primitive: it returns the selected incident, the service, the frozen clock, the time range, the active workspace tab, the pending approval state, and the names of every registered capability. Because the agent and the human are looking at the same page, the agent should not have to ask what the human is looking at.
Underneath is a synthetic telemetry service with an internally consistent chain: deployment leads to database latency, which leads to p95, which leads to error rate, which leads to 500s, which leads to the alert, which leads to the incident. Five services, twenty-plus deployments, hundreds of traces and logs. The clock is frozen at 14:32 so the story never drifts between demos. 87 tests across 12 files cover the queries, filters, comparison math, rollback mutation, and reset — including a consistency test asserting that the deployment timestamp actually lines up with the metric inflection point, because a demo dataset that contradicts itself is worse than no dataset.
Challenges we ran into
The AbortSignal that silently unregistered everything. We passed the React effect's AbortSignal into registerTool, which is the reflex any React developer has. On unmount — including StrictMode's double-mount in development — aborting that signal tore down the registration. ChatGPT would complete two or three tool calls and then start returning AbortError on get_incident and propose_rollback. This was miserable to debug because the failure surfaced inside ChatGPT's transcript, not in our console. The fix was separating the wait-for-context signal from the registered execute, and having the registered execute ignore a host signal that is already aborted.
The host is not a uniform API. document.modelContext may not exist at mount, so registration retries for ten seconds. getTools() may not be implemented at all, so the in-app caller checks for it and falls back to local execution rather than assuming. Building against an emerging standard means treating the host as partially implemented and timing-variable.
Making one write tool serve two very different callers. propose_rollback has to block for ChatGPT — the call stays open until the human clicks Approve or Cancel, then resolves with status: approved — because a site-tool agent has no other way to learn the outcome. But the in-app agent needs it to return immediately and wait separately. And if the host cuts the wait short, the agent needs a way to recover, so get_incident carries approval.approved as a poll fallback. Getting a single tool to behave correctly under all three conditions was the hardest part of the build.
Prompt injection, which is not hypothetical here. Logs contain attacker-influenced text in any real system, so search_logs is annotated with untrustedContentHint. Tool descriptions describe only their own tool and never instruct the agent to call another one. Write tools never infer authorization from the contents of a read tool's result. And rollback_deployment requires a matching approved pending action in application state — the gate is a state machine, not a sentence in a prompt, so no amount of persuasive text in a log line can move it.
Determinism without dishonesty. A two-minute judging run has to behave identically every time, which argues for scripting everything. But scripting the agent would defeat the entire point. We drew the line explicitly: the telemetry is synthetic and the clock is frozen, the WebMCP integration is real. When site tools are unavailable the header says "WebMCP unavailable · in-app demo" so a scripted run is never mistaken for ChatGPT driving the page.
Accomplishments that we're proud of
It works with an agent we do not control. ChatGPT is a third party. We cannot patch it, fine-tune it, or script it into cooperating. The investigation holds together because the tool surface is well designed. honest names, descriptions that say exactly what one tool does, payloads small enough to reason over and that is a far harder bar than making our own agent look clever inside our own UI.
There is no demo path that fakes the real one. ChatGPT, the in-app script, and the optional in-app LLM all run through executeIncidentTool. Whatever a judge sees on the fallback path is the same code the primary path executes. When site tools are unavailable the header says so, rather than passing a script off as an agent.
The refusal is real. The agent reaches a diagnosis, proposes rolling back v2.31, and then stops and waits. Watching a capable agent hold at the edge of a production change is the moment the idea lands for people, and it is enforced by the application rather than requested in a prompt.
A judge cannot hit a dead end. No API key is required, the clock is frozen at 14:32, the dataset is consistent under test, and every route out of the incident URL leads somewhere real. Most of those 87 tests exist so that a two-minute run at an unpredictable moment behaves exactly like the one we rehearsed.
What we learned
Tool design is API design for an unusual consumer. Names, descriptions, and schemas are the entire developer experience, and the consumer reads your description exactly once before deciding whether to call you. Vague descriptions produce vague investigations.
Guardrails belong in application state, not in the prompt. Anything enforced by wording is advisory. The approval gate works because rollback_deployment checks a store value that only a human click can set.
Payload size is a design constraint, not an optimization. Query tools return stats plus a short sample while the charts keep the full local series, because a few hundred raw metric points per call would consume the context window that the reasoning needs.
The thing that makes it feel genuinely collaborative was not the agent's output quality. It was making the workspace move on every single tool call. Shared visible state is what turns "the AI told me something" into "we looked at this together."
What's next for IncidentOS
IncidentOS should help users to investigate every production incident this way — agents that can actually operate the observability surface, humans who stay in control of every mutating action, and a shared screen where both can see the same evidence.
That means connecting to real telemetry from the systems teams already run, covering more failure modes than a single checkout regression, and supporting on-call teams where several engineers and several agents work the same incident together.
Longer term, the same pattern, an application that exposes its capabilities to agents instead of bolting on a chatbot. Incidents is just where we started because it is where the stakes are highest. It can extend to a complete observability product and support features like dashboard creation, alert creation, querying logs, traces, infrastructure monitoring, AI observability and much more.
Built With
- chatgpt
- model-context-protocol
- next.js
- playwright
- radix-ui
- react
- recharts
- shadcn-ui
- tailwindcss
- typescript
- vercel-ai-sdk
- vitest
- webmcp
- zod
- zustand


Log in or sign up for Devpost to join the conversation.