-
-
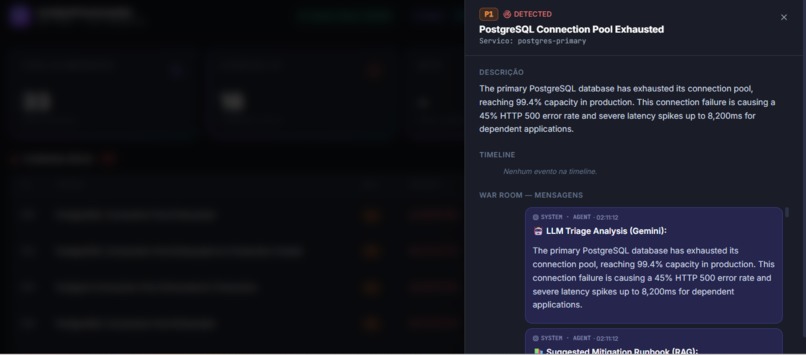
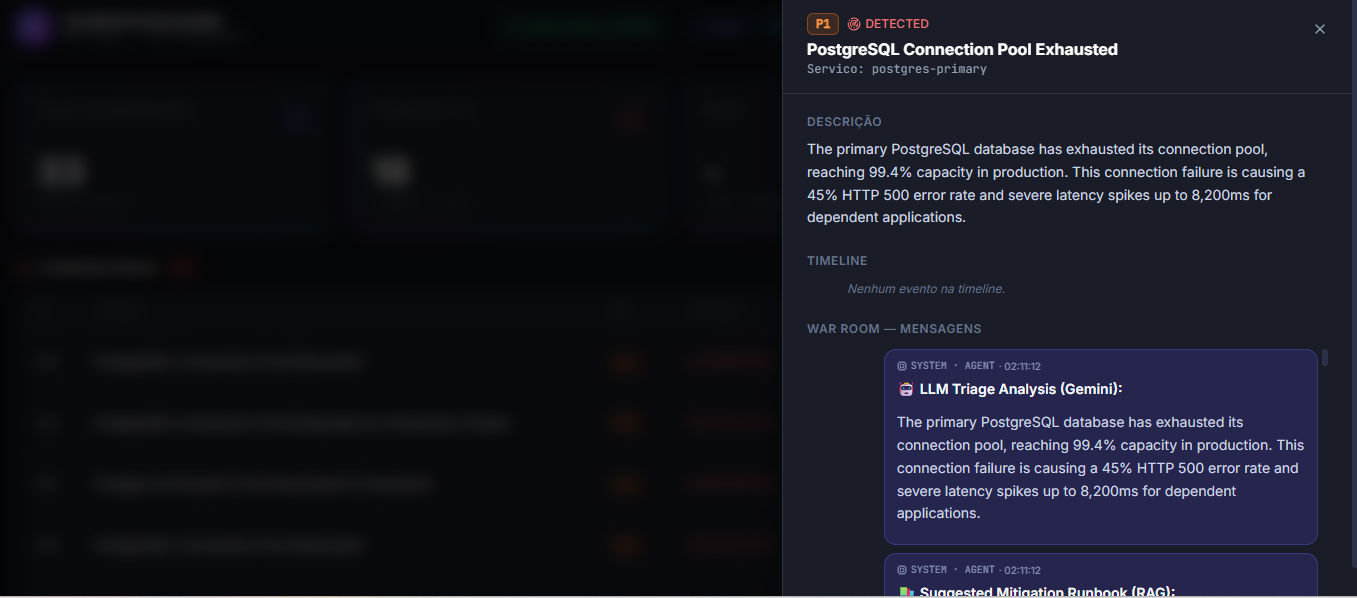
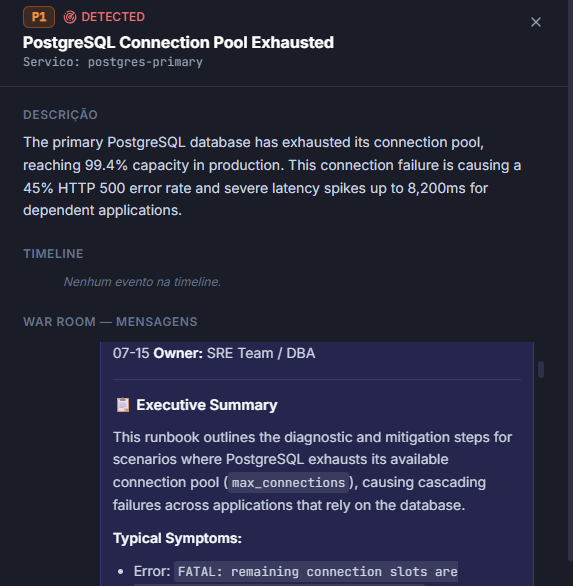
Incident detail view featuring automated Google Gemini LLM triage analysis and severe performance impact diagnostics.
-
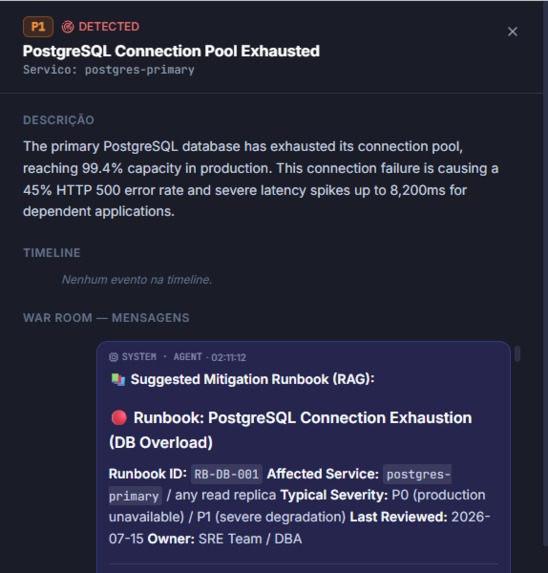
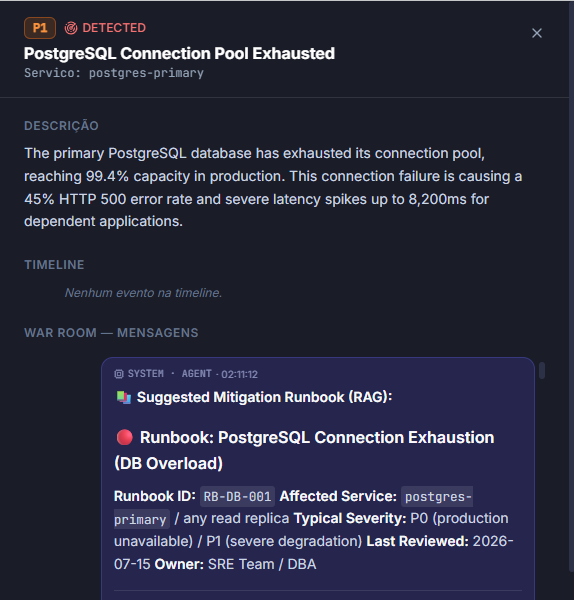
Automated RAG engine matching the critical incident to local vector-indexed PostgreSQL connection runbooks.
-
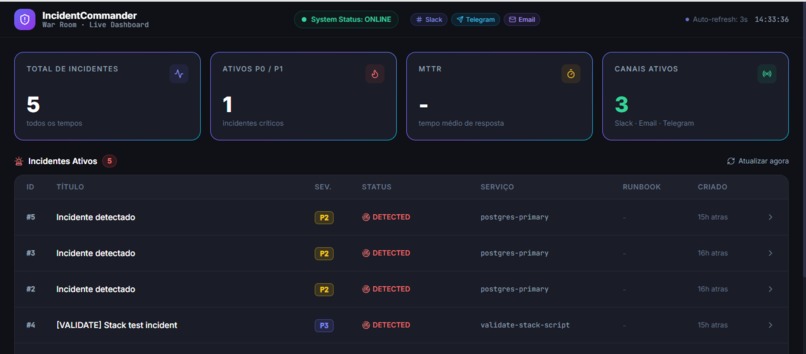
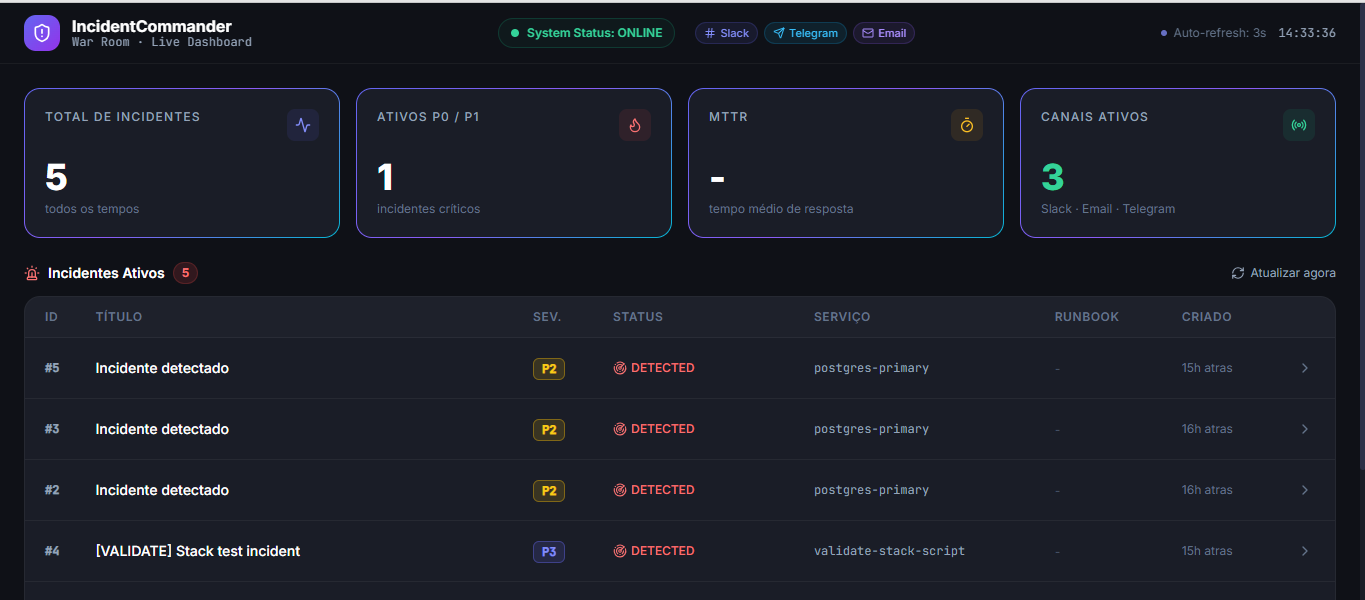
IncidentCommander dark mode dashboard showing live P0/P1 metrics, system status ONLINE, and active channels.
-
Detailed email content breaking down the root cause analysis and initial diagnostic steps.
-
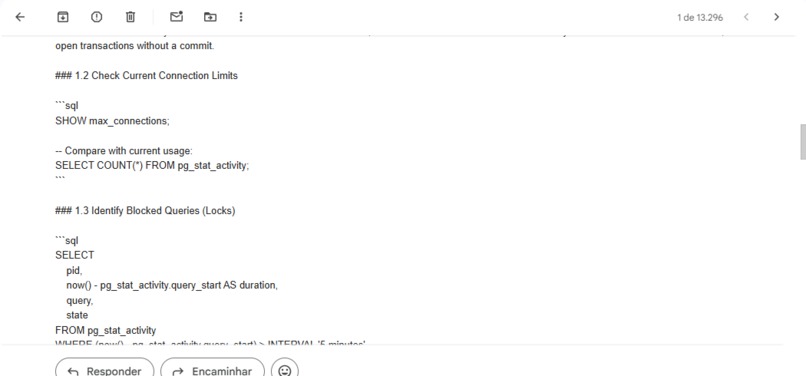
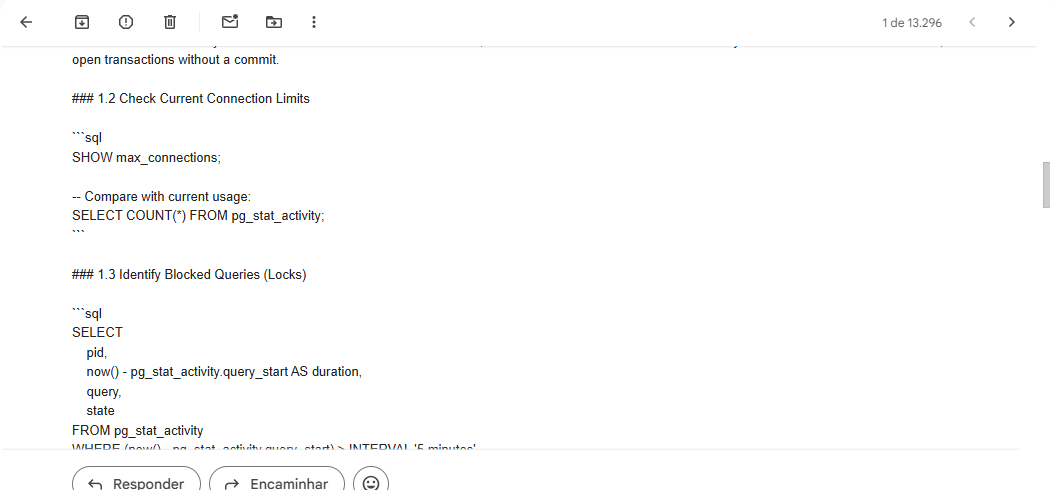
Ready-to-use production SQL commands embedded in the report for rapid database connection troubleshooting.
-
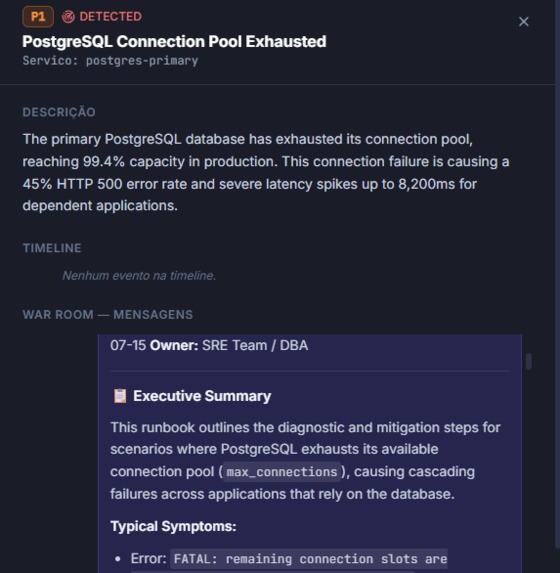
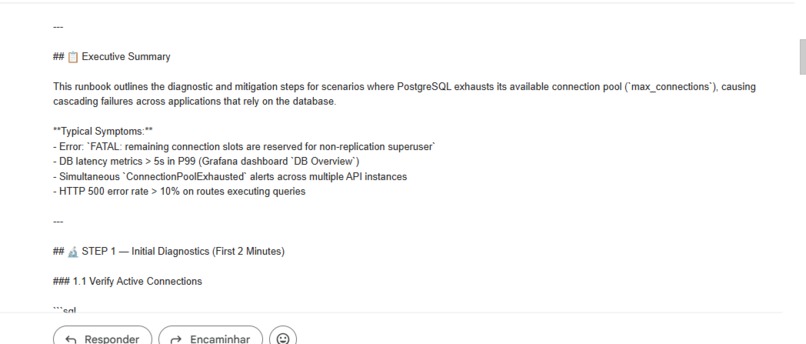
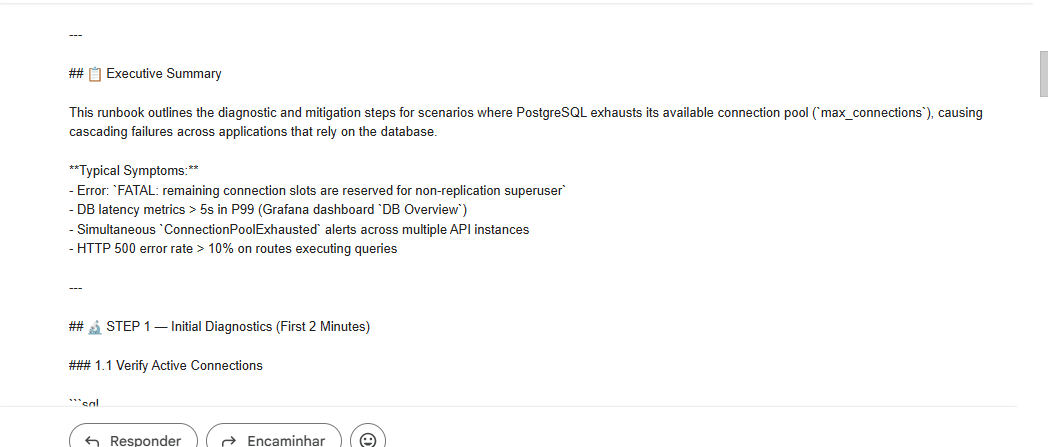
Executive summary outlining max_connections pool exhaustion patterns, cascading failures, and symptoms.
-
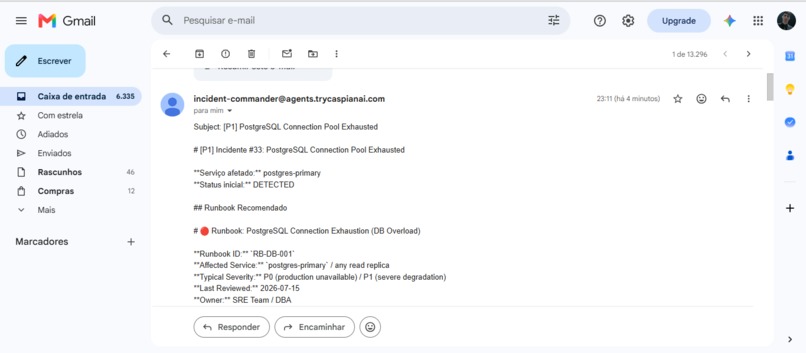
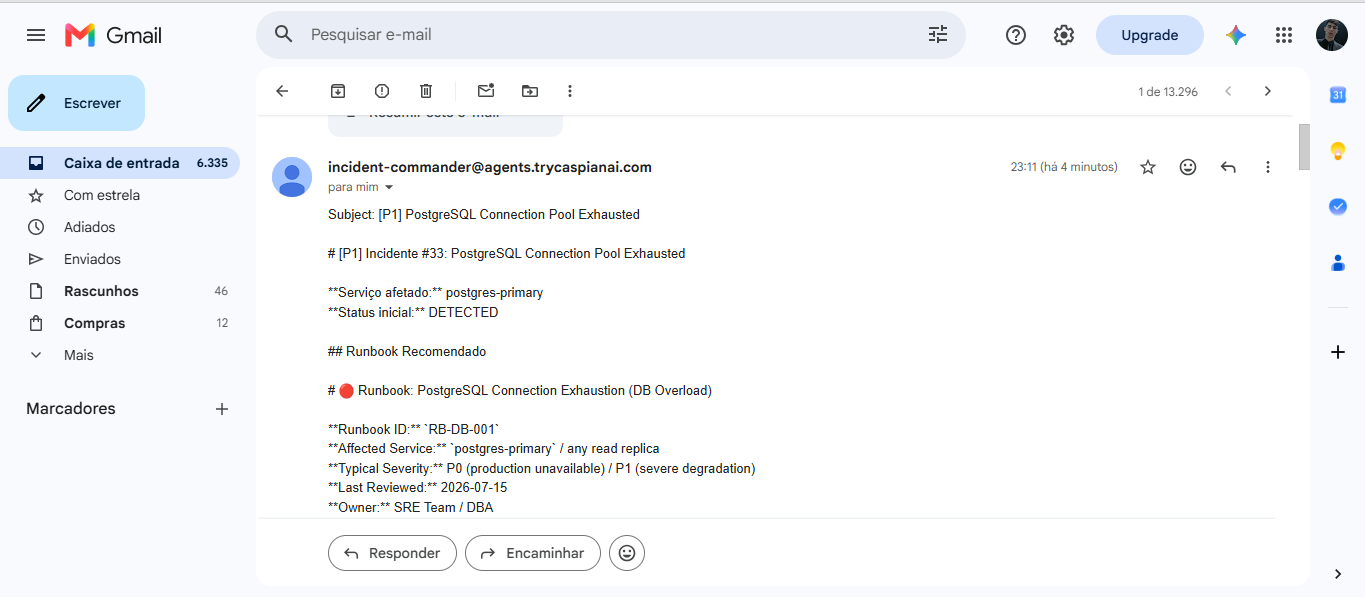
Automated executive incident report dispatched instantly via Caspian SDK to the SRE team inbox.
-
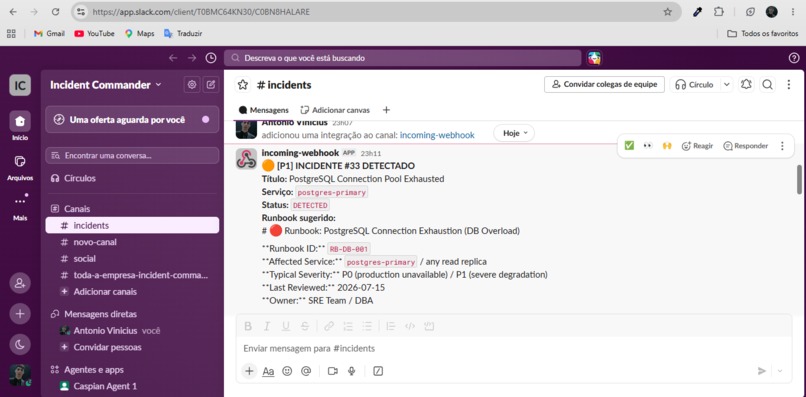
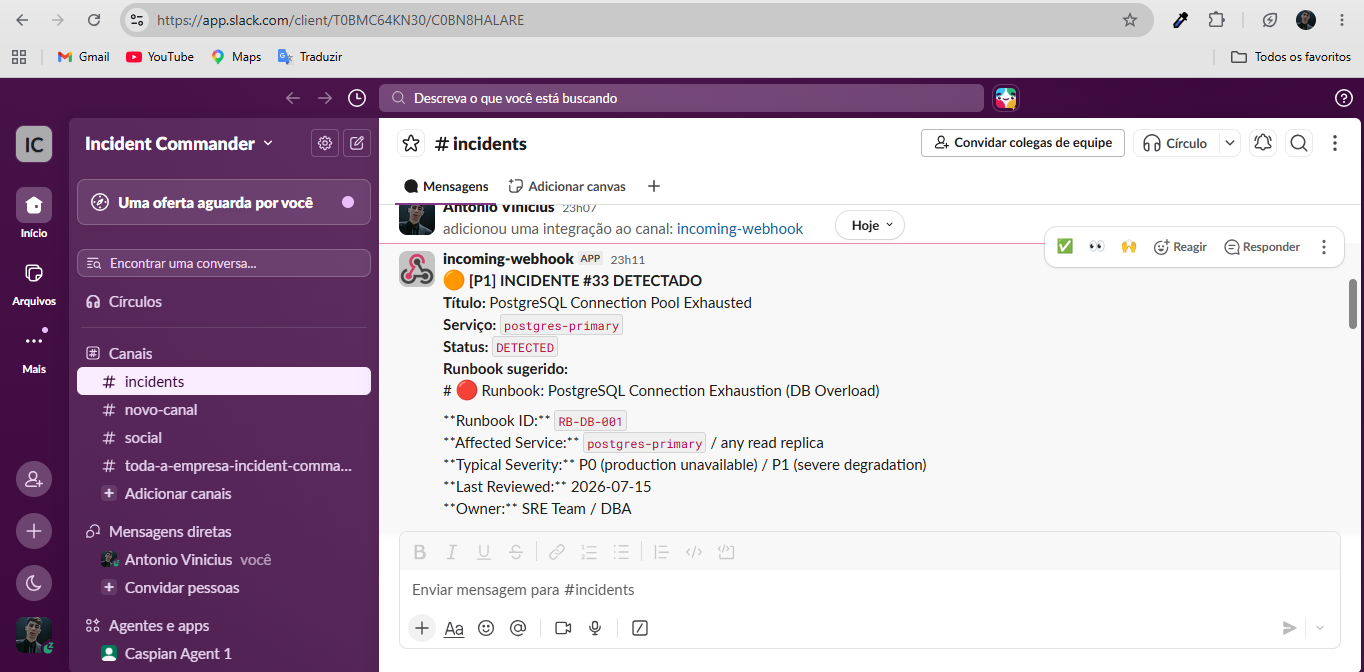
Automated Slack War Room alert broadcasting critical P1 status, service health, and runbook details.
-
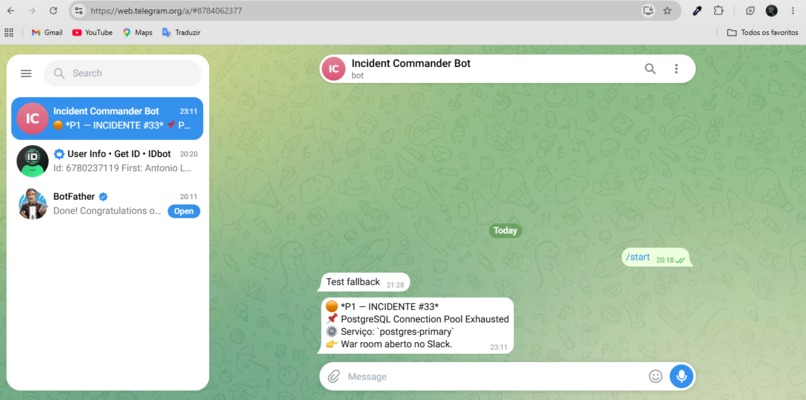
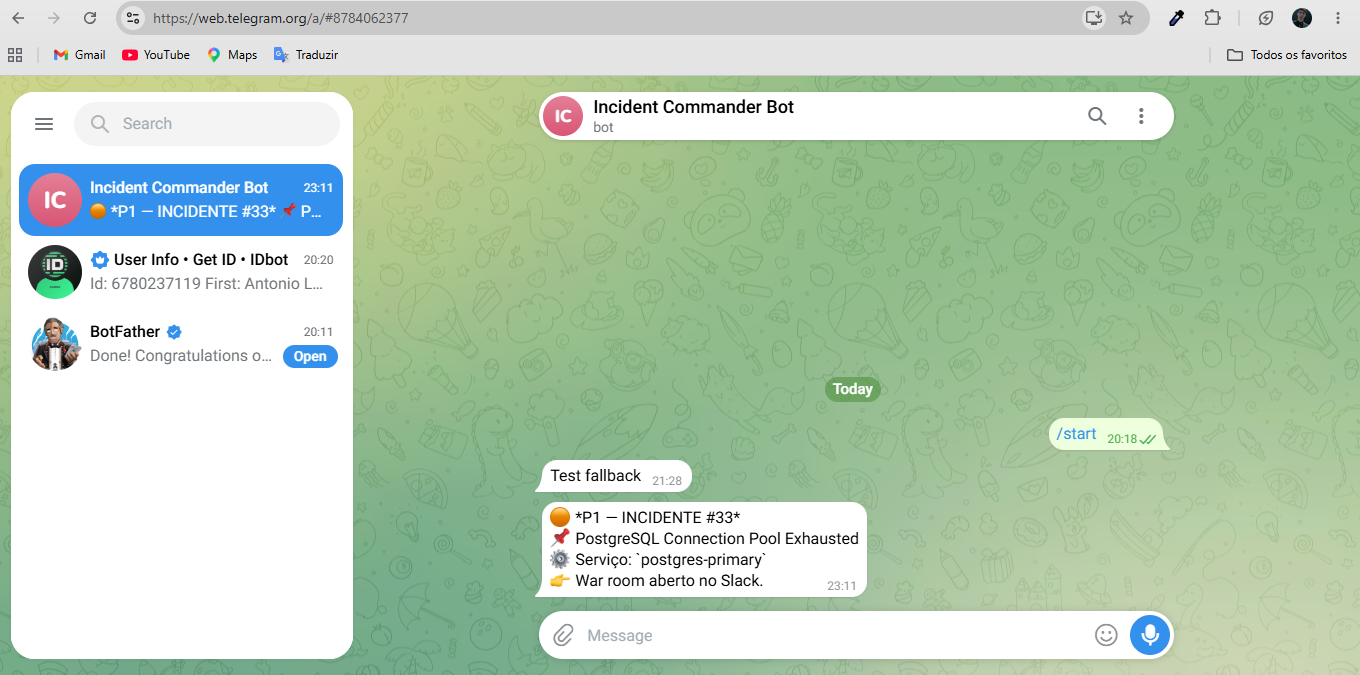
Instant emergency push notification delivered to the on-call engineer's mobile via Telegram bot.
IncidentCommander — Resilient AI-Powered War Room & Incident Orchestrator
💡 Inspiration: The $10,000/Minute Problem In critical production environments, every single minute of downtime costs companies thousands of dollars. When a P0 critical incident strikes at 3 AM (such as PostgreSQL connection pool exhaustion or microservice cascading failures), SRE teams face three major bottlenecks:
- Notification Delay & Fragmentation: Disjointed, silent alerts split across Slack, Email, and Telegram.
- Context Switching & Manual Toil: On-call engineers waste precious minutes hunting down runbooks and manual diagnostic logs.
- AI Fragility: Standard AI integrations crash when encountering API rate limits during traffic spikes.
We built IncidentCommander to be an autonomous, zero-downtime AI War Room manager—bridging the gap between raw monitoring webhooks and engineering teams by automating triage, communication, and RAG-based resolution.
🛠️ What It Does IncidentCommander handles the entire incident lifecycle in seconds with multi-layered fault tolerance:
⚡ Sub-second Webhook Ingestion:** Instantly catches alerts from tools like Grafana, Datadog, or Prometheus and triggers automated triage in under 2 seconds.
🧠 Resilient Multi-Model Failover:** Features a failover architecture. If the primary Gemini model encounters an HTTP 429 Rate Limit, the engine gracefully transitions to secondary models (e.g., gemini-1.5-flash), guaranteeing uninterrupted analysis.
📢 Omnichannel Caspian SDK Dispatch: Simultaneously broadcasts structured incident alerts to Slack, Telegram, and Email, utilizing native webhook fallbacks to bypass API rate limits or endpoint constraints.
📚 Local Vector RAG Runbooks: Queries a local ChromaDB vector database to instantly extract the exact mitigation steps and ready-to-run SQL fix scripts for the failing service.
📊 Live Command Dashboard: A real-time Dark Mode Web UI displaying active severity metrics, automated root-cause analysis, and latency impact breakdowns without requiring page reloads.
🏗️ How We Built It The stack was architected to be fast, asynchronous, and 100% free-tier friendly:
Backend & API: FastAPI (Uvicorn ASGI) for high-performance asynchronous event handling.
LLM Engine: Google Gemini API for lightning-fast root-cause analysis and structured remediation generation.
Omnichannel SDK: Caspian SDK to seamlessly handle cross-platform messaging across Slack, Telegram, and Email without building custom integrations from scratch.
Vector Database: ChromaDB running locally for instant RAG retrieval of Markdown (.md) runbooks.
State Management & UI: SQLite for incident logging, paired with a responsive Tailwind CSS Dark Mode frontend.
📐 SRE Performance Model (LaTeX)
To evaluate the operational impact of IncidentCommander on Mean Time to Resolution ($MTTR$), we model total recovery time as:
$$MTTR = T_{\text{detection}} + (1 - \alpha) \cdot T_{\text{triage}} + T_{\text{resolution}}$$
Where: $T_{\text{detection}}$ is the automated alert ingestion time ($\approx 0.15\text{s}$). $\alpha \in [0, 1]$ represents the AI Automated Triage Efficiency coefficient. By achieving $\alpha \ge 0.85$ via instant ChromaDB RAG runbook retrieval, IncidentCommander reduces operational triage time by over 80%.
🚧 Challenges We Faced
- API Rate-Limit Handling During Outage Spikes: Simulating severe production outages triggered rapid API calls. Implementing a seamless fallback between LLM parameters without dropping state or delaying the Webhook response required strict async concurrency handling in FastAPI.
- Unified Omnichannel Payload Formatting: Normalizing rich Markdown messages across different chat providers (Slack blocks vs. Telegram HTML vs. Email) while maintaining unified status through the Caspian SDK.
🏆 Accomplishments We're Proud Of
True Zero-Downtime Resilience:** Proven live in our demonstration—when the primary AI hits a 429 rate limit, the system self-heals and completes the triage seamlessly. Sub-second RAG Triage:** The pipeline from webhook payload $\rightarrow$ LLM reasoning $\rightarrow$ Vector Runbook Search $\rightarrow$ Omnichannel dispatch completes in under 2 seconds. Leveraging Caspian SDK: Building a single dispatch pipeline that reaches engineers across three distinct communication channels simultaneously.
🎓 What We Learned
AI Systems Need SRE Principles Too: Relying on a single LLM model in production is a single point of failure. Multi-model fallback mechanisms are mandatory for mission-critical AI applications. Power of Caspian SDK: Unifying messaging APIs saved days of development, allowing us to focus entirely on the AI reasoning layer.
🔮 What's Next for IncidentCommander
One-Click Auto-Remediation: Allowing engineers to approve and execute recommended SQL or Kubernetes fix scripts directly from Slack or Telegram. Multi-Cloud Telemetry Streaming: Direct integration with AWS CloudWatch, Datadog, and OpenTelemetry.


Log in or sign up for Devpost to join the conversation.