Incident Response Agent
Inspiration
Production outages are stressful because the answer is never in one place. Metrics live in Prometheus, logs live in another tool, and the on-call engineer still has to connect the dots under pressure.
We wanted to build something closer to how a strong SRE actually works: see an alert, pull context, reason about the cause, suggest a fix, and even start the remediation.
Our inspiration was simple:
What if the first pass of incident triage, and the first draft of a fix, could be automated before someone opens five dashboards and starts grep-ing the repo?
What it does
Incident Response Agent is an AI-assisted on-call system for microservices.
When something goes wrong, service downtime, dependency failures, or rising 5xx errors, Prometheus detects the issue and Alertmanager sends a webhook to our agent.
The agent then:
- Queries Prometheus for live metrics (
up, 5xx rates) - Queries Loki for recent logs from the affected service
- Runs analysis using a local LLM (Ollama / mistral-nemo)
- Sends structured incident emails with:
- highlights
- likely root cause
- suggested fixes
- Logs the full analysis for Grafana and debugging
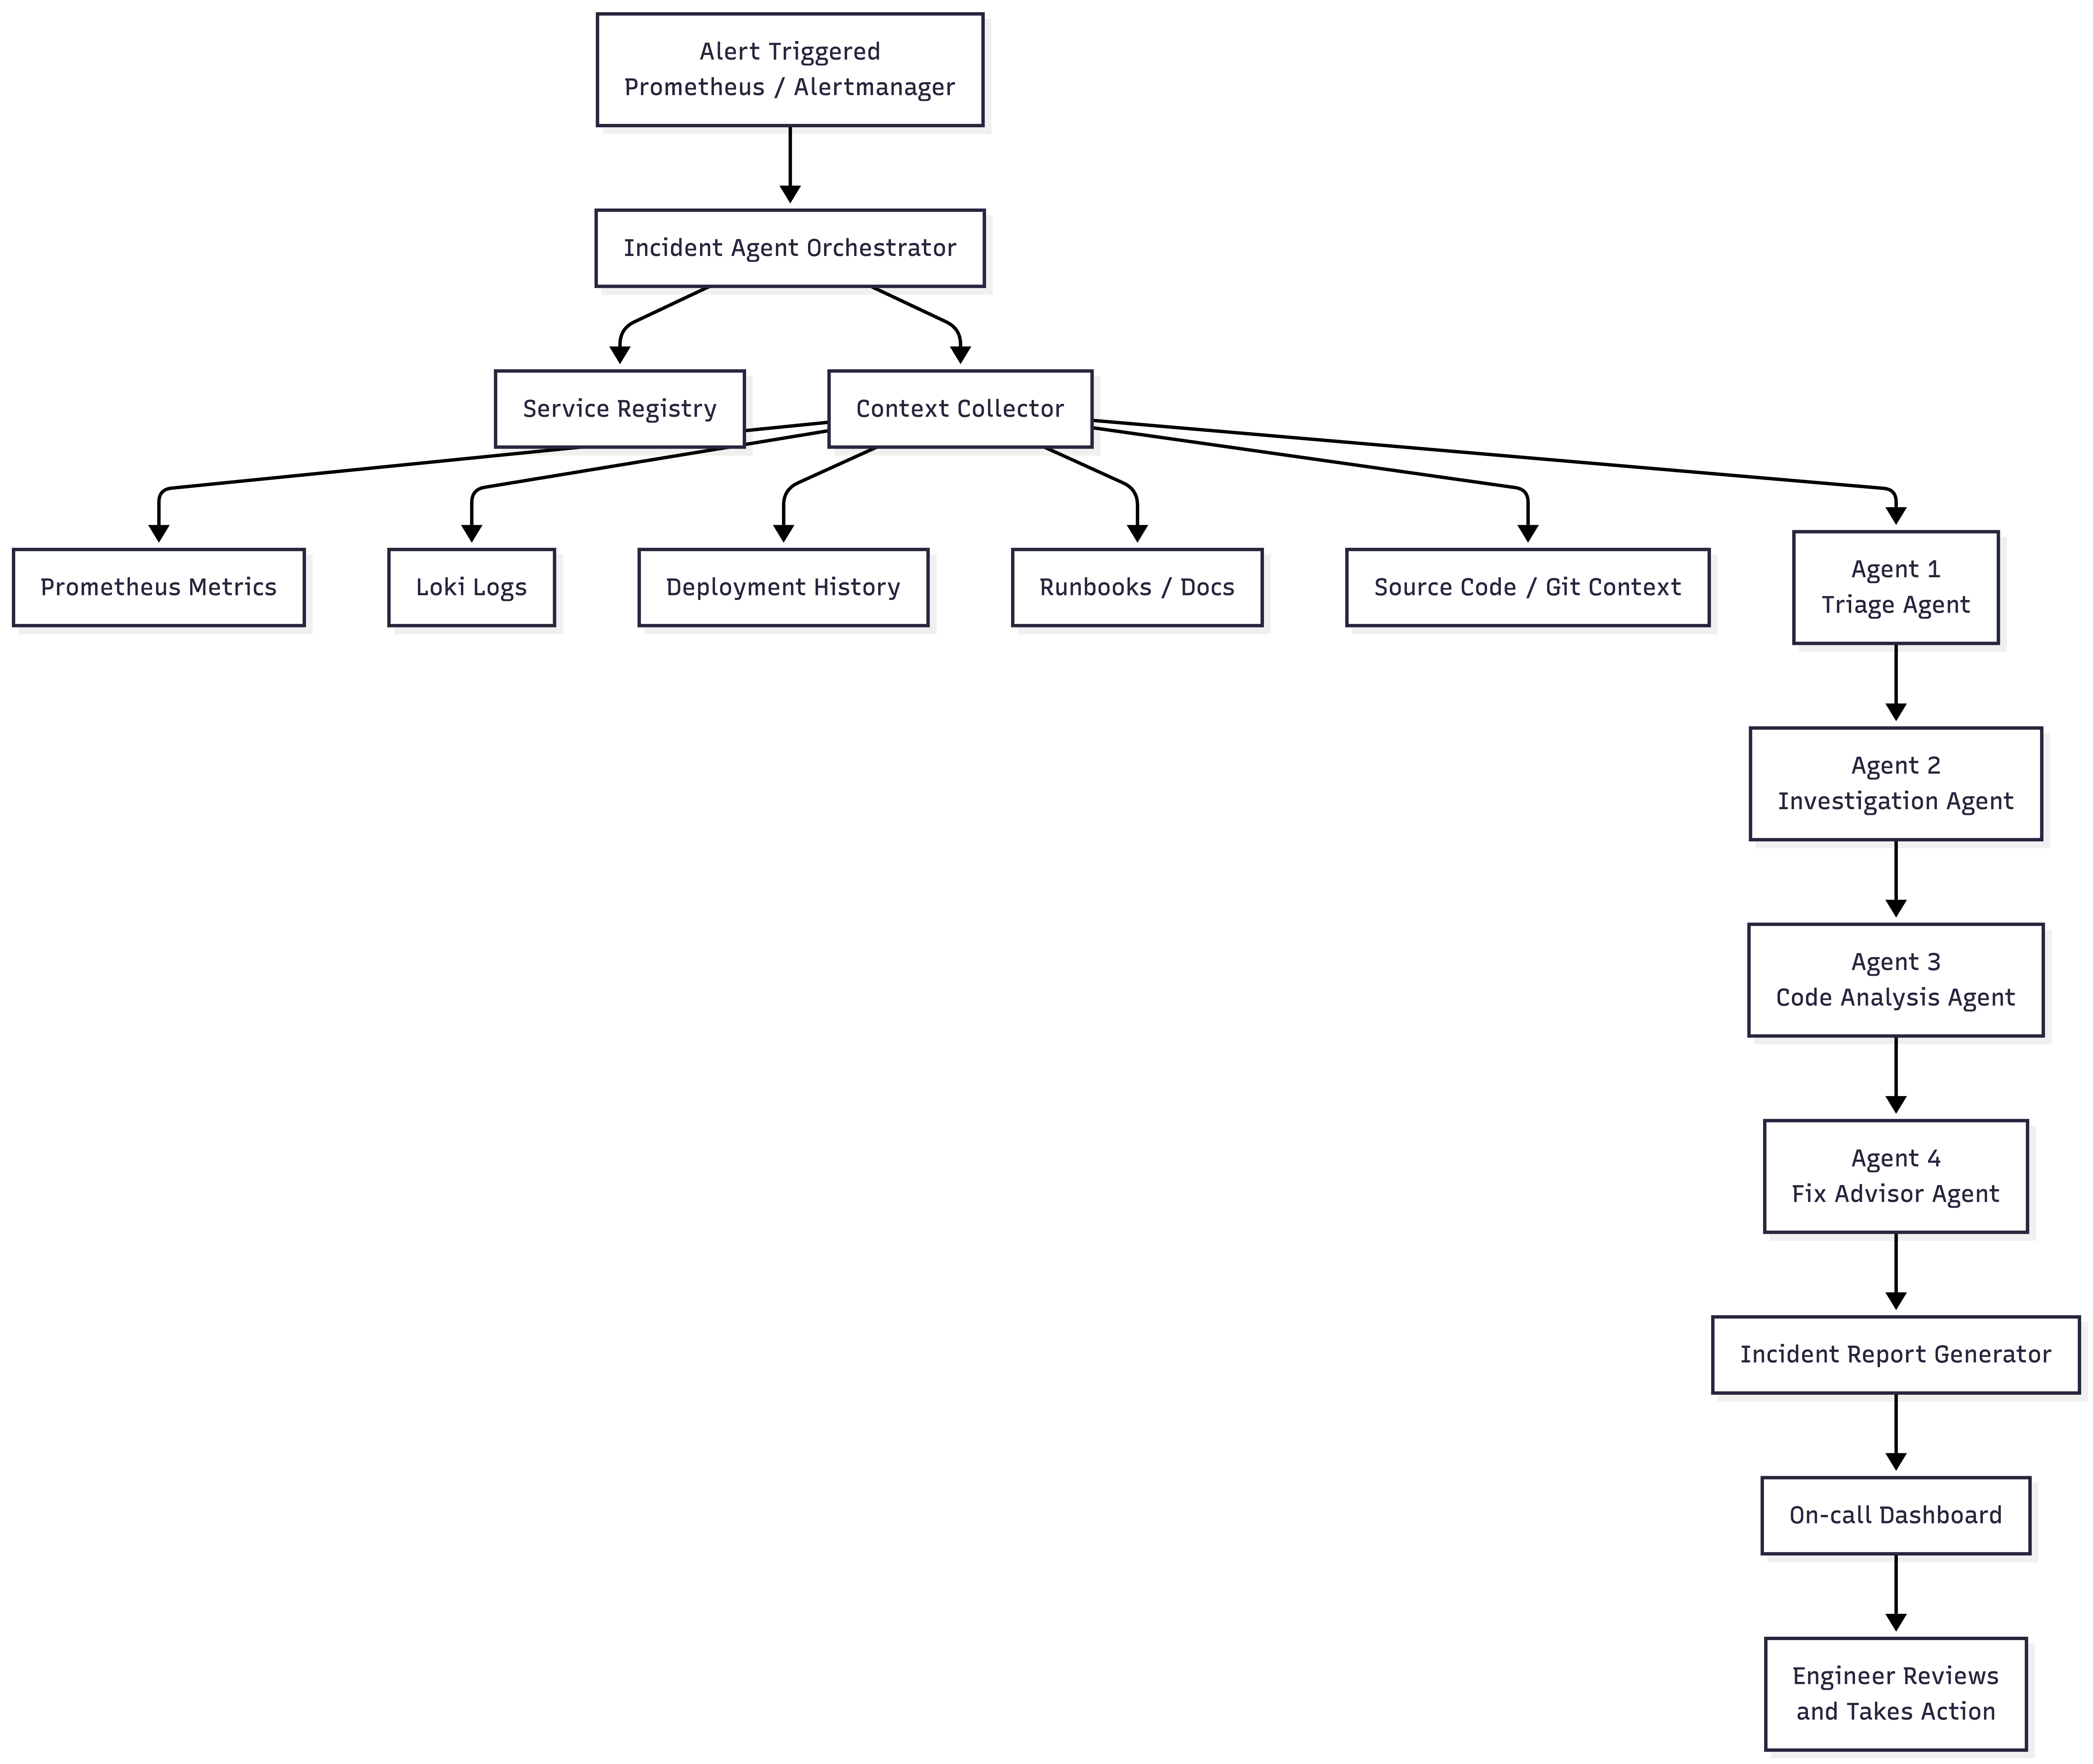
For deeper incidents, we built a 3-agent GPT pipeline:
Agent 1: Triage & Service Resolution
- identifies affected services
- resolves service configuration/context
Agent 2: Investigation
- performs health checks
- extracts stack traces
- scans logs and errors
Agent 3: Root Cause Analysis
- pinpoints the issue at the
file:linelevel in source code - proposes a concrete code fix
- pinpoints the issue at the
If the pipeline finds a reliable fix, it can automatically create a draft GitHub pull request for engineers to review instead of starting from scratch.
We also generate automated Word incident reports for postmortems and demos.
How we built it
We orchestrated the entire stack using Docker Compose so the full environment can run with a single command.
Application Layer
- FastAPI microservices
- Prometheus
/metricsendpoints - File-based logging
Observability Stack
- Prometheus for metrics and alert rules
- Alertmanager for webhook dispatch
- Promtail -> Loki for log aggregation
- Grafana dashboards for visualization
Alert Workflow
When an alert fires:
- Alertmanager sends a webhook
incident-agent-workflowreceives the alert- The workflow gathers:
- PromQL metrics
- LogQL log context
- Context is sent to Ollama running locally
- The LLM response is parsed into:
- highlights
- likely issue
- suggested fix
- Results are emailed through the notifier service
Notification System
- FastAPI notifier service
- SMTP integration
- Mailpit support for local demos
- Real SMTP support (e.g. Gmail) via environment variables
Deep Investigation Pipeline
We built a multi-agent GPT-4o workflow with custom tools for:
- log analysis
- health checks
- git operations
- repository inspection
Draft PR Automation
After root-cause detection:
- the system generates a patch
- creates a minimal diff
- opens a draft PR on GitHub for human review
Reporting
Automated .docx reports are generated using:
monitor_service.pyreport_generator.py
We also documented the architecture using Mermaid diagrams in:
README.mdarchitecture.md
Challenges we ran into
Docker <-> Host LLM Communication
Ollama runs on the host machine, so containers needed reliable access using host.docker.internal.
Observability Integration
Aligning:
- Prometheus targets
- alert labels
- Promtail paths
- Loki queries
was surprisingly difficult. Incorrect labels often resulted in missing log context.
Useful Notifications
Raw LLM output was too noisy. We redesigned the response parser so notifications are concise and scannable during incidents.
SMTP Support
- real SMTP providers
required careful environment configuration and fallback handling.
Safe PR Automation
Automatically generating pull requests introduced challenges around:
- branch naming
- limiting diffs
- preventing unsafe merges
We intentionally restricted the system to draft PRs only.
Two AI Paths
We separated:
- fast local Ollama triage
- deep GPT investigation
so users clearly understand which level of analysis is running.
Accomplishments that we're proud of
- Built a complete incident-response loop:
- alert -> metrics/logs -> AI analysis -> notification -> remediation proposal
- Created a production-style observability stack instead of a standalone chatbot
- Generated structured, actionable incident summaries
- Automated draft PR creation from root-cause analysis
- Combined fast local inference with deeper multi-agent investigation
- Designed the platform to be easily extensible using service registry configuration
- Added architecture diagrams and strong documentation for demos and onboarding
What we learned
- Alerts are only the trigger, context is the real product
- AI analysis is only as useful as the telemetry attached to it
- Structured notifications matter more than verbose explanations during outages
- Automation should stop at “draft” until humans verify fixes
- Multi-agent systems grounded with tools outperform prompt-only workflows
- Infrastructure glue (webhooks, labels, Compose networking, logging paths) matters just as much as the model itself
What's next for Incident Response Agent
Smarter PR Generation
- confidence scoring
- automated test generation
- “do not open PR” safeguards when uncertainty is high
More Notification Channels
- Slack integration
- PagerDuty integration
- mobile-friendly escalation paths
Unified Incident Routing
Simple alerts:
- local Ollama triage
Complex alerts:
- deep GPT pipeline + automated draft PRs
Feedback Loop
Allow engineers to rate:
- analysis quality
- PR usefulness
to improve prompts and workflows over time.
Runbook & Ticketing Integration
- Jira integration
- Linear integration
- automatic incident linking
Built With
- fastapi
- gpt
- graffana
- ollama
- prometheus
- python

Log in or sign up for Devpost to join the conversation.